Article
J. Braz. Chem. Soc., Vol. 22, No. 10, 1872-1879, 2011. Printed in Brazil - ©2011 Sociedade Brasileira de Química 0103 - 5053 $6.00+0.00
A
*e-mail: [email protected]
Styrene Photocatalytic Degradation Reaction Kinetics
Silvio R. Taffarel,a Marla A. Lansarin*, a and Celso C. Morob
aDepartamento de Engenharia Química, Universidade Federal do Rio Grande do Sul,
Av. Eng. Luis Englert, s/n, 90040-040 Porto Alegre-RS, Brazil
bInstituto de Química, Universidade Federal do Rio Grande do Sul,
Av. Bento Gonçalves, 9500, CP 150003, 91501-970 Porto Alegre-RS, Brazil
A reação de degradação fotocatalítica do estireno foi estudada utilizando-se TiO2 P-25
(Degussa) como catalisador. Os experimentos foram realizados em um reator “slurry” em bateladas, com controle de temperatura, empregando-se uma lâmpada UV. Foram estudados os efeitos do pH, da concentração inicial de estireno, da concentração do catalisador e da adição de H2O2 sobre
a velocidade da reação. Os resultados mostraram que, em 90 min, cerca de 95% da quantidade inicial da molécula foi consumida por fotocatálise. Veriicou-se também que a reação segue uma cinética de primeira ordem para concentrações iniciais de estireno, entre 15,27 e 57,25 ppm, a 30 °C. A análise cromatográica das amostras coletadas durante os experimentos de fotodegradação identiicou o benzaldeído como um dos intermediários dessa reação. Além disso, a adição de H2O2
aumentou a velocidade de degradação.
The aqueous styrene photocatalytic degradation reaction was evaluated using TiO2 P-25
(Degussa) as a catalyst. These experiments were accomplished in a batch slurry reactor with temperature control and a UV lamp. The effects of the initial styrene concentration, the catalyst concentration, the hydrogen peroxide addition and the initial pH of the solution on the reaction were evaluated. The experimental results showed that in 90 min, 95% of the initial styrene was degraded by photocatalysis. It was veriied that the styrene degradation rate its a pseudo-irst-order kinetics for initial styrene concentrations between 15.27 and 57.25 ppm, at 30 °C. The chromatographic analysis of the samples collected during the photocatalytic degradation revealed benzaldehyde as one of the intermediates. The addition of H2O2 accelerated the degradation reaction until the
system reached a certain optimum peroxide concentration in the reactor. Further H2O2 additions
resulted in a reaction rate reduction.
Keywords: styrene, photocatalysis, TiO2, reaction kinetics, benzaldehyde
Introduction
Styrene is potentially present in food, drinking water, indoor air or the environment as a result of direct releases or leaching of residual monomer from polymers. This toxic compound has a detrimental effect on wildlife and marine organisms, and it is potentially carcinogenic.1
In spite of its toxicity, the literature dealing with styrene photocatalytic degradation is scarce. Few articles regarding gas-phase photocatalytic oxidation of styrene in a tubular reactor 2 and in a luidized-bed3,4 are available, but nothing
regarding contaminated wastewater is available. Styrene solubility in water is 300 mg L-1 (20 ºC), and its vapor
pressure is 5 mm Hg at 20 ºC and 1 atm.1,5 These solubility
characteristics allow styrene to be a major pollutant in water. Estimated half-lives of styrene in surface waters range from 1 h in a shallow body of water to 13 days in a lake. The half-life of styrene in ground water is estimated at 4-30 weeks.5
Photocatalysis is one of the advanced oxidation processes and is based on the formation of the HO• radical,
a highly oxidizing agent. There are many studies in the literature dealing with wastewater photocatalytic treatment. Efforts are underway for dealing with dyes,6,7 as well
as water polluted with fungicides,8,9 antibiotics10,11 and
insecticides,12 among other toxic molecules.13
were (i) to evaluate the kinetics of styrene disappearance and (ii) to examine the effect of several parameters including catalyst mass, initial styrene concentration, oxidants addition and pH change.
Experimental
Reagents
Titanium dioxide P-25 (Degussa) was used as a catalyst. This product contains mainly anatase and has a speciic surface area of 50 m2 g-1 and a particle size of 30 nm.
The reactant, styrene, was kindly provided by the Innova Petroquímica Company. The water used was previously distilled. HCl and NaOH solutions were used to adjust the pH.
Apparatus
The photocatalytic bath reactor used in these experiments was made from cylindrical glass with a 13 cm height and a 10.5 cm inner diameter. The reactor was provided with a jacket for water circulation.
A 28 W UV lamp (3.8 mW cm-2) was the radiation
source used, and it emitted light with wavelengths between 320 and 400 nm, with a maximum of 365 nm (the optimum for TiO2).14 The lamp position was ixed so that the distance
between the lamp and the reactor top was 2 cm, without variation from one experiment to another. In order to avoid styrene mass transfer to the vapor phase, the reactor was covered with a PVC ilm.
To evaluate the possible inluence of the PVC ilm on the incident radiation at the reactor surface, the ilm used to cover the reactor was analyzed to determine its transmittance. At 365 nm, the ilm reduces the transmittance by approximately 12.9%.
Photodegradation and adsorption tests
Styrene solutions were prepared and maintained under agitation for 8 h, after that pH was adjusted if necessary. The reactor was charged with 900 mL of styrene solution
and TiO2, isolated with the PVC ilm and operated in the
dark (without UV irradiation) during the irst 40 min so that the equilibrium adsorption of organic molecules by the catalyst was reached. Each experiment was accomplished using agitation and constant temperature. Before each photodegradation experiment, the UV lamp was preheated for 30 min to obtain a constant light intensity during the tests. Sample collections were done using a syringe, and the samples were then centrifuged for catalyst removal. A
2 mL aliquot was collected after 0, 15, 30, 60, and 90 min of reaction time.
To evaluate the amount of available oxygen for the reaction, the dissolved oxygen was measured during one typical experiment. This was done using the electrodes of a Biostat® Fermentator (B. Braun Biotech International).
The pH was also measured during this experiment.
Analysis
The styrene concentration was monitored using a gas chromatograph (Auto System XL, Perkin-Elmer) equipped with a lame ionization detector (FID). The styrene was quantiied using calibration curves.
The reaction intermediates were analyzed by a gas chromatograph (Agilent-6890) coupled to a mass selective detector (Agilent-5973). Total organic carbon (TOC) was analyzed by a StarTOC Benchtop TOC analyzer (Star Instruments Inc.). The inluence of the PVC ilm on the incident radiation at the reactor surface was analyzed by a
UV-Vis spectrophotometer (VARIAN Cary 300®).
The radiant lux of the UV source was determined by a digital radiometer (EW-09811-50 Cole-Parmer Instruments Co., half bandwidth of 12 nm ± 2 and accuracy 5%).
Results and Discussion
Adsorption
Several preliminary experiments were performed before initiating the styrene photocatalytic degradation tests. First, adsorption tests were carried out in the dark in order to determine the minimum styrene-catalyst contact time that guaranteed adsorption equilibrium at the catalyst surface for each of the pH values used. This test was important to ensure that when initiating the reaction by lamp activation, the disappearance of styrene was due to photocatalytic degradation. The results are shown in Figure 1.
The styrene was adsorbed onto the TiO2 surface, and
the adsorption equilibrium was reached at 40 min. The equilibrium concentration of the styrene solution was determined after adsorption, and the initial concentration of styrene for kinetic analysis was also determined. The pH effect is discussed later in this work.
Styrene loss for the environment and degradation
tests, the reactor was maintained at the standard operation conditions (T, pH, rpm). It was observed that the styrene loss to the environment is a reproducible phenomenon and has a minor role, as evident in Figure 2. This igure also shows that non-appreciable styrene photodegradation occurs after 90 min of irradiation without TiO2 (photolysis).
The photolysis results presented in this Figure had been corrected: the amount of styrene lost to the atmosphere was added point to point, in order to allow that each process is visualized individually. On the other hand, when the styrene
solution mixed with TiO2 was exposed to UV radiation, a
fast decrease in the styrene concentration occurred, and 95% degradation for an initial concentration of 24.2 mg L-1
was reached in 90 min. The styrene concentration reached the GC limit of detection (approximately 0.001 mg L-1)
after 180 min.
The representative rate of styrene photodegradation was obtained only during the first 30 min because, after this initial time, there could be interference from intermediate product(s) formed. This procedure allows for the determination of a pseudo-irst-order apparent rate
constant of 0.0445 min-1, which is shown in Figure 3. In this
Figure, “Co” represents the initial concentration of styrene
and “C” is its instantaneous concentration.
Measures of dissolved oxygen and pH during the reaction
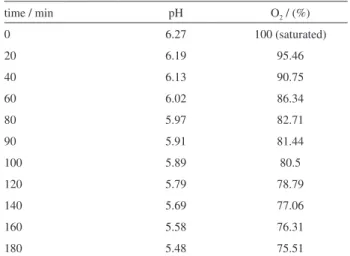
The oxygen is important in the photocatalytic process, being usually continuously injected in the reactor. In the present study was necessary to cover the reactor with a PVC ilm and oxygen was not supplying to the reactor. So, to evaluate the oxygen readiness during the reaction, measures of the dissolved oxygen were done. The results are presented in Table 1. In this table the pH behavior is also presented.
As can be observed, in 90 min reaction the oxygen consumption was of approximately 18%. The remaining oxygen is enough to guarantee the process eficiency. It is also possible to observe in the Table 1 that the solution pH varies from 6.2 to 5.5. The pH reduction is due, mainly, to the formation of CO2 and H+. Besides, the benzaldehyde
Figure 1. Styrene adsorption on the TiO2 surface (T = 30 °C, C0 = 55.3 mg L-1 and Ccat = 0.55 g L-1).
Figure 2. Styrene concentration variation with time (T = 30 °C, pH 6.25, C0 = 24.2 mg L-1 and C
cat = 0.55 g L-1).
Figure 3. Relationship between ln(C0/C) and irradiation time (T = 30 °C, pH 6.0, C0 = 25 mg L-1 and Ccat = 0.55 g L-1).
Table 1. Dissolved oxygen and pH
time / min pH O2 / (%)
0 6.27 100 (saturated)
20 6.19 95.46
40 6.13 90.75
60 6.02 86.34
80 5.97 82.71
90 5.91 81.44
100 5.89 80.5
120 5.79 78.79
140 5.69 77.06
160 5.58 76.31
formation also takes to the decrease of this variable. The pH plays an important role in the photocatalytic process and it will be further discussed.
Effect of initial styrene concentration
The effect of initial styrene concentration was evaluated over the range of 15.3 to 57.3 mg L-1, corresponding to
1.47 × 10⁻⁴ and 5.50 × 10⁻⁴ mol L-1. Figure 4 shows the
normalized concentration against irradiation time for several initial concentrations of styrene.
Increasing styrene concentration decreases its degradation rate. Similar results have been presented for the photocatalytic oxidation of other organic compounds.15-17
According to Ishiki et al.18 this decrease may be due to
the ixed active site number at the TiO2/H2O interface.
Therefore, at low styrene concentrations, a larger number of water molecules will be adsorbed onto the available TiO2
particles, producing hydroxyl radicals and leading to a rapid oxidation process. On the other hand, at higher styrene concentrations, there is a smaller ratio of water molecules to free active sites, because the number of active sites remains the same. Consequently, competitive adsorption between the styrene and water molecules increases and leads to a decrease in the degradation rate.
The Langmuir-Hinshelwood rate expression has been successfully used to describe the relationship between the heterogeneous photocatalyst degradation rate and the initial pollutant concentration.19-22 In this study, a
reasonable agreement (R2 = 0.9687)was obtained between
the experimental results and the linear form of the L-H expression (equation 1). This expression used values of 1.46 × 10⁻⁵ mol L-1 min-1 and 2.92 × 10³ mol-1 L for the
reaction kinetic constant (k) and the adsorption constant (K), respectively. This indicates that the photodegradation
rate of styrene can be described by the Langmuir-Hinshelwood model.
(1)
Under our experimental conditions, the apparent pseudo-irst-order constant (0.0445 min-1) is the multiplication
product of the adsorption constant and the kinetic constant, because for dilute solutions the denominator of the L-H expression approaches unity. If the constants obtained through the linear adjustment are multiplied, the outcome is 0.0425 min-1. The small difference between the measured
rate constant and the predicted value conirmed the quality of the experimental result.
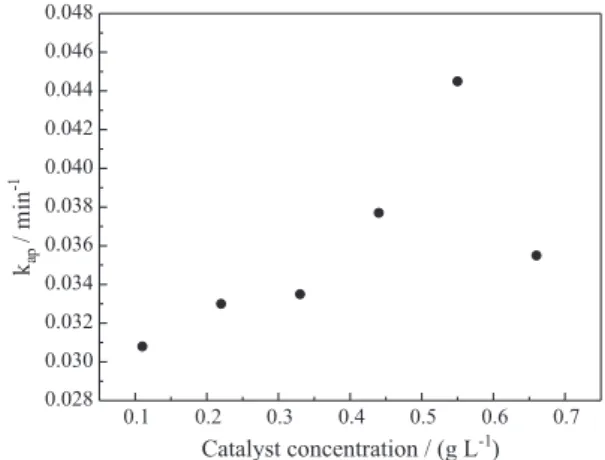
Effect of catalyst concentration
The effect of the catalyst concentration in the mixture is shown in Figure 5, which presents the values of the pseudo-irst-order apparent kinetic constant for several initial catalyst concentrations. The reaction kinetic constant increases as the catalyst concentration is incremented from 0.11 to 0.55 g L-1. Above 0.55 g L-1, the value decreases. It
should be emphasized that these results are dependent on the experimental apparatus used in this work.
Similar behavior was observed by several authors for different pollutants.15,23-25 With the increased amount of
catalyst, the number of photons absorbed and the number of molecules adsorbed also increased, due to an increase in the number of TiO2 particles. The density of particles in
the area of illumination also increased, and the degradation rate therefore increased. However, a further increase in catalyst concentration implies that some photocatalyst particles may not receive enough energy to start styrene Figure 4. The effect of initial styrene concentration on the photodegradation
rate (T = 30 °C, pH 6.0 and Ccat = 0.55 g L-1). Figure 5. Variation of the apparent kinetics constant with the catalyst
oxidation. Gogate and Pandit 26 attributed this behavior to
the increase in opacity, which leads to a decrease in the passage of radiation through the reactor.
During catalysis, large amounts of particle aggregation may also occur, thus reducing the interfacial area between the substratum and catalyst. This decrease in area causes a decrease in the number of surface active sites and consequently decreases the photodegradation eficiency.20,27
It should be noted that the number of photons that reaches the reactor surface is constant and that their number is in great excess compared to that necessary for the reaction.
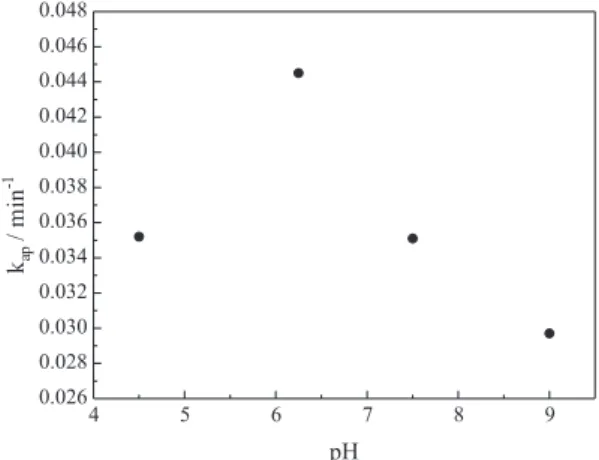
Effect of initial pH
The eficiency of photocatalytic degradation is affected by the TiO2 surface properties, the molecules charge and
the hydroxyl radical concentration. These properties depend on the pH.
The effect of pH on styrene photocatalytic degradation was evaluated in this study. Figure 6 shows the apparent pseudo-irst order kinetic constant values for several initial pH conditions.
Electrostatic attraction or repulsion between the catalyst’s surface and the organic molecule depends on the ionic form of the organic compound (anionic or cationic) and the surface charge.21 The electric charge of a solid
surface in an aqueous solution is determined by the zero point charge (ZPC). At pH values lower than ZPC, the catalyst’s surface is positively charged, and at higher pH values it is negatively charged. The ZPC of the TiO2 catalyst
(degussa P25) is pH 6.8.28-30
Figure 6 shows that the reaction presented a maximum degradation rate at pH 6.0 (the natural pH). At pH 6.0, the TiO2 surface was weakly charged (near ZPC), a situation in
which molecules probably reach the catalyst surface more
easily. This phenomenon facilitates the adsorption of the pollutant and consequently permits the degradation rate to reach its maximum value.21,31
At acid pH (4.0), the adsorption was relatively low. This effect is due to (i) TiO2 particle agglomeration that
reduces styrene adsorption and photon absorption at low pH values, and (ii) the TiO2 surface is positively charged
(TiOH2
+) at low pH. When the pH is adjusted with HCl,
as in this study, the Cl−anions are also adsorbed, and there
is competition between anion adsorption and styrene molecule adsorption. However, it was necessary to add only 0.18 mL of HCl (0.1 mol L-1) to reach the pH 4. This
corresponds at 0.8 mg L-1 of chloride, insigniicant amount
when compared with the styrene amount present in the solution (25 mg L-1). Thus the reduction of catalyst activity
at pH 4 is not due to competition. Agglomeration and sedimentation of the TiO2 particles were observed29 when
2000 mg L-1 of TiO
2 was used. In this work, the maximum
catalyst concentration used was 650 mg L-1.
On the other hand, at basic pH, the TiO2 surface is
negatively charged (TiO−), and the Na+ ions adsorption
competes with organic molecule adsorption. Moreover, in the alkaline solution there is repulsion between the negatively charged surface of photocatalyst and the hydroxide anions. This repulsion could prevent the formation of HO• and thus
decrease the rate of photooxidation.29
Effect of H2O2 addition
The major energy-wasting step in the photocatalytic reaction is electron-hole recombination. The prevention of this recombination is achieved by adding a proper electron donor or an acceptor to the system. Usually, molecular oxygen and hydrogen peroxide are used as electrons acceptors in heterogeneous photocatalyzed reactions.
In order to investigate the effect of H2O2 addition on
styrene photodegradation, experiments utilizing several H2O2 concentrations (1.93; 3.86; 5.79; 7.72; 9.65 mmol L
-1)
were conducted. The results are presented in Figure 7. The degradation rate had a maximum at the optimum peroxide concentration of 5.8 mmol L-1.
The addition of hydrogen peroxide increases the formation of hydroxyl radical via a mechanism proposed by Ollis,32 where H
2O 2 is considered a better electron acceptor
than oxygen, as shown in equation 2.
TiO2(e–) + H2O2→ TiO2 + OH– + HO• (2)
Therefore, the photocatalytic degradation rate is expected to increase with the elevated amount of H2O2 in the
system. However, H2O2 greatly decreased the degradation
Figure 6. Effect of initial pH on the styrene degradation rate constant (C0 = 25 mg L-1, C
rate. This negative effect of a high H2O2 concentration
may be due to the formation of HO•
2, a species that is
signiicantly less reactive than HO•.33 The excess H 2O2
molecules on the catalyst surface may also act as powerful scavengers of radicals,21,34 as shown in equations 3 and 4.
Competition for adsorption by the styrene and hydrogen peroxide still occurs.35,36
H2O2 + HO •→ H
2O + HO
•
2 (3)
HO• 2 + HO
•→ H
2O + O2 (4)
Detection of intermediates, carbon and oxygen balance
The chromatographic analysis of the samples collected during the photocatalytic degradation of styrene revealed benzaldehyde as one of the intermediates.
Styrene clearly offers two main possibilities for hydroxyl radical attack: the ring or the double bond in the side chain. The reactions involve eletrophilic substitution in the aromatic ring or free-radical substitution in the side
chain.37 Benzaldehyde formation at relatively great amounts
is evidence for the preferential attack by radical •OH on the
styrene side chain.
Experiments were carried out in order to simultaneously analyze the styrene concentration, the benzaldehyde concentration and the total organic carbon (TOC). The results, which are presented in Figure 8, were used to
perform a mass balance. Using this mass balance, the CO2
formed during the reaction was calculated, and the results are summarized in Table 2.
Column V in Table 2 presents the carbon balance {TOC(t) – [C(t) in styrene + C(t) in benzaldehyde]}. Its non-null results
reveal the formation of unidentiied molecules, which are present in signiicant amount after 90 min of reaction time. One may infer that these molecules are products of benzaldehyde photodegradation, because they only appeared when a signiicant amount of benzaldehyde was present. The identiication of intermediates is beyond the scope of this work. Column VII presents the values for [TOC(t = 0) – TOC(t)], which indicates the amount of CO2
formed.
Table 2. Carbon mass balance results
I II III IV V VI VII
time / min
Carbon in styrene /
(mol L-1)
Carbon in benzaldehyde /
(mol L-1)
TOC / (mol L-1)
Carbon in molecules not identiied /
(mol L-1)
Carbon in molecules not identiied /
(%)
CO2
concentration / (mol L-1)
0 15 30 60 90 150 210 300
2.53 × 10⁻³
1.84 × 10⁻³
1.30 × 10⁻³
9.38 × 10⁻⁴
6.99 × 10⁻⁴
5.03 × 10⁻⁴
2.32 × 10⁻⁴
7.21 × 10⁻⁵
0
2.03 × 10⁻⁴
3.64 × 10⁻⁴
4.71 × 10⁻⁴
5.14 × 10⁻⁴
5.95 × 10⁻⁴
5.24 × 10⁻⁴
3.86 × 10⁻⁴
2.53 × 10⁻³
2.03 × 10⁻³
1.61 × 10⁻³
1.40 × 10⁻³
1.29 × 10⁻³
1.21 × 10⁻³
1.10 × 10⁻³
9.08 × 10⁻⁴
ca. 0
ca. 0
ca. 0
ca. 0 8.20 × 10⁻⁵
1.11 × 10⁻⁴
3.42 × 10⁻⁴
4.50 × 10⁻⁴
ca. 0
ca. 0
ca. 0
ca. 0 6.3
9.2
31.2
49.5
0
5.02 × 10⁻⁴
9.21 × 10⁻⁴
1.13 × 10⁻³
1.23 × 10⁻³
1.32 × 10⁻³
1.43 × 10⁻³
1.62 × 10⁻³ Figure 7. Effect of H2O2 on the styrene degradation rate (Ccat = 0.55 g L-1,
C0 = 25 mg L-1, T = 30 °C and pH 6.0).
Figure 8. Total organic carbon and benzaldehyde formation during the photocatalytic degradation of styrene (C0 = 32.9 mg L-1, T = 30 ºC, pH 6.25,
Conclusions
The photocatalytic degradation of styrene in an aqueous solution was studied in a bath slurry reactor irradiated with a UV light source and using a titanium dioxide as a catalyst.
Under these study conditions, styrene degradation is a photocatalytic process because styrene concentration reduction was not observed in the absence of either the catalyst or radiation. The adsorption equilibrium was reached within 40 min for three tested pH values (4.0, 6.25, and 9.0). In addition, the amount of adsorbed styrene depended on the solution pH. In this case, the adsorption maximum occurred at pH 6.25.
The styrene degradation kinetics can be approximated by a pseudo-irst order model with a reaction rate dependent on the initial concentration of styrene, the TiO2 concentration,
the pH and the H2O2 concentration. The degradation rate
decreased with increasing initial concentrations of styrene, and it increased with increasing catalyst concentrations up to a maximum of 0.55 g L-1. Additionally, the degradation
rate was maximal when the pH was approximately 6.25 and the H2O2 concentration was 5.8 mmol L-1.
According to the Langmuir-Hinshelwood kinetic model, the kinetic constant (k) and adsorption constant (K) are 1.46 × 10⁻⁵ mol L-1 min-1 and 2.92 × 10³ L mol-1, respectively.
The CG-MS results revealed benzaldehyde formation during styrene photocatalytic degradation, and the carbon balance indicated that at least one or more unknown organic molecule is formed and can be detected after 90 min of reaction time.
Acknowledgments
The authors are grateful to Degussa for supplying the TiO2 catalyst, Petrochemical Innova for supplying styrene
and CAPES for inancial support.
References
1. Gibbs, B. F.; Mulligan, C. N.; Ecotoxicol. Environ. Saf. 1997,
38,181.
2. Kricheyskaya, M.; Preis, S.; J. Adv. Oxid. Technol. 2003, 6, 150. 3. Johnson, J. T.; Dziedzic, D.; Gross, K. B.; US Patent
US7547418, 2009.
4. Lim, M; Zhou, Y; Wood, B; Guo, Y. N.; Wang, L. Z.; Rudolph, V; J. Phys. Chem. C 2008, 112, 19655.
5. National Toxicology Program U.S. Department of Health and Human Services; NTP-CERHR Expert Panel Report on the Reproductive and Developmental Toxicity of Styrene; June 2005; http://cerhr.niehs.nih.gov.
6. Soares, E. D.; Lansarin, M. A.; Moro, C. C.; Braz. J. Chem. Eng.2007, 24, 29.
7. Garcia, J. C.; Simionato, J. I.; Almeida, V. C.; Palácio, S. M.; Rossi, F. L.; Schneider, M. V.; Souza, N. E.; J. Braz. Chem. Soc.
2009, 20, 1589.
8. Prestes, T. H.; Gibbon, D. O.; Moro, C. C.; Lansarin, M. A.;
Quim. Nova 2010, 33, 798.
9. Lhome, L.; Brosillon, S; Wolbert, D.; J. Photochem. Photobiol., A
2007, 188, 34.
10. Elmolla, E. S.; Chaudhuri, M.; Desalination2010, 252, 46. 11. Mouamfon, M. V. N.; Li, W. Z.; Lu, S. G.; Qiu, Z. F.; Chen, N.;
Lin, K. F.; Environ. Technol. 2010, 31, 489.
12. Guzsvány, V. J.; Csanádi, J. J.; Lazic, S. D.; Gaál, F. F.; J. Braz. Chem. Soc. 2009, 20, 152.
13. Jo, W. K.; Yang, S. H.; Shin, S. H.; Yang, S. B.; Environ. Eng. Sci. 2011, 28, 43.
14. Zhao, J.; Wu, T.; Wu, K.; Oikawa, K.; Hidaka, H.; Serpone, N.;
Environ. Sci. Technol.1998,32, 2394.
15. Dijkstra, M. F. J.; Buwalda, H.; Jong, A. W. F.; Michorius, A.; Winkelman, J. G. M.; Beenackers, A. A. C. M.; Chem. Eng. Sci. 2001, 56, 547.
16. Peiró, A. M.; Ayllón, J. A.; Peral, J.; Doménech, X.; Appl. Catal., B 2001, 30, 359.
17. Gautam, S.; Kamble, S. P.; Sawant, S. B.; Pangarkar, V. G.;
Chem. Eng. J. 2005, 110, 129.
18. Ishiki, R. R.; Ishiki, H. M.; Takashima, K.; Chemosphere 2005,
58, 1461.
19. Vidal, A.; Herrero, J.; Romero, M.; Sanchez, B.; Sanchez, M.;
J. Photochem. Photobiol., A 1994, 79, 213. 20. Chen, D.; Ray, A. K.; Water Res.1998, 32, 3223.
21. Evgenidou, E.; Fytianos, K.; Poulios, I.; J. Photochem. Photobiol., A 2005, 175, 29.
22. Herrmann, J. M.; Top. Catal. 2005, 34, 49.
23. Barakat, M. A.; Tseng, J. M.; Huang, C. P.; Appl. Catal., B
2005, 59, 99.
24. Gogate, P. R.; Mujumdar, S.; Pandit, A. B.; Ind. Eng. Chem. Res. 2002, 41, 3370.
25. Andreozzi, R.; Caprio, V.; Insola, A.; J. Chem. Technol. Biotechnol. 2000, 75, 131.
26. Gogate, P. R.; Pandit, A. B.; Adv. Environ. Res. 2004, 8, 501. 27. Muruganandham, M.; Swaminathan, M.; Dyes Pigments2006,
68, 133.
28. Zhang, F.; Zhao, J.; Shen, T.; Hidaka, H.; Pelizzetti, E.; Serpone, N; Appl. Catal., B 1998, 15, 147.
29. Konstantinou, I. K.; Albanis, T. A.; Appl. Catal., B 2004, 49, 1. 30. Guillard, C.; Lachheb, H.; Houas, A.; Ksibi, M.; Elaloui, E.; Herrmann, J. M.; J. Photochem. Photobiol., A 2003, 158, 27. 31. Subramanian, V.; Pangarkar, V. G.; Beenackers, A. A. C. M.;
Clean Prod. Process. 2000, 2, 149.
32. Ollis, D. F.; Serpone, N.; Pelizzetti, E.; Environ. Sci. Technol.
33. Senthilkumaar, S.; Porkodi, K.; J. Colloid Interface Sci. 2005,
288, 184.
34. Galindo, C.; Jacques, P.; Kalt, A.; Chemosphere 2001, 45, 997. 35. Hachem, C.; Bocquillon, F.; Zahraa, O.; Bouchy, M.; Dyes
Pigm. 2001, 49, 117.
36. Malato, S.; Blanco, J.; Richter, C.; Braun, B.; Maldonado, M. I.; Appl. Catal., B 1998, 17, 347.
37. Morrison, R. T.; Boyd, R. N.; Organic Chemistry, 4th ed.; Allyn and Bacon: Boston, MA, 1983.