Normal-State Properties of Uniaxially
Pressed Bi
1.65
Pb
0.35
Sr
2
Ca
2
Cu
3
O
10
+
δ
Ceramics
E. Govea-Alcaide,
Instituto de F´ısica, Universidade de S˜ao Paulo, CP 66318, 05315-970, S˜ao Paulo, SP, Brazil and
Departamento de F´ısica, Universidad de Oriente, Patricio Lummumba s/n, P. O. Box 90500, Santiago de Cuba, Cuba
P. Mun´e,
Departamento de F´ısica, Universidad de Oriente, Patricio Lummumba s/n, P. O. Box. 90500, Santiago de Cuba, Cuba
and R. F. Jardim
Instituto de F´ısica, Universidade de S˜ao Paulo, CP 66318, 05315-970, S˜ao Paulo, SP, Brazil
Received on 15 July, 2005
We have studied the effects of the uniaxial compacting pressure on the physical properties of polycrystalline Bi1.65Pb0.35Sr2Ca2Cu3O10+δ(Bi-2223) superconductors. Powders of this material were pressed at different
uniaxial compacting pressures ranging from ∼90 to∼600 MPa and heat-treated at the same temperature. A characterization of samples by using Scanning Electron Microscopy and X-ray diffractometry indicated an appreciable improvement of the degree of texture with increasing pressure. The temperature dependence of the electrical resistivityρ(T) exhibits aT-linear behavior at temperatures higher thanT∗∼235 K. The deviation
of ρ(T) from the linear behavior belowT∗ indicates the opening of the pseudogap, a feature confirmed by magnetic susceptibility measurements performed in powder samples. From linear fittings of the normal-state electrical resistivity we were able to separate contributions toρ(T) arising from both the grain misalignment and microstructural defects. The results suggest that the grain orientation and the connectivity between them are improved with increasing compacting pressure. Also, based on the linearity of the electrical resistivity data both the transport electron-phonon coupling constant,λtr, and the mean free path,l, were estimated. We have found that in the sample with the highest degree of textureλtr ∼0.53, a value comparable with the one obtained in Bi-2223 single crystals. However, the result forl∼12.7 ˚A at 300 K, in the same ceramic sample, is close to 3 times lower than the single crystal value. The influence of the intergranular electrical resistivity in determining band-theory parameters was analyzed within the framework of a current conduction model for granular superconducting materials.
I. INTRODUCTION
The presence of grain boundaries in various forms of poly-crystalline superconducting samples (bulk sintered material, thick films, tapes, and wires) is a natural consequence of the preparation conditions from powdered precursors. Grain boundaries play an important role in limiting the general trans-port properties of polycrystalline superconductors. More-over, it is well established that the properties of grain bound-aries mainly control the macroscopic properties of all high-Tc
materials.[1] This phenomenon is mainly attributed to the mis-orientation between the grains usually referred to as the meso-texture.[2] High angle grain boundaries can act as Josephson coupled weak links, leading to a significant field-dependent suppression of the supercurrent across the grain boundary.[1] In order to improve the transport properties of these materials they are subjected to large mechanical deformations. These techniques have proven to be effective in raising the super-conducting critical currentJcof the superconducting tapes,[3–
5] mainly due to a marked increase in both themeso-texture and the micro-texture, where the latter is related to the ori-entation of the individual grains regarding the direction in along the mechanical deformation is applied. The combina-tion of the above types of texture gives themacro-textureof the material.[2]
In a previous work, we have described a systematic study concerning the influence of uniaxial compacting pressure on
the general superconducting properties of polycrystalline (Bi-Pb)2Sr2Ca2Cu3O10+δ (Bi-2223) samples.[6] By performing
measurements of critical current density as a function of ap-plied magnetic field,Jc(Ba), we have observed three different
superconducting levels: the superconducting grains, the su-perconducting clusters, and the weak links. It was found that properties of the last two levels are very sensitive to the com-pacting pressure, mostly due to changes in the grain boundary properties. However, a similar systematic study regarding ef-fects of the uniaxial compacting pressure on the normal-state transport properties of the above ceramic material is lacking.
The normal state properties of high-Tc superconductors,
such as the temperature dependence of the electrical resis-tivity, ρ(T), have been an attractive topic for investigations in the last years. This occurs because it is possible to ob-tain some important parameters such as the electron-phonon coupling constant,λtr, and the mean free path,l, by correlat-ing transport measurements with band-theory arguments.[7] In granular superconducting materials, studies involving the behavior ofρ(T) present an additional inconvenient due to the complexity of their microstructure in which both intragranular and intergranular contributions as well as the degree of texture and structural defects must be considered.[13] Consequently, estimates of band-theory parameters such asλtr andl from
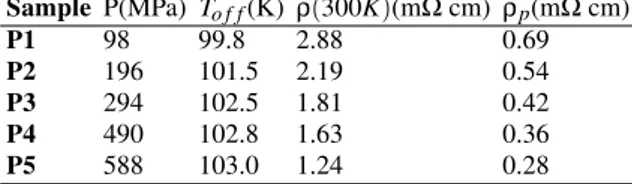
TABLE I: Few parameters of the uniaxially compacting pressed sam-ples studied in this work: the compacting pressure,P, the offset su-perconducting critical temperature,To f f, the electrical resistivity at 300 K,ρ(300 K), and the paracoherent electrical resistivity,ρp.
SampleP(MPa) To f f(K) ρ(300K)(mΩcm) ρp(mΩcm)
P1 98 99.8 2.88 0.69
P2 196 101.5 2.19 0.54
P3 294 102.5 1.81 0.42
P4 490 102.8 1.63 0.36
P5 588 103.0 1.24 0.28
to as in-plane electrical resistivity ρab. Within this context, Gurvitchet al.[7] have corrected the electrical resistivity data of both La2−xSrxCuO4 and YBa2Cu3O7−δ ceramic samples
by using a constant factor of∼2 and comparing the results with data obtained in high-quality ceramics and epitaxial thin films.
In addition, electrical resistivity measurements in the normal-state of cuprates have revealed the presence of elec-tronic correlations at high temperatures, referred to as the pseudogap. Such a pseudogap, which manifests itself as a depletion of the quasiparticle density of states (DOS) below a characteristic temperatureT∗,[8] would reflect the creation
of a precursor state of the Cooper pairing [9] that acquires long-range coherence order below the superconducting criti-cal temperature,Tc. The pseudogap temperature,T∗, can be
estimated by using different techniques such as the tempera-ture dependence of the electrical resistivity, ρ(T), and mag-netic susceptibility, χ(T).[8, 10] In fact, T∗can be inferred from deviations in bothρ(T) andχ(T) data from the expected behavior at temperatures well above Tc.[8] In addition, it is
well known that the magnetic susceptibility behavior is related to the Pauli paramagnetic susceptibility of the Cu2+ spins, which in turn is related to the density of state at the Fermi level.[11, 12]
In this work we focus on theρ(T) measurements of poly-crystalline Bi1.65Pb0.35Sr2Ca2Cu3O10+δsamples subjected to
different uniaxial compacting pressures before the last heat treatment. X-ray diffraction patterns, XRD, taken on powder and bulk samples, micrographies by Scanning Electron Mi-croscope, SEM, taken on free surface and fracture, and mea-surements of magnetization versus temperature,M(T), have been performed as complementary characterizations. The main contribution of this paper is to quantify the effects of uniaxial compacting pressure on theρ(T) dependence mainly in the normal-state region. By using the model proposed by Gurvitch et al.[7] some relevant parameters were extracted such as the electron-phonon coupling constant and the mean free path. The resulting values have been also analyzed within the framework of the current conduction model proposed by D´ıazet al..[13]
II. EXPERIMENTAL PROCEDURE
Polycrystalline samples of the superconductor Bi1.65Pb0.35Sr2Ca2Cu3O10+δ (Bi-2223) were prepared
from powders of Bi2O3, PbO, SrCO3, CaCO3, and CuO, which were mixed in an atomic ratio of Pb:Bi:Sr:Ca:Cu (0.35:1.65:2:2:3). Details of the sample preparation process are described elsewhere.[6] Here, before the last heat treatment, the powders were uniaxially pressed at different compacting pressures ranging from∼90 to∼600 MPa (see Table I), and the typical dimensions of the pellets wered = 10 mm in diameter andh = 1 mm in height. The last heat treatment of the pellets was performed in air at 845◦C for 40
h followed by slow cooling.
We have evaluated the phase identification in both powder and bulk samples by means of X-ray diffraction patterns ob-tained in a Bruker-AXS D8 Advance diffractometer. Also, a qualitative evaluation of the degree of texture in pellet samples was made by using the same technique. These measurements were performed at room temperature using Cu Kαradiation in the 3◦≤2θ≤80◦range with a 0.02◦(2θ) step size and 5 s
counting time.
The microstructure of fractured and free surfaces of sam-ples was observed by using a JEOL JSM-5800 Scanning Elec-tron Microscope operating at 25 kV. In the first type of mea-surement we have observed the shape of the grains, their de-gree of orientation, and estimated the their mean size. From the second one, we qualitatively evaluated the porosity of sam-ples subjected to different compacting pressures.
We have performed dc magnetization measurementsM(T) in powders extracted from each pellet and with identical mass, by using a commercial Quantum Design SQUID magnetome-ter. The powders were cooled in zero applied magnetic field from room temperature down to 10 K. After this step, zero-field cooled (ZFC) and zero-field-cooled (FC) measurements were performed under applied magnetic fields and up to 300 K.
The temperature dependence of the electrical resistivity,
ρ(T), was measured by using the standard dc four-probe tech-nique in slabs with typical dimensions oft= 0.5 mm (thick-ness),w= 2 mm (width), andl= 10 mm (length). These mea-surements were performed by applying the excitation current along the plane of the sample perpendicular to the direction in which the uniaxial compacting pressure has been applied. After cooling the sample in zero applied magnetic field down to 77 K, an excitation current of 1 mA was applied. The speci-men was then warmed slowly from 77 K to room temperature and both the voltage across the sample and the temperature were collected.
Current-voltage (I-V) measurements were performed to determine the paracoherent electrical resistivity, ρp, of the samples.[13] We have used the so-called quasi-dc four-probe technique in these experiments, as described in Ref. 14. Once the sample was cooled down and fixed at a given temperature close to 103 K, an excitation current,Iex, was applied during 1
sec and the voltage across the sample,V, was measured. After this step,Iexwas turned off during∼10 sec, avoiding possible
accom-20 25 30 35 40
204
11
13
00
16
206
11
11
00
14
200
119
00
12
019
115
00
10
113
2
θ
(deg)
In
te
n
sit
y
(A
rb
.
U
n
it
s)
(a)
(c)
(b)
(d)
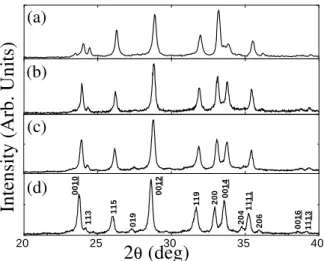
FIG. 1: X-ray diffraction patterns of a powder sample (a), and bulk samples subjected to different compacting pressures: P2(b),P3(c), and P5(d). The reflections belonging to the Bi-2223 phase are marked by Miller indexes in (d).
panied by a continuous increase of the excitation current re-sulted in severalI−V curves at different temperatures. From the results,ρvs.Jcurves are built andρpis extracted from the apparent observed plateau in theρvs. Jdependence.[13] By using this procedure, the electrical resistivity of the sampleρ and the transport current density flowing through the material J=Iex/(wt)are determined.
III. EXPERIMENTAL RESULTS
Figure 1 displays the X-ray diffraction patterns taken on bulk samplesP2,P3, andP5, and in a powder samplePO. This powder was prepared from the sampleP2, that was re-ground after the last heat treatment. A comparative analysis of these patterns reveals that all samples have similar chemical composition and that all the indexed reflections are related to the high-TcBi-2223 phase. The unit-cell parameters were
cal-culated regarding an orthorhombic unit cell and the obtained valuesa = 5.410 ˚A,b = 5.413 ˚A, and c= 37.152 ˚A are in excellent agreement with those reported for the same com-pound elsewhere.[15] The values ofa,b, andcwere found to be essentially the same for the samples subjected to different compacting pressures. A careful inspection of these X-ray di-agrams also reveal clear effects related to the increase of the compacting pressure. A typical example is associated with changes observed, for instance, in the evolution of the (200) and (0014) peaks. The data indicate a monotonic increase of the relative intensity of the (0014) peak with increasing com-pacting pressure. This strong suggest that the grains belong-ing to samples subjected to higher compactbelong-ing pressures are more aligned along thec-axis, a feature that is corroborated by the continuous decrease of the relative intensity related to the reflection (200).
In order to quantify these features, we have also computed the relative intensity of both (0010) and (200) Bragg peaks
re-100 200 300 400 500 600 0.5
0.6 0.7 0.8 0.9
200
0010
I
h
kl
/
I
PO00
12
P (MPa)
FIG. 2: Relative intensity dependence of the Bragg reflections (0010) and (200) with increasing compacting pressure. Lines between points are guides for eyes.
garding the intensity of the reflection (0012) belonging to the powder samplePO. The compacting pressure dependence of both reflections are displayed in Fig. 2. The data indicate that the relative height of the peak (0010) increases monotonically with increasing compacting pressure suggesting that higher compacting pressures improved the degree of texture and re-sults in a better alignment of the grains. In addition, it seems that grains are aligned with theirc-axis preferentially parallel to the compacting direction. Indeed, such a feature is con-sistent with the progressive decrease of the relative intensity related to the peak (200), as inferred from the data shown in Fig. 2.
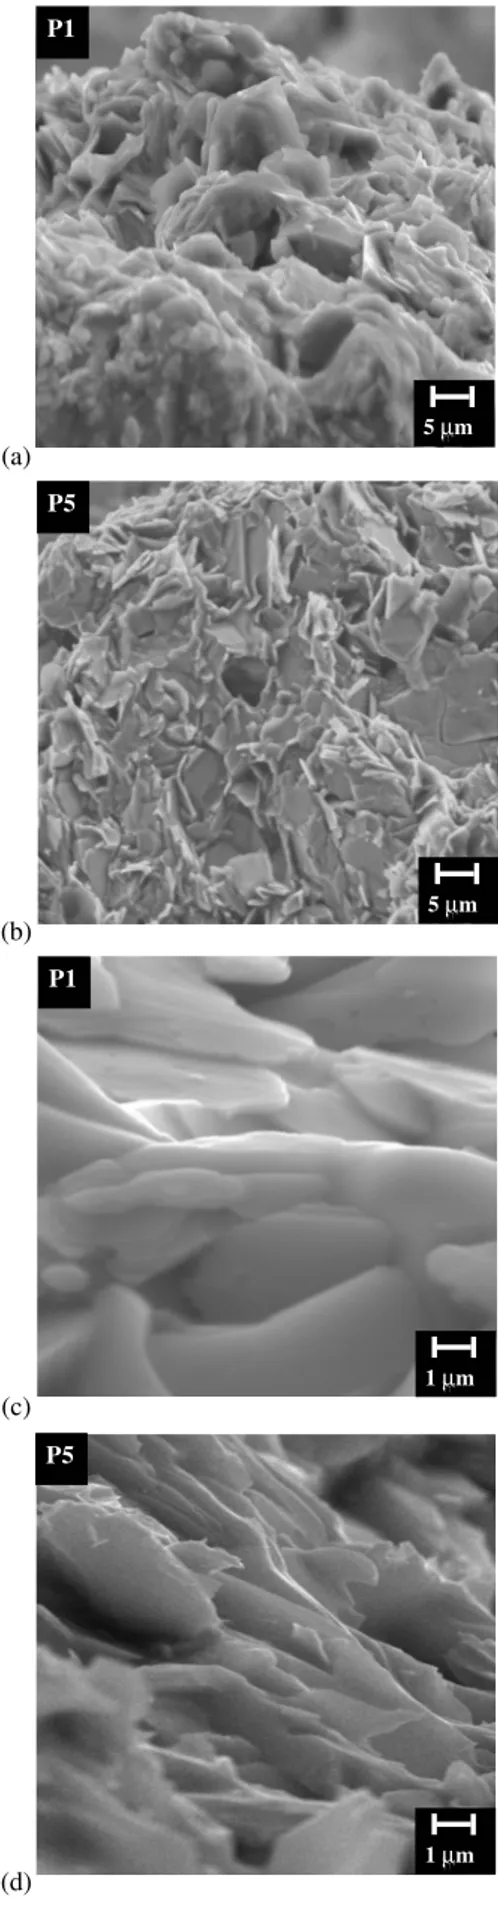
The effect of the compacting pressure has its counterpart in the microstructure of these samples. This can be inferred from the free surface and the fracture micrographs of sam-plesP1andP5which are shown in Fig.3. In both types of micrographs it is possible to observed that the granular mor-phology of both samples is similar, exhibiting the occurrence of grains with nearly platelet-like shape. Also, a careful in-spection of the free surface micrographies of samplesP1and P5(see Figs. III) and III) reveals that the later is more ho-mogeneous, mostly due to a marked reduction in the porosity level with increasing compacting pressure.
The analysis of fracture micrographies in these samples also indicates changes in both the grain size and the grain ori-entation. The average grain size in the sampleP1was found to beLa= 6 µm long and as thick as Lc = 0.3µm. For the
sampleP5, the grains were found to have dimensions ofLa=
4µm long andLc= 0.1µm thick. The ratioLa/Lc, which is
referred to as the mean aspect ratio of the grains,[13] has been found to be very sensitive to the applied pressure and were∼
20 and∼40 for the samplesP1andP5, respectively. These values are higher than those of 2.5 and 4.5 in ceramic samples of YBa2Cu3O7−δ,[13] but similar to the one of∼50 estimated
in (Bi,Pb)-2223 superconducting tapes.[2]
(a) P1
5 µµm
(b) P5
5 µµm
(c) P1
1 µµm
(d) P5
1 µµm
FIG. 3: Micrographs of the free surfaces (III and III), and fractured samples (III and III)P1andP5, respectively, which were subjected to different uniaxial compacting pressures, as displayed in Table I.
thicker than those, for instance, of the sampleP5, which are thinner and aligned parallel to each other. The above results are in excellent agreement with the XRD analysis discussed above, which indicated a continuous increase of the degree of texture with increasing compacting pressure.
FIG. 4: Temperature dependence of the electrical resistivity of the samplesP1, P2, P3,P4, and P5. The results show a progressive decrease ofρ(T) with increasing compacting pressure. Some phys-ical parameters of the samples extracted from theseρ(T) curves are displayed in Table I and discussed in the text.
It is reasonable to point out that the morphological alter-ations provoked by increasing the compacting pressure must be reflected in some macroscopic properties of these ceramic samples as the temperature dependence of the electrical resis-tivity. Following this statement, the temperature dependence of the electrical resistivityρ(T) of samples P1, P2, P3,P4, andP5are displayed in Fig. 3. All curves exhibit a transition to the superconducting state bellow the onset superconducting critical temperatureTon∼110 K. Such a critical temperature
is identified as the transition of isolated grains to the supercon-ducting state in granular superconductors. The observation of an almost constant value ofTon ∼110 K in all samples
sug-gests that the superconducting grains seem to be insensitive to the increasing of the compacting pressure, at least in the pres-sure range used in these experiments. In addition, a nearly constant value ofTon ∼110 K, combined with the XRD
re-sults which exhibited absence of Bragg peaks belonging to extra phases, indicates that the grains of all samples have es-sentially the same stoichiometry.
We have also found that the temperature in which the zero resistance state is attained, To f f, slightly increases with
in-creasing compacting pressure (see Table I). Since To f f is
exhibit a clear metallic-like behavior in the normal-state re-gion. Such a result, along with the progressive decrease of the magnitude of ρ(T) at 300 K (see Table I), suggests that the electrical current flows preferentially along theab-plane of the partially oriented grains in these samples.
Theρ(T) data were found to obey a linear trend in a well defined temperature range. Thus, a relevant question con-cerns the procedure to determine the temperature in which
ρ(T) curves start to deviate from linearity. Usually, this tem-perature is determined by visual localization. However, such a procedure is too subjective to be quantitative, as discussed by Tallon et al..[8] In order to evaluate the deviation from linearity of our ρ(T) data, we have computed several slopes
∆ρ(T)/∆Tfollowing the relation
m(T) =ρ(300K)−ρ(T)
300K−T , (1)
whereρ(300 K) is the electrical resistivity at 300 K (see Table I). The temperatureT was increased from 160 K to 260 K, in step sizes of∼5 K. A linear dependence ofρ(T) data implies, according to Eq. (1), a temperature-independent behavior of them(T) dependence.
160 180 200 220 240 260 1.00
1.05 1.10 1.15
T ~ 235 K P1 P3 P5
m
(
T
)
/
m
(260
K
)
T(K)
FIG. 5: Normalized values ofm(T), calculated by using the Eq. 1 from 160 to 260 K, as a function of temperature. A constant value of ofm(T) is observed for temperatures higher than 235 K, as discussed in the text.
The temperature dependence of the normalized m(T) curves of the samplesP1,P3, andP5are displayed in Figure 5. Them(T) curves exhibit a temperature independent behav-ior from room temperature down toT∗
ρ ≈235 K. BelowT∗ ρ,
them(T) curves of samplesP1,P3, andP5display a similar behavior and start to deviate each other at a lower tempera-ture T ≈210 K. Thus, a temperature-independent behavior in them(T) dependence indicates that allρ(T) curves have a T-linear behavior in a narrow temperature range, or more ap-propriately, fromTρ∗≈235 K to 300 K. The data shown in Fig. 4 also indicate thatT∗
ρ seems to be insensitive to changes
in the compacting pressure.
As already mentioned, it is well accepted that such a T -linear deviation inρ(T) curves at higher temperatures
consti-180 200 220 240 260 280 300 0.00
0.05 0.10 0.15 0.20
P1 P2 P3 P5
χ
-1
(10
7
g
O
e/
em
u
)
T (K)
T = 235 K
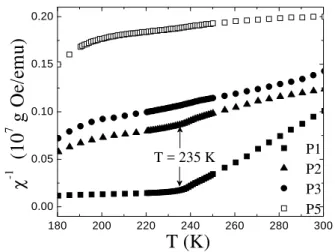
FIG. 6: Temperature dependence of the inverse magnetic suscepti-bilityχ−1(T) measured in samplesP1,P2,P3, andP5.
tutes an evidence of the pseudogap opening. Also, it has been pointed out that this deviation may be reflected in the den-sity of the states at the Fermi surface due to the Cooper pair formation without long-range phase coherence.[9] In order to verify the above statement, magnetic susceptibility measure-ments were performed in powder samples. Figure 6 displays the temperature dependence of the inverse magnetic suscep-tibility,χ−1(T), of samplesP1,P2,P3, andP5. The curves show a clear deviation from linearity of the Curie-type mag-netic susceptibility behavior atT∗
χ ≈235 K, a feature which is much more pronounced in samples subjected to low compact-ing pressures asP1andP2.
With the aim to discuss the differences between theχ−1(T) curves of our batch of samples, simple and qualitative argu-ments can be used. A continuous decrease in temperature would result in two opposite effects on the magnetic suscep-tibility of the paramagnetic state: (1) a better alignment of the magnetic dipoles along the direction of the applied mag-netic field due to the decrease of the thermal energy (Curie law), and (2) a decrease in the number of magnetic dipoles at temperatures belowT∗because part of them participate in
the creation of Cooper pairs, which have dipole momentum equal to zero. Within this scenario, the creation of Cooper pairs results in a decrease of the density of states and, con-sequently, a decrease in the Pauli paramagnetic susceptibility term. On the other hand, the intensity with both effects are reflected inχ−1(T) curves depends on the demagnetizing fac-tors of the grains in the powder samples. As shown in figures III and III, the granular morphology of these samples has been altered with increasing compacting pressure: it evolves from grains with nearly ellipsoidal shape (see sampleP1) to grains with a platelet-like shape (see sampleP5). In fact, the aver-age value of the grain thickness,Lc, for the sampleP1is close
measured values of the magnetic susceptibility. Thus, the de-viation from the Curie law belowT∗
χ ≈235 K is expected to be much less pronounced in samples subjected to higher com-pacting pressures, as observed in our experiments. Our value of T∗
χ ≈235 K agrees well with the pseudogap temperature reported by both Fujiiet al. [10] and Yamadaet al. [16] in Bi2Sr2Ca2Cu3O10+δ single crystals, as well as by Ekino et
al. [17] in (Bi-Pb)2Sr2Ca2Cu3O10+δ ceramic samples. Thus,
our combined results of transport and magnetic measurements suggest that changes in T =T∗
ρ ≈Tχ∗≈235 K are related to
the opening of the pseudogap at this temperature.
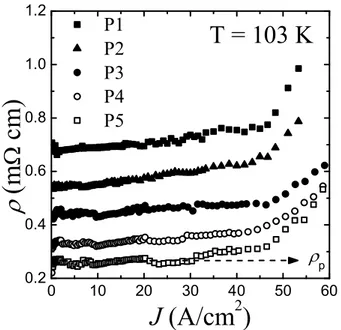
FIG. 7: ρvs. Jcurves for all samples studied in this work. The paracoherent electrical resistivityρp has been determined from the apparent linear plateau of theρ(J)curves, as indicated by the dashed line of the curve belonging to the sampleP5.
Another important information regarding the effects of compacting pressure on the intergranular features of samples can be extracted from the paracoherent electrical resistivity,
ρp. As reported by D´ıaz et al.,[13] effects arising from the misalignment of grains in transport data can be disregarded in the paracoherent state because the grains are in the supercon-ducting state while the intergranular junctions remain in the normal state. In order to determine the paracoherent electrical resistivity of our samples,ρvs. Jcurves were measured and the results are shown in Figure 7. Values ofρpwere extracted by extrapolating the apparent observed plateau in theρvs. J behavior[13] and are shown in Table I. Even when the values ofρwere very scattered we were able to verify the existence of an almost constant value ofρfor J ≤45 A/cm2. In ad-dition, the data indicate a progressive decrease inρpwith in-creasing compacting pressure, as confirmed by the estimated values ofρp1= 0.69 mΩcm andρp5= 0.28 mΩcm in samples P1andP5, respectively. These results indicate that increasing compacting pressure improves the intergranular components of these uniaxially pressed Bi-2223 samples.
The ρ vs. J curves also displays a departure from the
plateau observed close toJ≈45 A/cm2 in all samples. As discussed in Ref. 13, such a value would be related to the su-perconducting critical current density of the grains,Jcg.
How-ever, such a value seems to be very low as compared with those ofJcg≈103-104A/cm2obtained by magnetic
measure-ments in similar temperatures.[18, 19] Such a discrepancy is related to the anisotropic factor Jcgab/Jcgc, whereJcgab and Jcgc
are the in-plane and out-of-plane superconducting critical cur-rent densities of grains, respectively. In Bi-2223 compounds Jcgab/Jcgc ∼50, as reported elsewhere.[20] Within this context,
one would expect that the first change in the plateau ofρ(J) curves reflects the dissipation in grains mainly oriented along thec-axis parallel to the applied current density, i.e., this value corresponds toJc
cg. By assuming that the values of the critical
current density reported by magnetic measurements [18, 19] mainly reflect theJcgabcomponent, then our results for the
out-of-planeJcseem to be reasonable.
IV. DISCUSSION
The influence of the uniaxial compacting pressure on the normal-state transport properties has been clearly demon-strated in XRD, SEM, andρ(T) measurements (see Figs. 2-4). The combined results indicate an increase of both the degree of texture (grain alignment) and the grain connectivity of the samples. Thus, a comprehensive analysis of these effects on the transport properties must be considered.
As far as this point is concerned, D´ıazet al.[13] have pro-posed a model in which theρ(T) data of polycrystalline sam-ples of high temperature superconductors are believed to be strongly influenced by two different contributions: one asso-ciated with the misalignment of the grains (texture degree) and the other one related to microstructural defects such as voids and microcracks. Within the context of the model, theρ(T) dependence can be written as[13]
ρ(T) =αn1 (ρab+ρwl), (2)
where
αn=fαstr (3)
is a factor that enhances the electrical resistivity due to both the misalignment of the grains f; 0<f ≤1; and microstruc-tural defectsαstr; 0<αstr≤1.
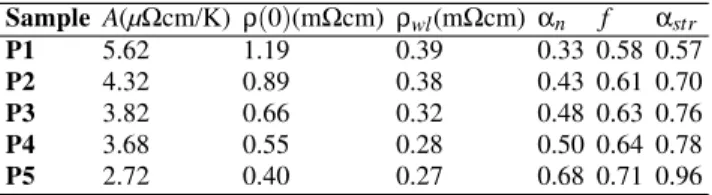
TABLE II: Parameters obtained by the linear fitting of the ρ(T) curves:Ais the slope of the electrical resistivity data in theT-linear region andρ(0) the residual electrical resistivity. We have also in-cluded the parameters obtained by using the model proposed in Ref. 13. Hereρwl is the average intergranular electrical resistivity and
αna factor that enhances the electrical resistivity due to the grain misalignment,f, and microstructural defects,αstr.
SampleA(µΩcm/K) ρ(0)(mΩcm) ρwl(mΩcm) αn f αstr
P1 5.62 1.19 0.39 0.33 0.58 0.57
P2 4.32 0.89 0.38 0.43 0.61 0.70
P3 3.82 0.66 0.32 0.48 0.63 0.76
P4 3.68 0.55 0.28 0.50 0.64 0.78
P5 2.72 0.40 0.27 0.68 0.71 0.96
single crystals with different oxygen contents. The data re-lated to the single crystal with optimum oxygen content indi-cate that the slope of the in-plane electrical resistivity,ρab(T), in theT-linear part, isAsc= 1.84µΩcm/K and that the
elec-trical resistivity at 300 K isρab(T)≈496µΩcm.[21] Therefore, bothαn andρwl can be obtained by using the appropriate expressions,[13]
αn=Asc
A , (4)
and
ρwl =αnρ(0), (5)
whereAis the slope of theρ(T) curve in theT-linear region (T ≥T∗
ρ) andρ(0) the residual electrical resistivity atT = 0.
Both parameters were obtained by fitting the electrical resis-tivity data to the typical linear dependenceρ(T) =AT+ρ(0). The best fitting parameters by using the above linear depen-dence are displayed in Table II.
As inferred from the analysis of Eq. (5), the residual elec-trical resistivity ρ(0) can not be considered as the actual in-tergranular electrical resistivity of the sample. Moreover,ρ(0) quantifies the influence of both the texture and microstructural defects on the magnitude of the intergranular electrical resis-tivity of the polycrystalline sample.
The calculated values of αn and ρwl, by using Eqs. (4) and (5), are given in Table II. As expected from the previous analysis, ρwl decreases appreciably (∼30 %) with increas-ing compactincreas-ing pressure, indicatincreas-ing an improvement of the intergranular component ofρ. Such a decrease inρwlwith in-creasing compacting pressure is mainly related to two mech-anisms: an increase of the degree of texture and a decrease of microstructural defects.
In order to gain further information regarding the above mechanisms, we tentatively try to separate both contributions from the estimated values ofαn. Such a separation requires, according to Eq. 3, the determination of f orαstr. As far as this point is concerned, D´ıazet al.[13] have proposed an ex-perimental procedure based on measurements of the paraco-herent electrical resistivity of polycrystalline samples,ρp, to
determine these parameters. In such a procedure, it has been assumed that the sample is in the so-called paracoherent state. This means that the grains are in the superconducting state but the intergranular junctions remain in the normal-state. Under these circumstances, the first term in Eq. (2) can be neglected and effects arising from the misalignment of grains become irrelevant, i. e., f = 1 andαn=αstr. In this case Eq. (2) is altered and rewritten as
ρp=
1
αstrρwl, (6)
whereρp is the paracoherent electrical resistivity. By using Eq.(6) in combination with the values of bothρpandρwl, an estimate ofαstr is possible. We have performed these esti-mates and the obtained values are displayed in Table II. As can be inferred from Eq. (6), the observed decrease inρp val-ues with increasing compacting pressure (see Table I) is re-lated to a similar behavior observed inρwland the progressive increase ofαstr (∼40 %), which in turn indicates the reduc-tion of microstructural defects. In addireduc-tion, one may to esti-mate the values of the grain misalignment factor f by using Eq. (3), knowing bothαnandαstr. As displayed in Table II, the grain misalignment factor f increases from f ∼0.58 to f
∼0.71 for samplesP1andP5, respectively. These results dicate an appreciable increase in the degree of texture with in-creasing compacting pressure and are in excellent agreement with both XRD and SEM data.
On the other hand, by combining the observed T-linear behavior in the ρ(T) dependence (see Fig. 4) with band-theory arguments, it is possible to obtain additional infor-mation regarding the effects of the compacting pressure on the normal-state transport properties.[7] Based on the behav-ior ofA an important information regarding the strength of the electron-phonon interaction can be obtained. By con-sidering that theT-linear behavior of ρ(T) curve is mainly caused by the electron-phonon scattering, then the transport electron-phonon coupling constantλtr can be estimated from the expression[7]
λtr=~ω 2
pA
8π2k
B
=0.246(~ωp)2A, (7) wherekBis the Boltzmann constant,~ωpis the plasma energy
expressed in eV, andAis expressed inµΩ cm/K (see Table II). Assuming that the London penetration depthλL for the BSCCO system is∼2100 ˚A,[22] then the plasma frequency can be estimated by using the relationωp=c/λL, wherecis the velocity of light, yielding~ωp= 0.893 eV. Additionally, from
the electrical resistivity measurements one can also estimate the mean free path of the carriers,l, following the equation:[7]
l(T) = 4πvF ω2
pρ(T)
=4.95×10
−4v
F
(~ωp)2ρ(T) , (8) wherevFis the Fermi velocity, which for BSCCO materials is
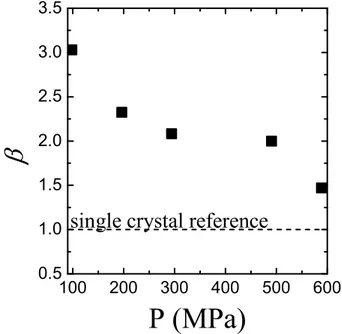
We mention that in Ref. 7, values ofρ(T) data have been corrected by a factorβ=ρ/ρab in order to separate theab -plane electrical resistivity from the measured electrical resis-tivity of polycrystalline samples. A constant value ofβ∼2 was derived, by comparing the transport data with those from high-quality ceramic and epitaxial thin films. Here we assume that such a correction factor must take into account the granu-lar features of ceramic samples and adopt the formβ=1/αn.
FIG. 8: Compacting pressure dependence of the correction factorβ. The dashed line indicatesβ= 1, a value corresponding to a single crystal specimen.
Figure 8 displays the compacting pressure dependence of the correction factorβ. It was found that the latter decreases fromβ ∼3, for the sampleP1, toβ ∼1.5 for the sampleP5, exhibiting a clear tendency toβ= 1, a value obtained from a single crystal specimen. This result strong suggests that sam-ples subjected to an optimally textured process can be used to obtain appropriated values of the transport electron-phonon constant as well as single crystal materials. Then, by using Eq. (7) and (8) we obtained for the sampleP5values ofλtr= 0.53 andl(300 K) = 12.7 ˚A. Similarly, the results obtained from the data of Bi-2223 single crystals[21] wereλtr= 0.37 andl(300 K) = 31 ˚A, respectively. Good agreement between estimates of the electron-phonon coupling constant are observed. Also, values comparable with the one obtained for the sampleP5 have been estimated in other High-Tc materials asλtr = 0.1
- 0.6 in Y-123, [7, 23, 24]λtr∼0.3 in LaSrCuO,[7] andλtr
∼0.17 in Ru-1222.[25] Values ofλtrin this range indicate a weak electron-phonon interaction in Bi-2223.
We have also found thatl(300 K) for the sampleP5is ac-tually higher than the typical Cu-O bond-length of∼2 ˚A in these cuprates. This lends credence to our analysis since no evidence of saturation inρ(T) has been observed close to 300 K. However, the value ofl(300 K) of∼12.7 ˚A for the sample P5is∼3 times lower than the one derived for single crystals (31 ˚A) by using the same procedure. It seems that such a
dif-ference is certainly related to the influence of the intergranular electrical resistivityρwl.
In order to evaluate the influence of the actual intergranular electrical resistivity,ρwl, on the mean free path, let us esti-matelby neglecting the contribution arising fromρwl in Eq. (2). By taking the data belonging to the sampleP5and as-sumingαstr≈1 (see Table II), one obtains, by using Eq. (8), l(300 K)≈21 ˚A. This value ofl(300 K) is closer to the one estimated for Bi-2223 single crystals ofl ≈31 ˚A, and over 1.5 times higher than the previous estimate ofl in which the intergranular component ofρ(T) has been considered.
V. CONCLUSIONS
In summary, we have carried out a systematic study on the influence of the uniaxial compacting pressure on the trans-port properties of Bi1.65Pb0.35Sr2Ca2Cu3O10+δ ceramic
sam-ples subjected to different compacting pressures before the last heat-treatment. Based on the linearity of the electrical re-sistivity curves and applying appropriate corrections, we have estimated both the transport electron-phonon coupling con-stant,λtr, and the mean free path,l. We have found that the extractedλtr values in well-compacted samples are in good agreement with similar estimates for single crystals. On the other hand, an appreciable difference was found in the case of the mean free path,l. Such a difference is certainly related to the intergranular electrical resistivity, which is an intrinsic feature of polycrystalline samples. In addition, contributions for the electrical resistivity arising from both the degree of texture and microstructural defects were extracted from a pre-cise analysis of theρ(T) dependence by using current models. It was found that increasing compacting pressure results in an increase of both the degree of texture and the grain connectiv-ity of the samples. We have also observed that the electrical resistivity curves in the normal-state region deviate from lin-earity atT∗∼235 K, a feature that points out changes in the
density of states and is related to the opening of the pseudo-gap. Such an opening of the pseudogap was confirmed by powder magnetic susceptibility measurements performed in the same samples. The temperature of the pseudogapT∗
re-sulted to be independent of the applied compacting pressure. This is an expected result considering that changes in the com-pacting pressure mainly affect the morphology of the grains, but the intragranular properties remain essentially the same.
Acknowledgments
Grant No. 303272/2004-0.
[1] H. Hilgenkamp and J. Mannhart, Rev. Mod. Phys. 74, 485 (2002).
[2] T. T. Tan, S. Li, H. Cooper, W. Gao, H. K. Liu and S. X. Dou, Supercond. Sci. Technol.14471 (2001).
[3] H. K. Liu, Y. C. Guo, and S. X. Dou, Physica B 194, 1931 (1994).
[4] H. K. Liu, W. M. Chen, A. Polyanskii, Y. C. Guo, G. Mac-Caughey, S. X. Dou, D. Larbalestier, and M. Apperley, Physica C341, 2547 (2000).
[5] W. M. Chen, Y. C. Guo, G. MacCaughey, M. Apperley, H. K. Liu, and S. X. Dou, Physica C354, 349 (2001).
[6] P. Mun´e, E. Govea-Alcaide, and R. F. Jardim, Physica C384, 491 (2003).
[7] M. Gurvitch and A. T. Fiory, Phys. Rev. Lett.59, 1337 (1987). [8] J. L. Tallon and J. W. Loram, Physica C349, 53 (2001). [9] V. J. Emery and S. A. Kivelson, Nature (London) 374, 434
(1995).
[10] T. Fujii, T. Watanabe, and A. Matsuda, Physica C 357, 173 (2001).
[11] D. C. Johnston, Phys. Rev. Lett.62, 957 (1989).
[12] C. Allgeier and J. S. Schilling, Phys. Rev. B48, 9747 (1993). [13] A. D´ıaz, J. Maza, and F. Vidal, Phys. Rev. B,55, 1209 (1997). [14] D. Goldschmidt, Phys. Rev. B39, 9139 (1989).
[15] D. Pandey, R. Mahesh, A. K. Singh, and V. S. Tiwari, Physica C184, 135 (1991).
[16] Y. Yamada, K. Anagawa, T. Shibauchi, T. Fujii, T. Watanabe, A. Matsuda, and M. Suzuki, Phys. Rev. B68, 54533 (2003). [17] T. Ekino, S. Hashimoto, T. Takasaki, and H. Fujii, Phys. Rev. B
64, 092510 (2001).
[18] A. A. Zhukov, D. A. Komarkov, and J. Mikovic, Cryogenics32, 1056 (1992).
[19] P. Mun´e, J. L´opez, and E. Altshuler, Physica C292, 48 (1995). [20] M. R. Cimberle, C. Ferdeghini, R. Fl¨ukiger, E. Giannini, G. Grasso, D. Marr`e, M. Putti, and A. S. Siri, Physica C251, 61 (1995).
[21] T. Fujii, private communication.
[22] M. Chiao, R. W. Hill, C. Lupien, L. Taillefer, P. Lambert, R. Gagnon, and P. Fournier, Phys. Rev. B62, 3554 (2000). [23] B. Friedl, C. Thomsen, and M. Cardona, Phys. Rev. Lett.65,
915 (1990).
[24] T. S. Nunner, J. Schmalian, and K. H. Bennemann, Phys. Rev. B59, 8859 (1999).