INTRODUCTION
A major selection criterion in meat-producing ani-mals is increased lean growth rate (Mrode, 1988; Simm, 1992; Clutter and Brascamp, 1998). Lean growth and closely associated traits are assumed to be under polygenic control. The advent of transgene technology may make it possible to introduce into livestock a regulated major transgene, e.g., the structural gene for growth hormone (GH) or insulin-like growth factor I (IGF-I), having a large positive effect on lean growth (Pinkert and Murray, 1999; Pursel et al., 1999). The feasibility of combining conven-tional selection with a GH transgene has been explored with several mouse models (Nagai et al., 1993; Siewerdt et al., 1999, 2000).
Data on correlated responses in the growth of inter-nal organs following selection for growth and/or the in-corporation of a transgene affecting growth are of value in understanding the quantitative genetics of growth and de-velopment (Eisen, 1986). The magnitude of these changes on specific organ weights may affect such diverse biologi-cal functions as protein synthesis, maintenance require-ments and reproduction. Fractional rates of protein syn-thesis are higher in visceral organs than in skeletal muscle (Garlick et al., 1976). Internal organs contribute more to maintenance requirements than skeletal muscle (Tess et al., 1984). Size of reproductive organs may impact
reproduc-tive function (Eisen and Johnson, 1981). Correlated re-sponses to selection for growth have been reported for vari-ous organ traits of mice (Robinson and Bradford, 1969; Eisen et al., 1978; Falconer et al., 1978; Eisen and Johnson, 1981; Eisen, 1986), as has the influence of a GH transgene on organ traits (Shea et al., 1987; Brem and Wanke, 1988; Brem et al., 1989; Pomp et al., 1992; Cecim et al., 1993). The present study focuses on correlated changes in organ traits when selection for increased body weight was conducted in the presence of a regulated GH transgene (Siewerdt et al., 1999, 2000).
MATERIAL AND METHODS
Source of stocks
The selected lines were formed with the objective of determining how selection response for increased growth would be affected by 1) the presence versus absence of a GH transgene, 2) a high-growth versus a randomly selected background, and 3) interaction between the two factors (Siewerdt et al., 1999, 2000). The ovine metallothionein la-ovine growth hormone (oMt1a-oGH) fusion gene (Shanahan et al., 1989) was backcrossed into a high-growth (M16) and randomly selected line (ICR). The M16 line had undergone long-term selection for 3- to 6-week postwean-ing weight gain, initiated from the ICR base (Eisen, 1975).
Correlated responses to selection for large body size in oMt1a-oGH
transgenic mice: organ traits
K.R. Parks1, E.J. Eisen1and J.D. Murray2
Abstract
The objective of the present study was to compare correlated responses in liver, spleen, kidney, heart and testis absolute weights and as a percentage of 8-week body weight following selection for large 8-week body weight in twice-replicated nontransgenic and transgene-carrier lines of mice from two genetic backgrounds. The transgene was an ovine metallothionein 1a-ovine growth hormone (oMt1a-oGH)
construct, which was activated by adding 25 mM ZnSO4 to the drinking water. Lines NM and NC were nontransgenic lines derived from
a high-growth and randomly selected background, respectively. Lines TM and TC were transgene-carrier lines formed from the respective genetic backgrounds. Line CC was a nontransgenic control from the randomly selected background. At weaning, male mice from each line were assigned to either zinc supplemented or control drinking water. Toe-clips were assayed by PCR for the presence or absence of the transgene. Correlated responses of absolute weights of all organs in nontransgenic lines indicated moderately high genetic correlations of organ weights with body weight, but on a percentage of body weight basis, the correlated responses were much lower. The correlated responses in visceral organ weights were lower in the presence of the inactivated oMt1a-oGH transgene than in its absence. The presence of the activated oMt1a-oGH combined with the effects of selection for growth increase had a greater impact on increasing the size of the splanchnic organs than did selection for large body weight in the absence of the transgene.
1Department of Animal Science, Box 7621, North Carolina State University, Raleigh, NC 27695, USA.
Send correspondence to E.J.E. Fax: +1-919-515-7780. E-mail: [email protected]
2Department of Animal Science and Department of Population Health and Reproduction, University of California, Davis,
An advantage of the oMt1a-oGH construct over other GH transgene models is that the transgene can be regulated by the addition and withdrawal of supplementary zinc in the drinking water (Shanahan et al., 1989).
After backcrossing of the transgene into the M16 and ICR lines, within-full-sib-family selection for increased 8-week body weight was conducted in four lines (Siewerdt et al., 1999). Lines NM and NC were nontransgenic lines derived from the high-growth and randomly selected back-grounds, respectively. Lines TM and TC were transgene-carrier lines formed from these respective genetic back-grounds. A nontransgenic control line (CC) derived from the randomly selected background was maintained contem-poraneously with the weight-selected lines. All lines were temporally replicated twice. The initial frequency of the transgene was 0.5 in TM and TC, but the frequency declined markedly in TM and rose moderately in TC over the course of selection (Siewerdt et al., 1999). In each generation of selection, all mice received 25 mM ZnSO4 in deionized drinking water between 3 and 8 weeks of age.
Experimental design
The experimental design was described by Parks et al. (2000a,b). Briefly, male mice were sampled from rep-licate 1 in generation 7 and reprep-licate 2 in generation 8 of the selection study. Litters were standardized to eight pups. The approximate numbers of litters per line and male mice per line were 24 and 80, respectively. Toe-clips from pups in line TM and TC were frozen at -20°C for later
poly-merase chain reaction assay of DNA to determine the car-riers of the oMt1a-oGH transgene (Pomp and Murray, 1991). The genotypes were not identified until all the data were collected.
Males were weaned and caged individually at 3 weeks of age, at which time mice were randomly assigned within litters to receive either 25 mM ZnSO4 in deionized drink-ing water (Z) or plain tap water (C). At 8 weeks of age, mice were weighed, killed by cervical dislocation, and the following organs were dissected and wet weights recorded: liver, spleen, right kidney, heart and right testis.
Mice were provided free access to feed and water. Purina Mouse Chow 5015 (Purina Mills, St. Louis, MO, USA) containing 102 ppm zinc was available to dams dur-ing matdur-ing, gestation and lactation. Purina Lab Chow 5001 (Purina Mills) containing 70 ppm zinc was fed from 3 to 8 weeks of age. Temperature (22°C), humidity (55%) and light
cycle (12-h light:12-h dark) were maintained in the labo-ratory.
Statistical analysis
Organ traits were analyzed on an absolute weight ba-sis, as a percentage of 8-week body weight and as the loga-rithm of organ weight adjusted by covariance analysis for the logarithm of body weight. The latter two analyses led
to similar conclusions, so that only the percentage data are presented. Organ traits were subjected to two mixed model analyses of variance using PROC MIXED in SAS
(Littell et al., 1996).
The first model contained the fixed effects of repli-cate-generation, line, treatment (Z versus C) and line by treatment interaction, and the random effects of litter nested within line by replicate-generation subclass and re-sidual. Orthogonal contrasts were partitioned as follows: s, high-growth (NM and TM) versus control (NC and TC) background lines; t, transgene-carrier (TM and TC) versus nontransgenic (NM and NC) lines; s x t, selection background by transgenic line interaction; overall, selected lines (NM, TM, NC and TC) versus the unselected control line (CC); trt, (Z versus C); s x trt, t x trt, s x t x trt and overall x trt, the respective interaction with treatment effects. Four non-or-thogonal contrasts were used to test for correlated responses in the NC and TC lines by taking deviations from the CC line within Z and C treatments, respectively. It was not possible to make analogous comparisons with NM and TM because there was no control line in the high-growth background.
The second mixed model involved only the transgene-carrier lines, TM and TC. The relevant fixed effects, ex-pressed as orthogonal contrasts, were: line, (TM versus TC);
Q, transgenic (T) versus nontransgenic (N) mice; trt, (Z versus C), and all possible interactions.
RESULTS
Line by treatment effects
Line by treatment means for each organ on an abso-lute weight and as a percentage of 8-week body weight ba-sis are listed in Tables I and II, respectively, and correspond-ing orthogonal contrasts are given in Tables III and IV. On an absolute weight and percentage of body weight basis, line effects were highly significant for all organs (Tables I and II) and zinc-supplemented mice had larger (P < 0.001) kidneys and smaller (P < 0.05) testis than nonsupplemented mice (Tables III and IV). However, line by treatment inter-actions were present for absolute and percentage weights of liver, spleen and kidney (P < 0.001), heart weight (P < 0.05) and testis percentage (P < 0.05).
In the absence of zinc treatment, absolute and percentage weights of high growth exceeded control background lines for liver and spleen, respectively (1,237 ± 91 mg, 91 ± 7
mg, 0.67 ± 0.15%, 0.10 ± 0.017%; P < 0.001), but when
dietary zinc supplement was administered the differences were reduced for liver and spleen weights (737 ± 93 mg,
44 ± 8 mg; P < 0.001) and were not significant for the
re-spective percentages (-0.11 ± 0.16%, 0.013 ± 0.017%; P >
0.05). For the kidney, larger absolute weights were found in the high-growth background in the absence of zinc but not when zinc was added (81 ± 14 mg; P < 0.001 vs. 3 ± 14
mg, P > 0.05), whereas smaller percentages were noted in the high-growth background, the difference being less with than without zinc supplement (-0.11 ± 0.025%; P < 0.001
vs. -0.27 ± 0.025%; P < 0.001). The s x trt interaction for
absolute heart weight occurred because the high-growth background lines had a greater difference than the random background lines without than with zinc added (70 ± 9 mg;
P < 0.001 vs. 43 ± 9 mg; P < 0.001).
Transgenic line by treatment (t x trt) interactions (P < 0.001) for absolute and percentage weights of liver, spleen and kidney occurred because these organs were sig-nificantly larger in transgene-carrier lines than in non-transgenic lines when supplemented with zinc (338 ± 93
mg, P < 0.001; 16 ± 8 mg, P < 0.05; 34 ± 14 mg, P < 0.05,
1.11 ± 0.16%, 0.60 ± 0.017%, 0.11 ± 0.025%, P < 0.001),
but the differences were reversed when zinc was withheld (-360 ± 91 mg, -24 ± 7 mg, -63 ± 14 mg, P < 0.001; -0.30 ± 0.14%, P < 0.05; -0.026 ± 0.017%, P > 0.05; -0.083 ±
0.025%, P < 0.001). A similar directional t x trt interac-tion occurred for heart weight (5 ± 9 mg, P > 0.05 vs. -18 ±
9 mg, P < 0.05). The t x trt interaction for testis percentage (P < 0.01) was due to a nonsignificant difference between transgene-carrier and nontransgenic lines with zinc, whereas the transgene-carrier lines had larger testis per-centage when zinc was added.
Correlated responses in NC and TC lines
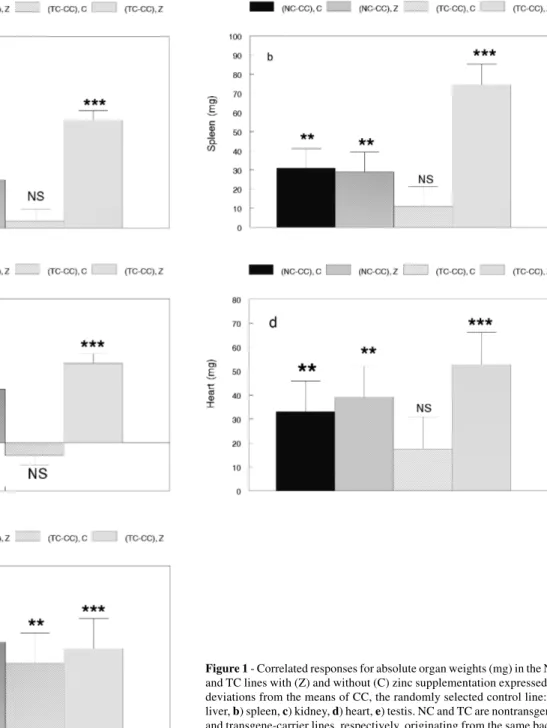
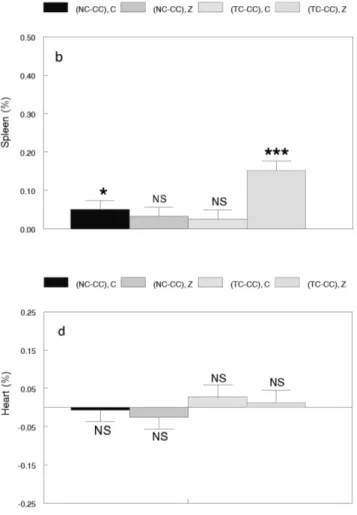
The positive correlated responses in all five absolute organ weights of line NC were significant and of similar magnitude with or without the addition of zinc to the drink-ing water (Figure 1). When expressed as a percentage of body weight, the only significant correlated responses were positive values for spleen without zinc supplement and kid-ney with zinc supplement (Figure 2). In line TC, positive correlated responses (P < 0.001) in all five absolute organ weights were found when zinc was added, but only testis weight showed a positive correlated response (P < 0.01) with no zinc supplement (Figure 1). On a percentage ba-sis, positive correlated responses were obtained for liver and testis and a negative correlated response for kidney in the absence of zinc supplement (Figure 2). When zinc was provided as a supplement, positive correlated re-sponses were found for liver, spleen and kidney as a per-centage of body weight.
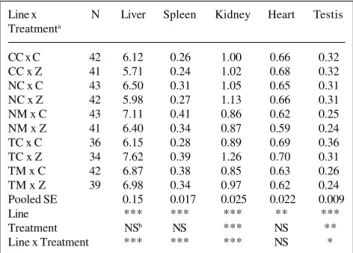
Table II - Least-squares means and SE for line by treatment subclasses and ANOVA significance levels of organ weights
as a percentage of 8-week body weight (%).
Line x N Liver Spleen Kidney Heart Testis Treatmenta
CC x C 42 6.12 0.26 1.00 0.66 0.32
CC x Z 41 5.71 0.24 1.02 0.68 0.32
NC x C 43 6.50 0.31 1.05 0.65 0.31
NC x Z 42 5.98 0.27 1.13 0.66 0.31
NM x C 43 7.11 0.41 0.86 0.62 0.25
NM x Z 41 6.40 0.34 0.87 0.59 0.24
TC x C 36 6.15 0.28 0.89 0.69 0.36
TC x Z 34 7.62 0.39 1.26 0.70 0.31
TM x C 42 6.87 0.38 0.85 0.63 0.26
TM x Z 39 6.98 0.34 0.97 0.62 0.24
Pooled SE 0.15 0.017 0.025 0.022 0.009
Line *** *** *** ** ***
Treatment NSb NS *** NS **
Line x Treatment *** *** *** NS *
aSee Table I for description of lines and treatments. bNS, F-test not
sig-nificant (P > 0.05). *P < 0.05, **P < 0.01, ***P < 0.001.
Table I - Least-squares means and SE for line by treatment subclasses and ANOVA significance levels of absolute 8-week organ weights (mg).
Linea x N Liver Spleen Kidney Heart Testis
Treatmentb
CC x C 42 1,905 80 311 206 99
CC x Z 41 1,695 70 303 202 94
NC x C 43 2,382 111 385 239 114
NC x Z 42 2,196 99 414 241 112
NM x C 43 3,574 205 429 311 122
NM x Z 41 3,221 173 436 293 121
TC x C 36 1,976 91 285 223 113
TC x Z 34 2,822 145 469 255 111
TM x C 43 3,259 178 403 292 119
TM x Z 40 3,270 160 450 289 110
Pooled SE 92 7 14 9 3
Line *** *** *** *** ***
Treatment NSc NS *** NS *
Line x Treatment *** *** *** * NS
aCC, Randomly selected control; the following lines were selected for
large 8-week body weight: NC, nontransgenic line from control back-ground; NM, nontransgenic line from high-growth backback-ground; TC, transgene-carrier line from control background; TM, transgene-carrier line from high-growth background. bZ, Zinc supplementation; C, no
supplementation. CNS, F-test not significant (P > 0.05). *P < 0.05, ***P <
0.001.
0.05), liver percentage (TM - NM = 0.17 ± 0.16%, P >
0.05 vs. TC - NC = 0.64 ± 0.16%, P < 0.001) and spleen
percentage (TM - NM = -0.014 ± 0.018%, P > 0.05 vs. TC
- NC = 0.047 ± 0.018%, P < 0.01). Overall, the four
se-lected lines had larger (P < 0.001) absolute organ weights and proportionally larger (P < 0.001) livers and spleens and smaller (P < 0.001) testis than the CC control line.
Transgene-carrier line by treatment by transgene effects
Transgene-carrier line (TC, TM) by treatment (C, Z) by transgene (N, T) means for absolute and percentage of body weight organ means are presented in Tables V and VI and corresponding orthogonal contrasts are in Tables VII and VIII. The small proportions of nontransgenic TC and transgenic TM mice are representative of the oMt1a-oGH gene frequency in the generations of selection that were sampled (Siewerdt et al., 1999).
Line TM had significantly larger liver and spleen weights on an absolute and percentage of body weight basis and smaller kidney, heart and testis weights on a percentage basis compared with line TC. Transgenic mice had signifi-cantly larger liver, spleen and testis weights as a percentage of 8-week body weight and a smaller (P < 0.05) heart weight than nontransgenic mice. Zinc supplemented mice had sig-nificantly larger liver, spleen and kidney organs when ex-pressed on an absolute or percentage basis relative to nonsupplemented mice. No significant line by treatment
in-Table IV - Orthogonal contrasts ± SE involving
NC, NM, TC, TM and CC linesa for organ weights as a percentage of 8-week body weight (%).
Contrastb Liver Spleen Kidney Heart Testis
s 0.56 ± 0.23* 0.12 ± 0.03*** 0.38 ± 0.04*** -0.12 ± 0.04*** -0.15 ± 0.02***
t 0.82 ± 0.23*** 0.03 ± 0.03 0.03 ± 0.04 0.06 ± 0.04 0.02 ± 0.02
trt -0.01 ± 0.08 -0.01 ± 0.01 0.12 ± 0.01*** -0.00 ± 0.01 -0.02 ± 0.01**
s x t -0.47 ± 0.23* -0.06 ± 0.03* 0.04 ± 0.04 -0.02 ± 0.04 -0.01 ± 0.02
Overall 3.16 ± 0.51*** 0.38 ± 0.06*** -0.11 ± 0.09 -0.12 ± 0.08 -0.14 ± 0.03***
s x trt -1.54 ± 0.36*** -0.18 ± 0.04*** -0.32 ± 0.06*** -0.05 ± 0.05 0.04 ± 0.02
t x trt 2.80 ± 0.36*** 0.17 ± 0.04*** 0.39 ± 0.06*** 0.03 ± 0.05 -0.06 ± 0.02**
(s x t) x trt -1.15 ± 0.36** -0.12 ± 0.04** -0.19 ± 0.06** 0.02 ± 0.05 0.03 ± 0.02
Overall x trt 1.98 ± 0.80* 0.04 ± 0.09 0.50 ± 0.14*** -0.11 ± 0.12 -0.06 ± 0.05 aSee Table I for description of lines. bSee Table III for definition of contrasts. *P < 0.05. **P < 0.01, ***P < 0.001.
Table III - Orthogonal contrasts ± SE involving
NC, NM, TC, TM and CC linesa for absolute 8-week organ weights (mg).
Contrast Liver Spleen Kidney Heart Testis
sb 1,974 ± 150*** 135 ± 12*** 83 ±.23*** 113 ± 15*** 11 ±.5*
tc 23 ± 150 -8 ± 12 -29 ±.23 -12 ± 15 -8 ±.5
trt 22 ± 470 -4 ± 40 52 ±.7*** 2 ± 50 -4 ±.2*
s x te -243 ± 150 -33 ± 12** 17 ±.23 -10 ± 15 -6 ±.5
Overallf 4,150 ± 328*** 280 ± 26*** 407 ±.50*** 255 ± 33*** 76 ±.12***
s x trtg -1,001 ± 213*** -93 ± 18*** -159 ±.31*** -54 ± 22** -5 ±.7
t x trth 1,396 ± 213*** 80 ± 18*** 193 ±.31*** 45 ± 22* -10 ±.7
(s x t) x trti -668 ± 213** -51 ± 18** -115 ±.31*** -14 ± 22 -9 ±.7
Overall x trtj 1,158 ± 470* 30 ± 40 300 ±.69*** 28 ± 49 5 ±.16 aSee Table I for description of lines. bHigh-growth background lines versus control background lines. Contrast is NM
+ TM - NC - TC. cTransgene-carrier lines versus nontransgenic lines. Contrast is TC + TM - NC - NM. dZinc
supple-mentation versus no supplesupple-mentation. Contrast is Z - C. eContrast is NC + TM - NM -TC. fContrast is NC + NM + TC
+ TM - 4CC. gContrast is (NC x C) + (NM x Z) + (TC x C) + (TM x Z) - (NC x Z) - (NM x C) - (TC x Z) - (TM x C). hContrast
is (NC x C) + (NM x C) + (TC x Z) + (TM x Z) - (NC x Z) - (NM x Z) - (TC x C) - (TM x C). iContrast is (NC x Z) + (NM x
C) + (TC x C) + (TM x Z) - (NC x C) - (NM x Z) - (TC x Z) - (TM x C). jContrast is 4(CC x C) + (NC x Z) + (NM x Z) + (TC
x Z) - 4(CC x Z) - (NM x C) - (TC x C) - (TM x C). *P < 0.05, **P < 0.01, ***P < 0.001.
teractions were found for any organ size traits. Line by transgene interactions were present for absolute weights of liver (P < 0.01) and kidney (P < 0.05). In the case of liver weight, TC transgenic mice exceeded nontransgenic mice (372 ± 171 mg, P < 0.05), but TM transgenic mice were
smaller than TC transgenic mice (-351 ± 212 mg, P < 0.10).
Kidney weights of TC transgenic and nontransgenic mice were not different (-30 ± 31, P > 0.05), whereas TM
transgenic mice had smaller kidney weights than TM nontransgenics (-73 ± 36, P < 0.10). Significant treatment
by transgene interactions were apparent for liver, spleen and kidney on a weight and proportion of body weight basis. The addition of zinc led to larger organ weights on a percentage scale in transgenic than in nontransgenic mice (1.39 ± 0.27%,
P < 0.001 for liver; 0.13 ± 0.04%, P < 0.01 for spleen, and
0.16 ± 0.07%, P < 0.05 for kidney), whereas in the absence
of zinc, there were no significant differences between transgenic and nontransgenic mice for liver (-0.08 ± 0.23%,
P > 0.05) and spleen (-0.01 ± 0.03%, P > 0.05) and transgenic
mice had smaller kidneys (-0.13 ± 0.06%, P < 0.05).
Activated transgene plus selection versus selection
To compare the combined effects on organ size of the activated GH transgene and selection for large 8-week body weight with selection for body weight alone, the per-tinent means in the randomly selected background are TC x Z x T (Tables V and VI) and NC x Z (Tables I and II). The TC x Z x T means exceeded (P < 0.001) NC x Z for liver, spleen and kidney on both an absolute and percentage basis while heart and testis contrasts were not significantly
dif-ferent (Table IX). Analogous comparisons were not made in the high-growth background because only four mice were available in the TM x Z x T group.
DISCUSSION
Correlated responses in a nontransgenic line
The nontransgenic NC line had positive correlated responses in absolute weights of liver, spleen, kidney, heart and testis following selection for large 8-week body weight,
Figure 2 - Correlated responses for organ weights as a percentage of 8-week body weight in the NC and TC lines with (Z) and without (C) zinc supplementation expressed as deviations from the means of CC, the ran-domly selected control line: a) liver, b) spleen, c) kidney, d) heart, e) testis. NC and TC are nontransgenic and transgene-carrier lines, respectively, originating from the same background as CC, and subsequently selected for 8-week body weight. NS = Not significant, *P < 0.05. **P < 0.01, ***P < 0.001.
the zinc supplement having had no effect on the corlated responses for each organ. Positive correcorlated re-sponses in liver, spleen, kidney and heart weights have been observed previously in lines selected for large body weight (Nash and Logsdon, 1978; Bünger et al., 1985). The correlated responses are in agreement with moder-ately high positive genetic correlations of these respec-tive organ weights with adult body weight (Eisen and Johnson, 1981; Kramer et al., 1998). The absence of a zinc effect on correlated responses in organ weights
indi-cates that 25 mM ZnSO4 is not having any detrimental in-fluences on organ growth as related to selection for over-all body growth.
correla-tions are as strongly positive on a degree of maturity basis as on an age basis.
When organ weights were analyzed as a percentage of 8-week body weight, only the spleen without zinc and the kidney with zinc had significant positive correlated re-sponses in line NC. These data suggest that the genetic correlations between adult body weight and the respective organ weights as a percentage of body weight are lower than the corresponding genetic correlations between adult
body weight and absolute organ weights. Because the ge-netic correlations of body weight with the respective or-gan weights as a percentage of body weight are part-whole correlations, the reason the genetic correlations between body weight and organ weight as a percentage of body weight are small can be explained in biometrical terms (Eisen, 1966). In this case, the difference between (the genetic coefficient of variation in the organ weight) times (the ge-netic correlation between the organ weight and body
Table V - Least-squares means ± SE for line by treatment by transgene subclasses
within lines TC and TM for absolute organ weights (mg).
Line x Treatmenta N Liver Spleen Kidney Heart Testis
x Transgeneb
TC x C x N 8 2,225 ±.198 100 ±.17 342 ± 35 254 ± 21 107 ±.8
TC x C x T 28 1,992 ±.107 88 ±.9 270 ± 19 215 ± 11 115 ±.5
TC x Z x N 8 2,032 ±.199 99 ±.17 369 ± 35 243 ± 21 104 ±.8
TC x Z x T 26 3,080 ±.111 159 ±.10 500 ± 20 260 ± 12 112 ±.5
TM x C x N 36 3,336 ±.96 182 ±.8 422 ± 17 302 ± 10 119 ±.4
TM x C x T 7 2,880 ±.221 157 ±.19 305 ± 40 236 ± 23 120 ±.9
TM x Z x N 36 3,297 ±.96 157 ±.8 453 ± 17 294 ± 10 110 ±.4
TM x Z x T 4 3,051 ±.291 185 ±.25 425 ± 52 246 ± 31 102 ±.12 aSee Table I for description of lines and treatments. bT, Transgene present; N, transgene absent.
Table VII - Orthogonal contrasts ± SE within lines TC and TMa for absolute organ weights (mg).
Contrast Liver Spleen Kidney Heart Testis
Lineb 826 ± 138*** 59 ± 12*** 31 ± 25 27 ± 14 3 ±.6
Qc 11 ± 130 13 ± 11 -21 ± 23 -34 ± 14* 2 ±.6
Trtd 274 ± 113* 18 ± 10t 102 ± 20*** 9 ± 12 -8 ±.5
Line x trte -416 ± 227 -33 ± 19 -53 ± 41 -16 ± 24 -10 ±.9
Line x Qf -723 ± 272** -22 ± 24 -102 ± 49* -46 ± 29 -12 ±.12
Trt x Qg 80 ± 233*** 62 ± 20** 146 ± 42*** 37 ± 25 -5 ±.10
Line x trt x Qh -1,141 ± 466* -18 ± 40 -116 ± 83 -38 ± 50 -9 ±.20 aSee Table 1 for description of lines. bHigh-growth background line versus control background line. Contrast
is TM - TC. cTransgenic mice versus nontransgenic mice. Contrast is T - N. dZinc supplementation versus no
supplementation. Contrast is Z - C. eContrast is (TC x C) + (TM x Z) - (TC x Z) - (TM x C). fContrast is (TC x N)
+ (TM x T) - (TC x T) - (TM x N). gContrast is (C x N) + (Z x T) - (C x T) - (Z x N). hContrast is (TC x C x T) + (TC
x Z x N) + (TM x C x N) + (TM x Z x T) - (TC x C x N) - (TC x Z x T) - (TM x C x T) - (TM x Z x N). tP < 0.10, *P <
0.05, **P < 0.01, ***P < 0.001.
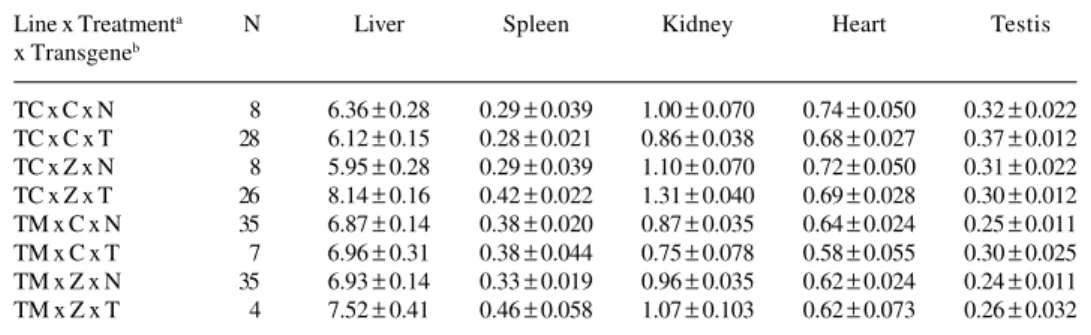
Table VI - Least-squares means ± SE for line by treatment by transgene subclasses within
lines TC and TM for organ weights as a percentage of 8-week body weight (%).
Line x Treatmenta N Liver Spleen Kidney Heart Testis
x Transgeneb
TC x C x N 8 6.36 ± 0.28 0.29 ± 0.039 1.00 ± 0.070 0.74 ± 0.050 0.32 ± 0.022
TC x C x T 28 6.12 ± 0.15 0.28 ± 0.021 0.86 ± 0.038 0.68 ± 0.027 0.37 ± 0.012
TC x Z x N 8 5.95 ± 0.28 0.29 ± 0.039 1.10 ± 0.070 0.72 ± 0.050 0.31 ± 0.022
TC x Z x T 26 8.14 ± 0.16 0.42 ± 0.022 1.31 ± 0.040 0.69 ± 0.028 0.30 ± 0.012
TM x C x N 35 6.87 ± 0.14 0.38 ± 0.020 0.87 ± 0.035 0.64 ± 0.024 0.25 ± 0.011
TM x C x T 7 6.96 ± 0.31 0.38 ± 0.044 0.75 ± 0.078 0.58 ± 0.055 0.30 ± 0.025 TM x Z x N 35 6.93 ± 0.14 0.33 ± 0.019 0.96 ± 0.035 0.62 ± 0.024 0.24 ± 0.011
weight) and the genetic coefficient of variation in body weight must be small relative to the genetic standard de-viation of the organ weight/body weight ratio.
Correlated responses in a transgene-carrier line
A major goal of the present study was to compare cor-related responses in organ traits in the transgene-carrier TC line with those in the nontransgenic NC line. In the ab-sence of zinc supplement, only absolute testis weight in the TC line showed a significant positive correlated re-sponse, indicating that the presence of the oMt1a-oGH transgene in the inactive state led to reduction in the ge-netic correlations between adult body weight and the re-spective weights of liver, spleen, kidney and heart. When the oMt1a-oGH transgene was activated by addition of the zinc supplement, correlated responses in absolute organ weights were all positive, but these are probably overesti-mated because the control line used for TC did not contain the oMt1a-oGH transgene and liver, spleen, kidney and heart weights are known to be increased in GH-based transgenic mice (Pomp et al., 1992; Wanke et al., 1992; Eisen et al., 1995; Siewerdt et al., 1998). Therefore, a comparison was made between nontransgenic mice in TC and CC on the zinc supplemented diet; the correlated responses in these or-gans were positive but did not reach statistical significance. Considering organ weights on a percentage of body weight basis, correlated responses in TC without zinc supplement were positive for liver and testis, and negative for kidney. With zinc supplement, the correlated responses
were positive for liver, spleen and kidney, but again these are probably affected to a considerable extent by the ab-sence of an unselected transgenic control line. There were no significant correlated responses in organ percentages when only nontransgenic TC mice were considered.
It is concluded that when selection was for adult body weight, the correlated responses in visceral organ weights were lower in the presence of the inactivated oMt1a-oGH transgene, while for testis weight the correlated response was probably not affected. Because selection was always conducted with the transgene activated (Siewerdt et al., 1999, 2000), when splanchnomegaly is common for GH-base transgenes (Wanke et al., 1992), it may be that genes affecting visceral organ size per se received less selection pressure than when the oMt1a-oGH transgene was not present.
Activated transgene plus selection versus selection alone
The presence of the activated oMt1a-oGH transgene and selection combined had a greater impact on increasing the size of the liver, spleen and kidney than did selection for increased 8-week body weight alone. We have already shown that the presence of the inactivated GH transgene has reduced the genetic correlation between organ weights and body weight. Therefore, it seems that the activated oGH transgene has a much larger effect on increasing the size of liver, spleen and kidney than does selection for growth rate. A distinction between the effects of selection for in-creased growth and the activated oMt1a-oGH transgene is that splanchnomegalic organ weights as a percentage of body weight approach those of nontransgenic controls with an increased period of transgenic inactivation (Sharp et al., 1995). Another difference is the pathomorphological find-ings for liver, kidney and heart in chronically expressed GH transgenic mice (reviewed by Wanke et al., 1996).
GH transgene in livestock breeding
Siewerdt et al. (1999, 2000) have shown with a mouse model that combining conventional selection for increased growth with a regulated GH transgene is feasible provided
Table IX - Contrast of TC x Z x T with NC x Z organ means ± SE on an
absolute weight and percentage of body weight basisa.
Organ Absolute weight (mg) Percentage of body weight (%) Liver 884 ±.144*** 2.16 ± 0.22***
Spleen 60 ±.12*** 0.15 ± 0.028***
Kidney 86 ±.24*** 0.18 ± 0.047***
Heart 19 ±.15 0.03 ± 0.039
Testis 0 ±.6 -0.01 ± 0.015
aSee Table I for definition of lines; Z, zinc supplementation; T, transgene
present. ***P < 0.001.
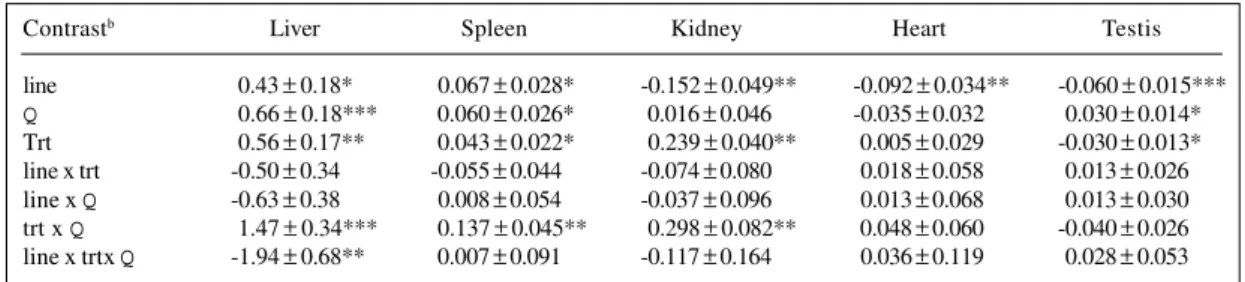
Table VIII - Orthogonal contrasts ± SE within lines TC and TMa for organ weights as a percentage of 8-week body weight (%).
Contrastb Liver Spleen Kidney Heart Testis
line 0.43 ± 0.18* 0.067 ± 0.028* -0.152 ± 0.049** -0.092 ± 0.034** -0.060 ± 0.015***
Q 0.66 ± 0.18*** 0.060 ± 0.026* 0.016 ± 0.046 -0.035 ± 0.032 0.030 ± 0.014*
Trt 0.56 ± 0.17** 0.043 ± 0.022* 0.239 ± 0.040** 0.005 ± 0.029 -0.030 ± 0.013*
line x trt -0.50 ± 0.34 -0.055 ± 0.044 -0.074 ± 0.080 0.018 ± 0.058 0.013 ± 0.026
line x Q -0.63 ± 0.38 0.008 ± 0.054 -0.037 ± 0.096 0.013 ± 0.068 0.013 ± 0.030
trt x Q 1.47 ± 0.34*** 0.137 ± 0.045** 0.298 ± 0.082** 0.048 ± 0.060 -0.040 ± 0.026
extreme selection for growth rate had not occurred previ-ously and the gene construct has no major fitness flaws. Previous studies have indicated that selection for greater growth will increase visceral organ size to meet metabolic demands of a larger muscle mass, thus increasing mainte-nance requirements. The present results suggest that the activated GH transgene may lead to a proportionally greater increase in visceral organ size, particularly the liver and spleen, than selection for increased growth rate. The dis-tinction is that by being able to inactivate the GH transgene, organomegaly and hepatic lesions can be resolved (Sharp et al., 1995). The challenge will be to construct transgenes for livestock having the desirable features of being regu-lated, having no detrimental fitness effects and no patho-logical effects.
ACKNOWLEDGMENTS
Research supported by USDA National Research Initiative Competitive Grant No. 9403975 and the North Carolina Agricul-ture Research Service (NCARS), Raleigh, NC 27695-7643, USA. The use of trade names in this publication does not imply endorse-ment by the NCARS, nor criticism of similar ones not endorse-mentioned.
RESUMO
O objetivo do presente estudo foi comparar as respostas correlacionadas no peso absoluto do fígado, baço, rim, coração e testículo e como uma percentagem do peso corporal em 8 semanas após seleção para grande peso corporal de 8 semanas em linhagens de camundongos não transgênicos e portadores de transgene
re-plicado duas vezes, originados de dois backgrounds genéticos.
O transgene era um composto de hormônio de crescimento ovino metalotioneína 1a-ovino (oMt1a-oGH), que foi ativado pela adição
de 25 mM ZnSO4 à água de beber. Linhagens MM e NC eram
linhagens não transgênicas derivadas de background de alto
crescimento e selecionado ao acaso, respectivamente. As linhagens TM e TC eram portadoras de transgene formadas a partir dos
respectivos backgrounds genéticos. A linhagem CC era um
con-trole não transgênico obtido de background selecionado ao acaso.
No desmame, os camundongos machos de cada linhagem foram alocados para água de beber com suplemento de zinco ou controle. Clips de dedos foram testados por PCR para detectar a presença ou não do transgene. As respostas correlacionadas dos pesos absolutos de todos os órgãos nas linhagens não transgênicas indicaram correlações genéticas moderadamente elevadas dos pesos dos órgãos com o peso corporal, mas com relação à porcen-tagem do peso corporal, as respostas correlacionadas foram muito menores. As respostas correlacionadas nos pesos das vísceras fo-ram menores na presença do transgene oMt1a-oGH inativado do que na sua ausência. A presença do oMt1a-oGH ativado combinada com os efeitos da seleção para aumento do crescimento tiveram um impacto maior no aumento do peso dos órgãos esplâncnicos do que a seleção para peso corporal elevado na ausência do transgene.
REFERENCES
Brem, G. and Wanke, R. (1988). Phenotypic and pathomorphological char-acteristics in a halfsib-family of transgenic mice carrying MT-hGH
genes. In: New Developments in Bioscience: Their Implications for Laboratory Animal Science (Beynen, A.C. and Solleveld, H.A., eds.). Martinus Nijhoff Publ., Dordrecht, 93-98.
Brem, G., Wolf, E., Buchmüller, T., Müller, M., Brennig, B. and Hermanns, W. (1989). Multiple consequences of human growth hormone expres-sion in transgenic mice. Mol. Biol. Med. 6: 531-547.
Bünger, L., Remus, N. and Roschlau, D. (1985). Selection for different growth parameters in laboratory mice and its correlated effects on body composition and organ weights. Nahrung 29: 549-560.
Cecim, M., Bartke, A., Yun, J.G. and Wagner, T.A. (1993). Growth allom-etry of transgenic mice expressing the mouse metallothionein-I bo-vine/growth hormone gene. Transgene 1: 125-132.
Clutter, A.C. and Brascamp, E.W. (1998). Genetics of performance traits. In: The Genetics of the Pig (Rothschild, M.F. and Ruvinsky, A., eds.). CABI Publishing, Oxon, 427-462.
Eisen, E.J. (1966). Effect of the biometrical relationship among total milk yield, milk constituent yield, and per cent of milk constituent on re-sponse to selection. J. Dairy Sci. 49: 1230-1234.
Eisen, E.J. (1975). Population size and selection intensity effects on long-term selection response in mice. Genetics 79: 305-323.
Eisen, E.J. (1986). Maturing patterns of organ weights in mice selected for rapid postweaning gain. Theor. Appl. Genet. 73: 148-157.
Eisen, E.J. and Johnson, B.H. (1981). Correlated responses in males repro-ductive traits in mice selected for litter size and body weight. Genetics 99: 513-524.
Eisen, E.J., Hayes, J.F., Allen, C.E., Bakker, H. and Nagai, J. (1978). Cel-lular characteristics of gonadal fat pads, livers and kidneys in two strains of mice selected for rapid growth. Growth 42: 7-25.
Eisen, E.J., Murray, J.D. and Schmitt, T.J. (1995). An ovine growth hor-mone transgene model suitable for selection experiments for growth in mice. J.Anim. Breed Genet. 112: 401-413.
Falconer, D.S., Gauld, I.K. and Roberts, R.C. (1978). Cell numbers and cell sizes in organs of mice selected for large and small size. Genet. Res. 31: 287-301.
Garlick, P.J., Burk, G.L. and Swick, R.W. (1976). Protein synthesis and RNA in tissues of the pig. Am. J. Physiol. 230: 1108-1112.
Kramer, M.G., Vaughn, T.T., Pletscher, L.S., King-Ellison, K., Adams, E., Erikson, C. and Cheverud, J.M. (1998). Genetic variation in body weight gain and composition in the intercross of large (LG/J) and small (SM/J) inbred strains of mice. Genet. Mol. Biol. 21: 211-218.
Littell, R.C., Milliken, G.A., Stroup, W.W. and Wolfinger, R.D. (1996).
SAS® System for Mixed Models. SAS Inst. Inc., Cary.
Mrode, R.A. (1988). Selection experiments in beef cattle. Part 2: A review of responses and correlated responses. Anim. Breed Abst. 56: 155-167.
Nagai, J., Lin, C.Y. and Saber, P. (1993). Selection for increased adult body weight in mouse lines with and without the rat growth hormone transgene. J.Anim. Breed. Genet. 110: 371-384.
Nash, D.J. and Logsdon Jr., D.F. (1978). Morphological and physiological changes in mice (Mus musculus)selected for large size. Comp. Biochem. Physiol. A61: 283-285.
Parks, K.R., Eisen, E.J., Parker, I.J., Hester, L.G. and Murray, J.D. (2000a). Correlated responses to selection for large body size in oMt1a-oGH transgenic mice: reproductive traits. Genet. Res.75: 199-208.
Parks, K.R., Eisen, E.J. and Murray, J.D. (2000b). Correlated responses to selection for large body size in oMt1a-oGH mice: growth, feed effi-ciency and body composition. J. Anim. Breed Genet. 117: 385-405.
Pinkert, C.A. and Murray, J.D. (1999). Transgenic farm animals. In:
Transgenic Animals in Agriculture (Murray, J.D., Anderson, G.B., Oberbauer, A.M. and McGloughlin, M.M., eds.). CABI Publishing, Oxon, 1-18.
Pomp, D. and Murray, J.D. (1991). Single day detection of transgenic mice by PCR of toe-clips. Mouse Genome 89: 279.
Pomp, D., Nancarrow, C.D., Ward, K.A. and Murray, J.D. (1992). Growth, feed efficiency and body composition of transgenic mice expressing a sheep metallothionein 1a-sheep growth hormone fusion gene. Livest. Prod Sci. 31: 335-350.
Pursel, V.G., Wall, R.J., Mitchell, A.D., Elasser, T.H., Solomon, M.B., Coleman, M.E., DeMayo, F. and Schwartz, R.J. (1999). Expression of insulin-like growth factor-I in skeletal muscle of transgenic swine. In:
Oberbauer, A.M. and McGloughlin, M.M., eds.). CABI Publishing, Oxon, 131-144.
Robinson, D.W. and Bradford, G.E. (1969). Cellular response to selection for rapid growth in mice. Growth 33: 221-229.
Shanahan, C.M., Rigby, N.W., Murray, J.D., Marshall, J.T., Townrow, C.A., Nancarrow, C.D. and Ward, K.A. (1989). Regulation of expression of a sheep metallothionein 1a-sheep growth hormone fusion gene in transgenic mice. Mol. Cell. Biol. 9: 5473-5479.
Sharp, K.R., Knudson, D.E.B., Pomp, D. and Murray, J.D. (1995). Expres-sion of an ovine growth hormone transgene in mice causes organo-megaly and hepatic lesions which resolve following transgene inacti-vation. Lab. Anim. Sci. 45: 607-612.
Shea, B.T., Hammer, R.E. and Brinster, R.L. (1987). Growth allometry of the organs in giant transgenic mice. Endocrinology 121: 1924-1930.
Siewerdt, F., Eisen, E.J., Conrad-Brink, J.S. and Murray, J.D. (1998). Gene action of the oMt1a-oGH transgene in two lines of mice with distinct selective backgrounds. J. Anim. Breed Genet. 115: 211-226.
Siewerdt, F., Eisen, E.J. and Murray, J.D. (1999). Direct and correlated responses to short-term selection for 8-week body weight in lines of transgenic (oMt1a-oGH) mice. In: Transgenic Animals in Agriculture
(Murray, J.D., Anderson, G.B., Oberbauer, A.M and McGloughlin, M.M.,
eds.). CABI Publishing, Oxon, 231-250.
Siewerdt, F.,Eisen, E.J., Murray, J.D. and Parker, I.J. (2000). Response to 13 generations of selection for increased 8-week body weight in lines of mice selected for increased 8-week body weight. J.Anim. Sci. 78: 832-845.
Simm, G. (1992). Selection for lean meat production in sheep. In: Recent Advances in Sheep and Goat Research (Speedy, A.W., ed.). CABI Publishing, Oxon, 193-215.
Taylor, St. C.S. (1980). Genetic size-scaling rules in animal growth. Anim. Prod 30: 161-165.
Tess, M.W., Dickerson, G.E., Nienaber, J.A. and Ferrell, C.L. (1984). The effects of body composition on fasting heat production in pigs. J. Anim. Sci. 58: 99-110.
Wanke, R., Wolf, E., Hermanns, W., Folger, S., Buchmüller, T. and Brem, G. (1992). The GH-transgenic mouse as an experimental model for growth research: clinical and pathological studies. Horm. Res. 37
(Suppl. 3): 74-87.
Wanke, R., Wolf, E., Brem, G. and Hermanns, W. (1996). Physiology and pathology of growth - studies in GH transgenic mice. J. Anim. Breed. Genet. 113: 445-456.