PROGRAMA DE PÓS-GRADUAÇÃO EM DIVERSIDADE BIOLÓGICA E CONSERVAÇÃO
ALEXANDRE PERESSIN
IMPACTOS DA URBANIZAÇÃO NA ICTIOFAUNA DE RIACHOS
DA PARTE SUPERIOR DA BACIA DO ALTO RIO
PARANAPANEMA (SP), BRASIL.
SOROCABA
PROGRAMA DE PÓS-GRADUAÇÃO EM DIVERSIDADE BIOLÓGICA E CONSERVAÇÃO
ALEXANDRE PERESSIN
IMPACTOS DA URBANIZAÇÃO NA ICTIOFAUNA DE RIACHOS
DA PARTE SUPERIOR DA BACIA DO ALTO RIO
PARANAPANEMA (SP), BRASIL.
Dissertação apresentada ao programa
de Pós-Graduação em Diversidade
Biológica e Conservação para
obtenção do título de mestre em
Diversidade
Biológica
e
Conservação.
SOROCABA
Peressin, Alexandre.
P437i Impactos da urbanização na ictiofauna de riachos da parte superior da bacia do Alto Rio Paranapanema (SP), Brasil / Alexandre Peressin. –– Sorocaba, 2013.
83 f.: il. (color.) ; 28 cm
Dissertação (mestrado) - Universidade Federal de São Carlos, Campus Sorocaba, 2013
Orientador: Mauricio Cetra
Banca examinadora: George Mendes Taliaferro Mattox, Giulianna Rondineli Carmassi.
Bibliografia
1. Ictiologia – Rio Paranapanema (SP). 2. Ecossistema aquático. 3. Urbanização I. Título. II. Sorocaba - Universidade Federal de São Carlos.
CDD 597
AGRADECIMENTOS
Ao Prof. Dr. Mauricio Cetra, meu orientador, pela criatividade e valioso conhecimento compartilhado, pelo elogio ao bom trabalho e pela crítica ao nem tão bom assim, pelos dias despendidos no seu cuidadoso processo de orientação, pela capacidade de sugerir o melhor caminho em cada situação e, enfim, pelos conselhos sempre em boa hora.
À FAPESP, pelo suporte financeiro na forma de bolsa de mestrado (Processo número 2010/13758-0) e auxílio regular (Processo número 2009/53056-8).
À CAPES, pelos primeiros 5 meses de bolsa neste projeto.
Aos meus pais, Gilberto e Natalina, a minha irmã Maíra e a minha avó, Rosa, por todo o tipo de suporte que possibilitou a chegada ao mestrado. Não há dúvidas de que não estaria aqui sem eles.
À Dr.a Cristina Silva Gonçalves, pela leitura criteriosa deste texto, pelas sugestões e, principalmente, pelo ensino das técnicas de análise do conteúdo estomacal, fundamentais para este trabalho.
À Profa Dra. Giulianna Rondineli Carmassi, pela correção tão criteriosa desta dissertação.
Ao Prof. Dr. George M. T. Mattox, pela participação na banca de defesa desta dissertação e, principalmente, pela contribuição e sugestões.
Ao Prof. Dr. Francisco Langeani Neto, pela identificação e tombamento dos exemplares capturados.
Ao Prof. Dr. Miguel Petrere Jr., pela sua disposição em ler criteriosamente este trabalho e fazer sugestões, transmitindo sua imensurável bagagem científica. Mas acima de tudo, gostaria de agradecer pelas suas aulas e palestras, sempre instigadoras e insubstituíveis.
Aos companheiros de coleta e laboratório Bruno e Costela (Rodrigo), pelo esforço nas coletas de campo, pela diversão, enfim, pela ajuda mútua. Um dia calcularemos quantos litros de café foram consumidos neste tempo.
Às também companheiras de coletas Fernanda e Bruna, pela ajuda nas coletas de campo e pela companhia nos congressos.
Ao Prof. Dr. Alexander V. Christianini, pelo seu raro senso crítico e conhecimento a nós transmitido com muita dedicação.
Ao Prof. Dr. Fernando Rodrigues da Silva, pelas sugestões e pela participação na banca de qualificação desta dissertação.
A Luciana Kawamura, secretária do PPGDBC, pela disposição e eficiência, ajudando-nos e resolvendo todos os problemas com muita agilidade.
Aos professores do PPGDBC, pela dedicação nas disciplinas, fundamentais em nossa formação.
À UFSCar e ao PPGDBC, pela estrutura de trabalho.
Ao Prof. Dr. Francisco Manoel de Souza Braga, meu orientador de iniciação científica, pela base sólida – em todos os aspectos- na minha formação ainda em curso.
Ao Prof. Dr. Alberto L. Carmassi e a Prof.a Dr.a Giulianna Rondineli Carmassi, sempre presentes nesta ainda pequena trajetória acadêmica.
À dr.a Ursulla P. Souza e ao Dr. Fábio Cop Ferreira, sempre dispostos a ajudar em tudo o que for possível.
RESUMO
do tipo não urbano, o inverso dos onívoros, com 3 espécies exclusivas de riachos do tipo urbano. A partir da classificação trófica, os trechos urbanos e não urbanos foram comparados quanto à estrutura trófica em relação à riqueza, abundância e biomassa. A abundância não foi alterada pela urbanização, no entanto a riqueza e a biomassa diferiram entre os tipos de riacho. A composição do substrato, que foi diferente entre os tipos de riacho, esteve positivamente relacionada com a riqueza de invertívoros/insetívoros, de herbívoros/detritívoros e negativamente relacionada com a biomassa de onívoros. Estes resultados ilustram um processo intrincado de relações entre a disponibilidade de alimentos, plasticidade trófica e hábitos de forrageamento das espécies. Sabe-se que substratos como rochas, galhos e troncos são úteis como superfície de crescimento de algas do perifíton e também como abrigos para macroinvertebrados aquáticos. Desse modo, alterações na composição do substrato podem modificar a disponibilidade de recursos para determinadas espécies, dependentes de algas e invertebrados aquáticos, especialmente insetos imaturos. Os onívoros, por sua vez, podem encontrar outras fontes de recurso devido a sua conhecida plasticidade trófica. De maneira geral, praticamente todas as espécies ausentes dos trechos urbanos possuem alguma especialização trófica e costumam ser dependentes do substrato para o forrageamento. Por outro lado, as espécies que ocorreram apenas nos trechos urbanos são forrageadoras de meia água, não depedentes do substrato e com alta plasticidade na dieta. Esta conclusão foi amparada pela análise da condição corporal de Astyanax fasciatus, um onívoro nectônico que, quando teve descontado o comprimento do corpo, apresentou maior peso médio nos trechos urbanos.
ABSTRACT
stretches. Abundance was not affected by urbanization, whereas richness and biomass varied between stretch groups. Substrate composition differed according to stretch type, and was positively related to invertivores/insectivores and herbivore/detritivores richness, whereas negatively related to omnivore biomass. These results suggest complex relationships between food availability, trophic plasticity and species foraging habits. It is known that coarser substrates such as rocks, branches and trunks are useful as surface for periphyton algae growth as well as shelters for aquatic macroinvertebrates. Thus, changes in substrate may alter resources availability for certain species. Omnivores, in turn, can find other sources of food items due to its trophic plasticity. In general, almost all species absent from urban stretches exhibit some trophic specialization and often depend on heterogeneous substrate for foraging. Moreover, species exclusive to urban stretches are mid-water foragers that do not depend on substrate and present high trophic plasticity. Our conclusions were supported by Astyanax fasciatus body condition analysis, an omnivorous nektonic species which demonstrated higher mean weight in urban stretches, when discounted length.
LISTA DE FIGURAS
CAPÍTULO I
Figure 1. Stretches sampled in the towns of Pilar do Sul (PS) and São Miguel Arcanjo (SMA) (SP). The gray area represents the urban sprawl ……….. 26
Figure 2. Rarefaction for points located in urban and non-urban areas. The middle lines represents the estimated value and the ellipses indicate the confidence interval (CI). U=Urban stretches e NU=Non urban stretches ….. 32
Figure 3. Abundance (interrupted line) and biomass (uninterrupted line) for the species in order of importance in urban (U) and non-urban (NU) stretches ………... 33
Figure 4. Representation of the first two components of the Principal Component Analysis (PCA), with ten sample points and seven environmental variables. Together components 1 and 2 represent 66.85% of the variance. Urban stretches = U and non-urban stretches = NU ……….. 34
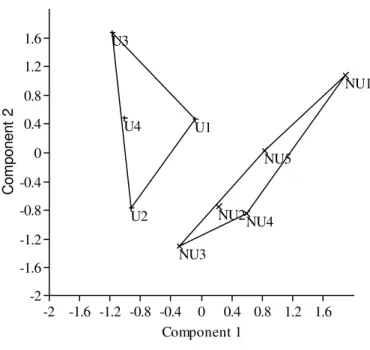
Fig 5. Representation of the first two axes of the Detrended Correspondence Analysis (DCA), drawn from the matrix of species abundance. Urban stretches = U and non-urban stretches = NU ………... 35 Figure 6. Regression between the axis 1 of the PCA, which summarizes the environmental variables, and axis 1 of the the DCA, which represents the assemblage composition of each sample point (r = 0.86, p <0.01) ……... 37
CAPÍTULO II
LISTA DE TABELAS CAPÍTULO I
Table 1. Stream type, municipality (PS = Pilar do Sul, SMA = Sao Miguel Arcanjo) and geographical location of the sampled streams in the upper portion of the Upper Paranapanema River basin ………. 27
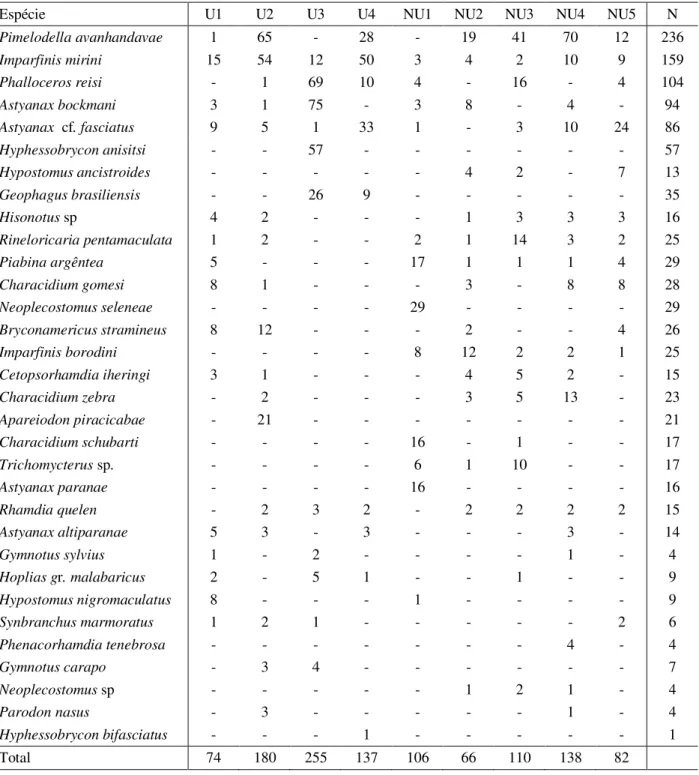
Table 2. Ichthyofauna in order of abundance by sampling stretch. U=Stretches in urban areas, NU=Stretches in non urban areas and N = Abundance ………... 31
Table 3. Shannon diversity (H’), Margalef richness and Pielou evenness (J’) for nine stretches sampled…… 32
Table 4. Environmental descriptors for 4 urban stretches (U) and 5 non urban stretches. MS = margin stability, SV = surrounding vegetation, H’V = velocity diversity, MH = meso-habitats, SUB = substrate, SHA = Shading
………... 33
Table 5. Non parametric multivariated analisys of variance (Permanova) for abundance species matrix of urban and non urban stretches. F= statistical test, TSQ = total sum of squares; WGSQ = within group sum of squares;
P= probability value ………. 35
Table 6. Analysis of percentage of similarity (SIMPER), with mean abundance of each species in urban (U) and non-urban (NU) streams, mean dissimilarity (D), ratio of dissimilarity and standard deviation (D/SD); contribution (% Cont) and accumulated dissimilarity (DA -%) ………... 36
CAPÍTULO II
Tabela 1. Tipo do trecho, município (PS=Pilar do Sul, SMA=São Miguel Arcanjo), e localização geográfica dos riachos amostrados na parte superior da bacia do alto rio Paranapanema ... 53 Tabela 2. Valores de GPA por espécie (MV= Material vegetal; Alg=Algas; Det=Detrito; Inv = Invertebrados; Ins=Insetos; Pei=Peixe), ocorrência em trechos urbanos (U) e não urbanos (NU), categoria trófica das espécies (CT) e número de estômagos analisados (N) ... 58 Tabela 3. Análise de variância multivariada não paramétrica (Permanova) para as categorias tróficas da ictiofauna capturada nos trechos de riachos. F=estatística de teste, SQT=soma dos quadrados totais; SQG= soma dos quadrados dentro dos grupos ... 59 Tabela 4. Análise de variância multivariada não paramétrica (Permanova) para riqueza, abundância e densidade das 5 categorias tróficas encontradas nos trechos de riachos do tipo urbano e não urbano. F=estatística de teste, SQT=soma dos quadrados totais; SQG= soma dos quadrados dentro dos grupos; P= valor exato de probabilidade. * indica valores de p significativos ... 59 Tabela 5. Análise de variância multivariada não paramétrica (Permanova) para composição substrato nos trechos de riachos do tipo urbano e não urbano. F=estatística de teste, SQT=soma dos quadrados totais; SQG= soma dos quadrados dentro dos grupos; P= valor exato de probabilidade. * indica valores de p significativos ... 60 Tabela 6. Relações entre composição do substrato, riqueza e biomassa de três categorias tróficas. r= coeficiente de correlação e p= valor exato da probabilidade. * indica valores de p significativos ... 61 Tabela 7. Análise de covariância (ANCOVA) para o peso total de Astyanax fasciatus. A variável dependente é o
peso total, a covariável é o comprimento total e o fator é o tipo de riacho (urbano ou não urbano). SQ=soma dos quadrados; Gl=graus de liberdade; QM=quadrado médio; F=estatística de teste; P= valor exato de probabilidade; e CT=Comprimento total. * indica valores de p significativos ... 61 Tabela 8. Média, média ajustada e inclinação da reta para o peso total de Astyanax fasciatus, em trechos urbanos
SUMÁRIO
INTRODUÇÃO GERAL... 12
REFERÊNCIAS BIBLIOGRÁFICAS ... 16
CAPÍTULO I ... 21
RESUMO ... 22
ABSTRACT ... ... 23
INTRODUCTION...24
METHODOLOGY...25
Study Area………......25
Data Collection ...25
Data Analysis……….………..29
RESULTS...30
DISCUSSION...37
REFERENCES…………...…41
CAPÍTULO II...47
RESUMO...48
ABSTRACT...49
INTRODUÇÃO...50
METODOLOGIA...52
Área De Estudos...52
Coleta De Dados...52
Análise De Dados...55
RESULTADOS...57
DISCUSSÃO...61
CONCLUSÃO...65
REFERÊNCIAS BIBLIOGRÁFICAS...65
INTRODUÇÃO GERAL
Ecossistemas aquáticos são os ambientes mais ameaçados do mundo pela ação antrópica, sofrendo impactos como poluição química, perda da diversidade de habitats, corte da mata ciliar, barramentos do curso principal, alterações estruturais do canal e introdução de espécies exóticas (Karr & Chu, 2000), que já causaram a extinção de 20% das espécies de água doce (Reis et al., 2003). Este panorama de degradação não é diferente na América do Sul, continente onde a ameaça é constante, devido principalmente à produção de alimentos e geração de energia (Barletta et al., 2010). Tal degradação de habitats aquáticos é especialmente relevante quando considerados os riachos, ambientes cuja ictiofauna tem o alto grau de endemismo como uma de suas características (Buckup, 1999).
Compreender os fatores que determinam a estrutura de uma comunidade é um grande desafio em direção ao entendimento dos efeitos causados pelo impacto humano. De acordo com o conhecimento atual, existem dois tipos de comunidades: aquelas controladas por fundação e as controladas por dominância. A primeira é caracterizada por espécies com grande potencial de colonização e capacidade competitiva semelhante. A segunda, por sua vez, é composta por espécies cuja capacidade de colonização é inversamente proporcional à sua capacidade competitiva, ou seja: sua estrutura é moldada pelas interações bióticas entre as espécies. Comunidades reais, no entanto, dificilmente podem ser alocadas estritamente em uma dessas classificações, sendo mais comum estarem compreendidas em um gradiente entre estes dois tipos (Begon et al., 2007).
Os fatores que regulam a constituição de uma comunidade são, na ordem, restrições de dispersão, restrições ambientais e dinâmicas interespecíficas. Isso significa que uma espécie só será capaz de se manter numa comunidade se ela conseguir alcançar o local, se existirem condições e recursos e se não for eliminada por um predador, competidor ou parasito (Begon et al. 2007).
Para peixes, alguns trabalhos têm apontado relações entre a assembléia e características ambientais em rios tropicais (Lowe-McConnell, 1999; Goulding, 1980). É crescente entre ecólogos a visão de que fatores históricos e regionais, bem como relações bióticas entre as espécies moldam a comunidade local (Hugueny et al., 2010). A estrutura de assembléias de peixes de água doce é determinada por fatores estocásticos e determinísticos (Grossman et al., 1998), cuja influencia de cada um dependente da escala espacial e temporal
do estudo (Jackson et al., 2001). Riachos também estão sujeitos a bruscos pulsos de
inundação (além daqueles sazonais de verão/inverno) que desalojam os organismos aquáticos,
disponibilidade de recursos alimentares e influenciando a intensidade de interações bióticas envolvendo os peixes (Dudgeon, 1993). Como resultado, populações de peixes de riachos estão sujeitas a grandes flutuações. Enquanto sistemas abertos, as assembléias ícticas estão sujeitas a fatores como clima, migração e variações na competição, sendo que em riachos a riqueza de espécies é inversamente proporcional ao distúrbio ambiental sofrido (Oberdorff et al., 2001). Esta relação sugere que a extinção e recolonização são processos importantes na estruturação da assembléia de peixes de riachos (Horwitz, 1979).
Em escalas mais abrangentes, é reconhecido que o papel de fatores determinísticos
sobrepõe os fatores aleatórios (Petry et al., 2003). Em médias elevações, riachos têm uma
geomorfologia bem definida, com poções e corredeiras claramente delimitados e alta diversidade de substratos, de modo que as espécies tendem a estar distribuídas neste gradiente de meso-hábitats. Diversos fatores podem ser apontados como responsáveis pelos padrões de estruturação da assembléia e da riqueza de espécies. Entre os mais consistentes estão a área da bacia, a ordem do riacho, sua largura, elevação, velocidade da água, profundidade, temperatura, condutividade, heterogeneidade de habitats, regime de fluxo de água e ecorregião (Marsh-Matthews & Matthews, 2000; Tejerina-Garro et al., 2005).
Não obstante o nível de distúrbio e a heterogeneidade ambiental, a riqueza também é influenciada pela proximidade do canal principal. Riachos que drenam diretamente para rios maiores possuem mais espécies que outros do mesmo tamanho afluentes em riachos de menor ordem (Agostinho & Penczak, 1995; Pavanelli & Caramaschi, 2003). Suarez et al., (2001) afirmam que a proximidade de ambientes que funcionam como fontes de espécies pode determinar a riqueza, ao passo que a abundancia é determinada pelas características do hábitat.
Uma das metas principais da ecologia é entender os mecanismos que permitem a coexistência de espécies em assembléias (Herder & Freyhoff, 2006), sendo a estrutura trófica um elemento central nesta busca. No entanto, as informações sobre estrutura trófica de peixes de riachos são reduzidas quando comparadas a informação existente para grandes rios e represas (Esteves & Aranha, 1999).
(Esteves & Aranha, 1999), a ausência de especialização alimentar pode ser encontrada, como verificado por Lowe McConnell (1999).
Há ampla menção na literatura acerca de preferência de peixes de riachos por itens alimentares alóctones (Mazzoni et al., 2010; Herder & Freyhof, 2006; Casatti, 2002). No entanto, não são raros os estudos que relatam preferência por itens autóctones (Casatti et al., 2003; Ferreira, 2007). De fato, a dieta dos peixes é bastante plástica (Lowe-McConnell, 1999; Abelha et al., 2001), e os itens consumidos variam de acordo com a disponibilidade (Gomieiro & Braga, 2008), que por sua vez depende das flutuações ambientais (Esteves & Aranha, 1999). Em geral, insetos terrestres são recursos bastante importantes para peixes em riachos (Deus & Petrere Junior, 2003; Lowe McConnell, 1999). Outros invertebrados como moluscos e crustáceos também são freqüentes na dieta desses peixes. O perifíton constitui uma fonte importante de recursos, havendo inclusive espécies especializadas neste tipo de dieta. O consumo de material vegetal oriundo de plantas vasculares terrestres também é comum, embora poucas espécies tenham como hábito consumir tecidos não reprodutivos, que geralmente são consumidos na forma de detritos. Peixes de hábito alimentar piscívoro frequentemente estão presentes, embora menos abundantes (Winemiller et al., 2008).
As cadeias tróficas de riachos tem geralmente três ou quatro níveis tróficos (Winemilller & Pianka, 1990). Os grupos tróficos mais comuns são os consumidores de insetos aquáticos, insetívoros generalistas, pastadores de algas, onívoros, herbívoros consumidores de material vegetal alóctone e piscívoros (Angermeier & Karr, 1983).
Independente da preferência dos peixes, a cadeia alimentar em riachos parece depender de recursos alóctones. Como são ambientes com baixa produção primária (Allan, 1995) este aporte é importante não apenas para o consumo direto dos peixes, mas também constitui, direta ou indiretamente, fonte de alimento aos invertebrados aquáticos, formando a base da cadeia alimentar (Walker et al., 1990). Considerando tal dependência dos riachos em relação aos itens alóctones, provenientes em grande parte da mata ripária, o desmatamento pode impactar seriamente a ictiofauna (Bojsen & Barriga, 2002; Lowe McConnell, 1999; Lorion & Keneddy, 2009), dado que as características do entorno alteram a disponibilidade de alimento (Silva et al., 2012).
Phillip, 2001). A diversidade de espécies é maior em ambientes não alterados, porque além de apresentarem maior disponibilidade de habitats, também há menor variação das condições ambientais (Wichert & Rapport, 1998) e maior de disponibilidade de alimento para os peixes, tal qual insetos aquáticos (Winemiller et al., 2008).
Os impactos mais comuns da urbanização são modificações do canal e das margens, fragmentação do habitat por barramentos, regulação do fluxo e poluição química e orgânica da água (Tejerina- Garro et al., 2005). Consequentemente, à medida que a influência antrópica aumenta, as espécies mais sensíveis tendem a desaparecer e a estrutura trófica é simplificada (Casatti et al., 2012). Assim, no caso de grandes impactos no ambiente, a tendência é que permaneçam as espécies mais tolerantes e as exóticas passem a representar a maioria dos indivíduos da ictiofauna (Lyons et al., 1995). Entre os vetores de impacto gerados pela urbanização, a degradação da vegetação ripária merece atenção especial. Sua remoção altera a velocidade de deslocamento da água da chuva para o riacho, resultando em aumento da erosão no entorno e consequente sedimentação no canal. Este processo elimina sítios importantes de alimentação e desova (Casatti et al., 2006) e pode inclusive afetar a fisiologia dos peixes, devido aos efeitos da matéria particulada nas brânquias (Mol & Ouboter, 2004; Wantzen, 2006). Aumento da incidência de luz, de temperatura (Biggs et al., 2005; Neill et al., 2001), perda de fontes alóctones de energia e de componentes estruturais como galhos, que mantém a heterogeneidade do canal, também são conseqüências negativas do desmatamento de entorno. Esta perda de fontes alóctones de energia é especialmente preocupante quando se considera que muitos riachos são sistemas heterotróficos e dependentes de fontes externas de energia. O aumento da incidência de luz somado à dimnuição na quantidade de recursos alóctones provoca mudanças na cadeia alimentar, que passa a ser baseada em algas (Ramirez et al., 2008).
mais abundantes pertencem a quatro categorias tróficas: onívoros nectônicos, invertívoros bentônicos, perifitívoros e onívoros bentônicos. Cetra et. al. (2012) coletaram 28 espécies em 8 trechos do alto Paranapanema e Cionek et al. (2012) registrarram 10 espécies em riachos de primeira ordem. Em todos os levantamentos predominam os Characiformes e Siluriformes, seguidos por Gymnotiformes, Perciformes, Cyprinodontiformes e Synbranchiformes. Nesta bacia, ainda são comuns as espécies não descritas taxonomicamente, sendo que Castro et al., (2003) registraram 8 espécies não descritas em um total de 52 espécies coletadas.
Entender os efeitos de pequena e grande escala nas condições abióticas é fundamental para uma compreensão mais completa da ecologia do ecossistema e, por sua vez, para o estabelecimento de um manejo efetivo (Barletta et al., 2008). No mais, estratégias de conservação bem sucedidas requerem uma compreensão clara dos fatores socioeconômicos atuando como forças de degradação, bem como das respostas dos ecossistemas a essas forças (Ramirez et al., 2008). Por isso, neste estudo pretendemos verificar as alterações provocadas pela urbanização na estrutura e composição das assembléias, na dieta, na estrutura trófica e na condição corporal da ictiofauna.
REFERÊNCIAS BIBLIOGRÁFICAS
Abelha, M.C.F., Agostinho, A.A. & Goulart, E. 2001. Plasticidade trófica em peixes de água doce. Acta Scientiarum, 23:425-434.
Agostinho, A.A., & Penczak, T. 1995. Populations and production of fish in two small tributaries of the Paraná River, Paraná, Brazil. Hydrobiologia 312:153–166.
Allan, J. D. 1995. Stream Ecology: structure and function of running water. New York: Chapman & Hall.
Angermeier, P. L. & Karr, J. R. 1983. Fish communities along environmental gradients in a system of tropical streams. Environmental Biology of Fishes, 9(2):117-35.
Barletta M., A.J. Jaureguizar, C. Baigun, N.F. Fontoura, A.A. Agostinho, V.M.F. Almeida-Val, A.L. Almeida-Val, R.A. Torres, L.F. Jimenes-Segura, T. Giarrizzo, N.N. Fabré, V.S. Batista, C. Lasso, D.C. Taphorn, M.F. Costa, P.T. Chaves, J.P. Vieira, M.F.M. Corrêa. 2010. Fish and aquatic habitat conservation in South America: a continental overview with emphasis on Neotropical systems. Journal of Fish Biology 76: 2118–2176.
Begon, M, Towsend, C.R., Harper, J. 2007. Ecologia: de indivíduos a ecossistemas. ArtMed, Porto Alegre, 4ed, 752 p.
Biggs, T. W., T. Dunne & L.A. Martinelli. 2005. Natural controls and human impacts on stream nutrient concentrations in a deforested region of the Brazilian Amazon basin. Biogeochemistry,68:227–257.
Bojsen, B. H., & Barriga, R. 2002. Effects of deforestation on fish community structure in Ecuadorian Amazon streams. Freshwater Biology, 47:2246–2260, 2002.
Buckup, P. A. 1999. Sistemática e biogeografia de peixes de riachos, Pp 91-138. Em: Caramaschi, E. P.; R. Mazzoni & P.R. Peres-Neto. Ecologia de peixes de riachos. Série Oecologia Brasiliensis, v.VI, PPGE-UFRJ. Rio de Janeiro, Brasil.
Casatti, L., F.B. Teresa, T. Gonçalves-Souza, E. Bessa, A.R. Manzotti, C.S. Gonçalves & J.O. Zeni. 2012. From forests to cattail: how does the riparian zone influence stream fish? Neotropical Ichthyology, 10(1):205-214.
Casatti, L., H.F. Mendes & K.M. Ferreira. 2003. Aquatic Macrophytes As Feeding Site For Small Fishes In The Rosana Reservoir, Paranapanema River, Southeastern Brazilian Journal of Biology, 63(2):213-222.
Casatti, L. 2002. Alimentação dos peixes em um riacho do Parque Estadual Morro do Diabo, Bacia do Alto Rio Paraná, sudeste do Brasil. Biota Neotropica, 2:1-14.
Castro, R.M.C., L. Casatti, H.F. Santos, K.M. Ferreira, A.C. Ribeiro, R.C. Benine, G.Z.P. Dardis, A.L.A. Melo, R. Stopoglia, T.X. Abreu, F.A. Bockmann, M. Carvalho, F.Z. Gibran and F.C.T. Lima. 2003. Estrutura e Composição da ictiofauna de riachos do rio Paranapanema, Sudeste e Sul do Brasil. Biota Neotropica 3(1):1-31.
Cetra M., W. Barrella, F. Langeani Neto, A.G. Martins, B.J. Mello and R.S. Almeida. 2012. Fish fauna of headwater streams that cross the Atlantic Forest of south São Paulo state. Check List 8(3):421-425.
Cionek, V.M., P.A. Sacramento, N. Zanatta, R.P. Ota, D.F. Corbetta & E. Benedito. 2012. Fishes from first order streams of lower Paranapanema and Ivaí rivers, upper Paraná River basin, Paraná, Brazil. Check List, 8(6):1158–1162.
Deus, C. P. & M. Petrere-Junior. 2003. Seazonal diet shifts of seven fish species in an atlantic rainforest stream in southeastern Brazil. Brazilian Journal of Biology, 63(4):579-588.
de Riachos: Estado Atual e Perspectivas. Rio de Janeiro, PPGEUFRJ, Oecologia Brasiliensis, VI.
Ferreira, K.M. 2007. Biology and ecomorphology of stream fishes from the rio Mogi-Guaçu basin, Southeastern Brazil. Neotropical Ichthyology, 5(3):311-326.
Gomiero, L. M. & F.M.S. Braga. 2008. Feeding habits of the ichthyofauna in a protected area in the state of São Paulo, southeastern Brazil. Biota Neotropica, 8(1). Disponível em: <http://www.biotaneotropica.org.br/v8n1/en/abstract?article+bn00608012008>.
Goulding, M. 1980. The fishes and the forest: explorations in Amazon natural history. University of California Press, Berkeley, 280 p.
Grossman, G.D., R.E. Ratajczak, M. Crawford & M.C. Freeman. 1998. Assemblage organization in stream fishes: Effects of environmental variation and interspecific interactions. Ecological Monographs, 68: 395–420.
Herder, F. & Freyhoff, J. 2006. Resource particional in a tropical fish assemblage. Journal of Fish Biology, 69:571–589.
Horwitz, R.J. 1979. Temporal variability patterns and distributional patterns of stream fishes. Ecological Monographs, 48:307-321.
Hugueny, B.; T. Oberdorff and P.A. Tedescco. 2010. Community Ecology of River Fishes: A Large-Scale Perspective, Pp. 1–34. Em: D. A. Jackson and K. B. Gido. Community ecology of stream fishes: concepts, approaches, and techniques. American Fisheries Society, Symposium 73, Bethesda, Maryland.
Jackson, D.A., P.R. Peres-Neto & J.D. Olden. 2001. What controls who is where in freshwater fish communities – the roles of biotic, abiotic, and spatial factors. Canadiam Journal of Fisheries and Aquatic Sciences, 58:157–170.
Karr, J.R. & E.W. Chu. 2000. Susteining living Rivers. Hydrobiologia, 422/423:1–14.
Langeani, F., R.M.C. Castro, O.T. Oyakawa, O.A. Shibatta, C.S. Pavanell & L. Casatti. 2007. Ichthyofauna diversity of the upper rio Paraná: present composition and future perspectives.
Biota Neotropica, 7(3). Disponível em:
http://www.biotaneotropica.org.br/v7n3/pt/abstract?article+bn03407032007.
Lévêque, C., T. Oberdorff, D. Paugy, M.L.J. Stiassny & P.A. Tedesco. 2008. Global diversity of fish (PISCES) in freshwater. Hydrobiologia, 595:545-567.
Lorion, C. M. & B.P. Kennedy. 2009. Riparian forest buffers mitigate the effects of deforestation on fish assemblages in tropical headwater streams. Ecological Applications, 19(2):468–479.
Lowe-Mcconnell, R. H. 1999. Estudos ecológicos em comunidades de peixes tropicais. São Paulo: Editora USP, 535p.
Lyons, J., S. Navarro-Pérez, P.A. Cochran, C. Santana & M. Guzmán-Arroyo. 1995. Index of biotic integrity based on fish assemblages for the conservation of streams and rivers in west-central México. Conservation Biology, 9(3):569-584.
Magurran, A. E. & D.A.T. Phillip. 2001. Implications of species loss in freshwater fish assemblages. Ecography, 24(6):645-650.
Marsh-Matthews E. & W.J. Matthews. 2000. Geographic, terrestrial and aquatic factors: which most influence the structure of stream fish assemblages in the midwestern United States? Ecology of Freshwater Fish, 9: 9–21.
Mazzoni, R., L.L. Nery & R. Iglesias-Rios. 2010. Ecologia e ontogenia da alimentação de Astyanax janeiroensis (Osteichthyes, Characidae) de um riacho costeiro do Sudeste do Brasil. Biota Neotropica, 10(3):53-60.
Mol, J. H., & P.E. Ouboter. 2004. Downstream effects of erosion from small-scale gold mining on the instream habitat and fish community of a small Neotropical rainforest stream. Conservation Biology,18:201–214.
Neill, C., L.A. Deegan, S.M. Thomas & C.C. Cerri. 2001. Deforestation for pasture alters nitrogen and phosphorus in small Amazonian streams. Ecological Applications, 11:1817–
1828.
Oberdorff, T., B. Hugueny, A. Compin & D. Belkessam. 1998. Non-interactive fish communities in the coastal streams of northwestern France. Journal of animal ecology, 67:472-484.
Oyakawa, O.T. & N.A. Menezes. 2011. Checklist dos peixes de água doce do Estado de São
Paulo, Brasil. Biota Neotropica, 11(1a): Disponível em:
http://www.biotaneotropica.org.br/v11n1a/pt/abstract?inventory+bn0021101a2011.
Pavanelli, C.S. & E.P. Caramaschi. 2003. Temporal and spatial distribution of the ichthyofauna in two streams of the Upper Rio Paraná Basin. Brazilian Archives of Biology and Technology, 46:271–280.
Power M.E. 1983. Grazing responses of a tropical freshwater fishes to different scales of variation in their food. Environmental Biology of Fishes, 9(2):103-115.
Ramírez, A., C.M. Pringle & K.M. Wantzen. 2008. Tropical stream conservation, Pp 285-300. Em: Dudgeon, D. (Ed.). Tropical Stream Ecology. Amsterdan, Academic Press, 370p. Reis, R. E., S. O. Kullander & C. J. Ferraris, Jr. (eds.). 2003. Check list of the freshwater fishes of South and Central America. Editora da Pontifícia Universidade Católica do Rio Grande do Sul, Porto Alegre, Brasil.
Silva, J.C., R.L. Delariva & K.O. Bonato. 2012. Food-resource partitioning among fish species from a first-order stream in northwestern Paraná, Brazil, Neotropichal Ichthyology, 10(2).
Suarèz, Y.M., M. Petrere Jr. & A.C. Catella. 2001. Factors determining the structure of Fish communities in Pantanal lagoons (MS, Brazil). Fisheries Management and Ecology, 8:173-186.
Tejerina-Garro, F.L, M. Maldonado, C. Ibañez, D. Pont, N. Roset & T. Oberdorff. 2005. Effects of Natural and Anthropogenic Environmental Changes on Riverine Fish Assemblages: a Framework for Ecological Assessment of Rivers. Brasilian Archives of Biology and Technology, 48(1):91-108.
Walker I., P. Henderson & P. Sterry. 1990. On the patterns of biomass transfer of the benthic fauna in a Amazonian blackwater river, as evidencied by P32 label experiment. Hydrobiologia, 12:23-34.
Wantzen, K.M. 2006. Physical pollution: effects of gully erosion in a tropical clear-water stream. Aquatic Conservation 16, 733–749.
Wichert, G. A. & D.J. Rapport. 1998. Fish community structure as a mesure of degradation and rehabilitation of riparian systems in an agricultural drainage basin. Environmental Management, 22(3):425-443.
Winemiller, K. O., A.A. Agostinho & E.P. Caramaschi. 2008. Fish ecology in tropical streams. Pp. 336-346, 2008. In: Dudgeon, D. (Ed.). Tropical Stream Ecology. Amsterdan, Academic Press, 370p.
Winemiller, K.O. & E.R. Pianka. 1990. Organization in natural assemblages of desert lizards and tropical fishes. Ecologycal Monographs, 60, 27–55, 1990.
CAPÍTULO I
RESPONSES OF THE ICHTHYOFAUNA TO
URBANIZATION IN STREAMS OF THE UPPER
PARANAPANEMA RIVER BASIN (STATE OF SÃO
PAULO, BRAZIL)
RESUMO
O foco de manejo de cursos d´água tem sido a poluição química, no entanto, é conhecido que alterações estruturais de habitat podem representar sérias conseqüências para a ictiofauna. Neste trabalho buscamos avaliar impactos da urbanização, comparando as características ambientais dos riachos, a estrutura e composição da ictiofauna. Utilizamos para isso quatro trechos amostrais localizados em áreas urbanas e seis em áreas não urbanas, situados na parte superior da bacia do alto rio Paranapanema. Utilizando as variáveis ambientais, os trechos foram ordenados no sentido urbanizado - não urbanizado, sendo que estes últimos apresentaram valores maiores de sombreamento, área, substrato e vegetação de entorno. A estrutura da ictiofauna, representada por índices de diversidade, riqueza e equabilidade, bem como a relação entre abundância e biomassa (curva ABC) não diferiram entre os tipos de riacho. No entanto, a composição da ictiofauna foi diferente e a riqueza estimada com base nas espécies raras foi maior em riachos não urbanos. Estes resultados ilustram um processo de substituição de espécies em assembleias sujeitas a alterações ambientais, no qual diversas espécies mais exigentes quanto ao habitat são substituídas por outras mais tolerantes, mantendo a estrutura semelhante, porém alterando a composição. De maneira geral, a resposta de cada espécie esteve relacionada com os hábitos de forrageamento e plasticidade trófica.
ABSTRACT
Management of water courses has traditionally focused on chemical pollution. However, it is known that structural changes to habitats can pose serious consequences to the ichthyofauna. In this study, we sought to evaluate the impact of urbanization by comparing the environmental characteristics of streams and structure and composition of the ichthyofauna. For this, we sampled four sections of the upper Paranapanema River basin located in urban areas and six located in non-urban areas. Using environmental variables, the sections were ordered from urbanized to non-urbanized, which showed greater values of shading, area, substrate and surrounding vegetation. The structure of the ichthyofauna, represented by indices of diversity, richness and evenness, as well as the relationship between abundance and biomass (ABC curve) did not differ between areas. However, the composition of the ichthyofauna was different and the estimated richness was higher in non-urban streams. These results illustrate a common process in fish assemblages subjected to environmental changes, in which several of the more demanding species with regard to habitat are replaced by more tolerant ones, maintaining a similar structure but changing its composition. In general, the species responses were dependent on their trophic plasticity and foraging habitats.
INTRODUCTION
Despite progress in controlling pollution, the quality of aquatic ecosystems continues to decline (Karr & Chu, 2000). Part of the problem lies in the fact that the management of water courses is still related to chemical quality (Karr, 1995). Considering the strong relationship between the biodiversity of a stream and the availability of habitats (Casatti et al., 2006b; Rodriguez & Lewis, 1997), this view does not guarantee the maintenance of aquatic life (Falkenmark, 1997).
There is general consensus that, at wider scales, the structure of fish assemblages is related to a gradient of structural habitat characteristics (Hugueny et al., 2010; Winemiller et al., 2008). Among the important non-random factors that structure fish assemblages are species-habitat affinity, habitat dependent survival and species-specific interactions (Hoeinghaus et al., 2003, Gorman & Karr, 1978). Differences in tolerance to hypoxia (Winemiller, 1996), water velocity (Toham & Teugels, 1997), substrate composition (Gorman & Karr, 1978; Matheson & Brooks, 1983), predation mediated by water transparency (Rodriguez & Lewis 1997; Angermeier & Karr 1983), competition (Hoeinghaus et al., 2007) and sets of water chemical variables (Mathews, 1998) can influence the abundance and distribution of species. Additionally, habitat selection by fish also depends on sex, age, reproductive status and geographical area (Karr et al., 1986).
Anthropic interference can modify the hydrological patterns of the basin (Ward, 1998) and the physical characteristics of the aquatic environment (Karr, 1981) in several ways. The elimination of the surrounding natural environment alters the availability of micro-habitats, by removing those that serve as shelter from predators as well as feeding and spawning sites (Casatti et al., 2006b; Ferreira & Casatti, 2006). Changes in the surrounding environment can result in indirect consequences, such as simplification of the structure of the channel due to sedimentation, as well as an increase in temperature and primary production due to greater light incidence (Lorion & Kennedy, 2009; Pusey & Arthington, 2003). Anthropic activity can cause fragmentation of natural habitats, which depending on the environment can result in the formation of fish meta-populations (Cetra & Petrere, 2006).
this need, most of the information available comes from temperate streams (Cunico et al., 2012). Thus, in view of the need for understanding the responses of fish assemblages to anthropic impact, this study seeks to answer the following question: Does the structure and composition of assemblages differ between urban and non-urban streams?
METHODOLOGY
Study Area
All streams sampled belong to the upper portion of the Upper Paranapanema River basin, located in the southwestern portion of the state of São Paulo. This region is bounded to the north by the Middle Paranapanema River basin, to the northeast by the Middle Tietê/Sorocaba River and to the south by the basins of the Iguape River and the Eastern Coastal Basins.
The sample stretches are located in Pilar do Sul and São Miguel Arcanjo (SP). In 2008, the population of Pilar do Sul was 27,758 inhabitants and of São Miguel Arcanjo, 35,277, with urbanization rates of 77% and 64.27%, respectively (CBH-ALPA, 2003, 2008). Both towns now treat 100% of the sewage collected, and the collection rate in 2006 was 97% for the former and 92% for the latter (CETESB, 2006).
Outside the urban areas, there was a predominance of natural vegetation and agricultural activities, mainly pastures formed by Brachiaria sp. and reforestation by Eucalyptus spp. The natural vegetation covers 15% of the area of the basin, includes fragments of semideciduous tropical forest, cerrado and lowland forests (CBH-ALPA, 2003, 2008).
Data Collection
Environmental variables
the software Google Earth) (Table 1, Fig 1). We ensured there is no urban area up to the non urban stretches. The sampled stretches extended along a gradient of variation in environmental characteristics, with diverse types of substrate, structural composition of the margins and meso-habitats. Aiming to control the size effect, we tested the depth and width between urban and non urban streams and they were equally large and deep (p= 0.529).
Table 1. Stream type, municipality (PS = Pilar do Sul, SMA = Sao Miguel Arcanjo) and geographical location of the sampled streams in the upper portion of the Upper Paranapanema River basin.
Stretch Stream Type Municipality Latitude Longitude U1 Ribeirão do Pilar Urban OS 23S 48' 48" 47W 42' 25" U2 Ribeirão do Pilar Urban OS 23S 48' 30" 47W 42' 59" U3 Córrego do Campo Grande Urban OS 23S 49' 07" 47W 44' 10" U4 Ribeirão São Miguel Arcanjo Urban SMA 23S 52' 26" 47W 59' 17" NU1 Ribeirão Taquaral Non Urban SMA 24S 04' 20" 47W 59' 52" NU2 Rio Clarinho Non Urban OS 23S 53' 21" 47W 42' 44" NU3 Rio Claro Grande Non Urban OS 23S 53' 21" 47W 42' 44" NU4 Rio Pinhal Non Urban OS 23S 53' 18" 47W 46' 12" NU5 Ribeirão Taquaral Non Urban SMA 23S 59' 44" 48W 00' 41"
The samples were collected in 70 meter stretches, a distance that is sufficient for representing the environmental variability of the streams. In each stretch, data was collected along three cross-sections at 10, 35 and 60 meters. In each of these sections, the width (m) was measured and, at every one meter, measurements were taken of the depth (cm) and velocity (m/s) with a mechanical flow meter (General Oceanics ® model 2030) submerged for 30 seconds. Similarly, a 1m2 frame was positioned at every one meter, within which the composition of the substrate was evaluated. The procedure was performed by assigning a value of 1 to 4 for each category of substrate, where 1 corresponds to up to 24%, 2 to 25-49%, 3 to 50-74%, and 4 to over 75%. The substrate types were classified as: a) branches or stems, leaves and silt (<0.6 mm); b) sand (0.6 - 2 mm); c) gravel (6-16 mm); d) pebble (16 - 64 mm); e) boulder (64 - 265 mm); and f) block (> 265 mm). The variable substrate (SUB) was calculated from the weighted average of the substrates pebble, boulder and block. This procedure was adopted because these categories of substrate provide shelter for the fish and promote greater environmental heterogeneity (Casatti et al., 2006).
The depth and velocity data were combined to form a single variable, the diversity
index of velocity (H’V). The index was calculated from the number of observations allocated
vegetation, roots, trunks, rocks, gully and bare soil. From the sum of the values attributed to the presence of rocks, roots, vegetation and logs a weighted mean was calculated, generating the variable stability of margins (EM).
To assess the surrounding vegetation cover, estimates were made of the amount of arboreal vegetation at a distance of 30 meters from the margins. This estimate was made according to the following scale: 0-25%, 26-50%, 51-75% and over 76%. Following this same scale, shading on each side of the stretch was estimated. The variable shading (SOMB) was calculated from the weighted mean of the measurements.
The meso-habitats pools, riffles and runs (Harding et al. 2009) were counted and measured for width (m) and length (m). Considering that the greater the percentage of rapids, the lower the heterogeneity of the sampled stretch, the variable meso-habitats (MH) was obtained from the sum of the ratio of riffles and pools. By multiplying the mean width by the length, the variable area was obtained.
Ichthyofauna
Considering that seasonal fluctuation of the water level is one of the most important factors to influence the structure of fish assemblages (Rodriguez & Lewis, 1997), the dry season was defined as the sampling period for the ichthyofauna (License number 13352-1 SISBIO/ IBAMA/MMA). During this period, connections between the structure of the fish assemblage and the habitat structure are more robust, and the effect of temporal variation can be controlled (Willis et al., 2005). Sampling is also more efficient due to the smaller volume of water and consequent increase in the density of fish (Pease et al., 2012). Sampling was performed with an electrofishing apparatus, between 8h and 17h in the same stretches characterized for physical structure and surrounding vegetation. The apparatus consists of a transformer supplied by a generator (Toyama 2000W) connected to two dip nets, that in the water release a continuous current (2A). The capture was made by two individuals dipping the nets in a single upstream-downstream movement (Cetra et al., 2009).
Data analysis
To test the hypothesis that the assemblage structure differs between types of streams, the following indices were calculated: Margalef species richness (MG), Shannon diversity
(H’) and Pielou’s evenness (P’). Subsequently, the “Student t test” was applied (R Development Core Team, 2008). The richness of each type of stream was obtained using the estimator "Chao2" (Ŝ) (Hammer et al., 2001). This is a nonparametric estimator based on species that occur in only one or two sample units, here considered rare taking into account the definition by Cao et al. (1998). Moreover, to compare the richness of the urban and non-urban areas, the rarefaction technique was applied to estimate the richness for the same number of individuals when samples have different abundances (Magurran, 2011).
From the abundance and mass data, ABC curves were developed for urban and non-urban ichthyofauna. This graph shows the cumulative percentage of numerical abundance and mass abundance in the y axis and a species “ranking” on the x axis, in logarithmic scale. The
relationship between the resulting curves may be useful in the interpretation of the degree of disturbance (Magurran, 2011). The relationship between the curves can be summarized by the statistic W, the value of which ranges from -1 to 1. If the numerical abundance curve is positioned above the mass abundance curve, the value of W is negative (Magurran, 2011).
The environmental characteristics of each stretch were summarized using the Principal Components Analysis (PCA) performed from the correlation matrix. The resulting axes of the PCA retained for interpretation were determined using the Broken-stick method (Hammer et al., 2001).
RESULTS
Table 2. Ichthyofauna in order of abundance by sampling stretch. U=Stretches in urban areas, NU=Stretches in non urban areas and N = Abundance.
Espécie U1 U2 U3 U4 NU1 NU2 NU3 NU4 NU5 N
Pimelodella avanhandavae 1 65 - 28 - 19 41 70 12 236
Imparfinis mirini 15 54 12 50 3 4 2 10 9 159
Phalloceros reisi - 1 69 10 4 - 16 - 4 104
Astyanax bockmani 3 1 75 - 3 8 - 4 - 94
Astyanax cf. fasciatus 9 5 1 33 1 - 3 10 24 86
Hyphessobrycon anisitsi - - 57 - - - 57
Hypostomus ancistroides - - - 4 2 - 7 13
Geophagus brasiliensis - - 26 9 - - - 35
Hisonotus sp 4 2 - - - 1 3 3 3 16
Rineloricaria pentamaculata 1 2 - - 2 1 14 3 2 25
Piabina argêntea 5 - - - 17 1 1 1 4 29
Characidium gomesi 8 1 - - - 3 - 8 8 28
Neoplecostomus seleneae - - - - 29 - - - - 29
Bryconamericus stramineus 8 12 - - - 2 - - 4 26
Imparfinis borodini - - - - 8 12 2 2 1 25
Cetopsorhamdia iheringi 3 1 - - - 4 5 2 - 15
Characidium zebra - 2 - - - 3 5 13 - 23
Apareiodon piracicabae - 21 - - - 21
Characidium schubarti - - - - 16 - 1 - - 17
Trichomycterus sp. - - - - 6 1 10 - - 17
Astyanax paranae - - - - 16 - - - - 16
Rhamdia quelen - 2 3 2 - 2 2 2 2 15
Astyanax altiparanae 5 3 - 3 - - - 3 - 14
Gymnotus sylvius 1 - 2 - - - - 1 - 4
Hoplias gr. malabaricus 2 - 5 1 - - 1 - - 9
Hypostomus nigromaculatus 8 - - - 1 - - - - 9
Synbranchus marmoratus 1 2 1 - - - 2 6
Phenacorhamdia tenebrosa - - - 4 - 4
Gymnotus carapo - 3 4 - - - 7
Neoplecostomus sp - - - 1 2 1 - 4
Parodon nasus - 3 - - - 1 - 4
Hyphessobrycon bifasciatus - - - 1 - - - 1
Total 74 180 255 137 106 66 110 138 82
Table 3. Shannon diversity (H’), Margalef richness and Pielou evenness (J’) for nine stretches sampled.
Stretch H' Mg J'
U1 2.41 3.25 0.89
U2 1.83 3.08 0.65
U3 1.70 1.80 0.71
U4 1.62 1.63 0.74
NU1 2.06 2.36 0.83
NU2 2.24 3.34 0.83
NU3 2.10 3.19 0.76
NU4 1.89 3.25 0.67
NU5 2.21 2.72 0.86
The estimated number of species was lower in urban stretches (Ŝ=26; s2=0.875) compared to non-urban stretches (Ŝ=39; s2=4.5). For an equal number of individuals (N = 501), the non-urban area had higher species richness (Urban=23, s2 =0.51; Non-Urban=27, s2=0.09) (Fig 2).
Fig2. Rarefaction for points located in urban and non-urban areas. The middle lines represents the estimated value and the ellipses indicate the confidence interval (CI). U=Urban stretches e NU=Non urban stretches.
The cumulative proportion of species in order of importance in both types of stream showed the same pattern, with mass values slightly higher than the number of individuals.
The statistical values of W were positive and close to zero for both types of stream, supporting this conclusion (Fig. 3).
Fig3. Abundance (interrupted line) and biomass (uninterrupted line) for the species in order of importance in urban (U) and non-urban (NU) stretches.
The first axis of the PCA, the only one retained for interpretation because of the broken-stick value, explained 48.89% of the total variance of the environmental variables. In fact, the urban and non-urban points were visually segregated by this axis, with the urban group exhibiting lower values than the non-urban group (Table 4, Fig 4). The most important factors in the composition of this axis were shade (r = 0.89), area (r = 0.86), substrate (r = 0.85), surrounding vegetation (r = 0.82), margin stability (r = 0.65), velocity diversity (r = - 0.23) and meso-habitats (r = -0.10).
Table 4. Environmental descriptors for 4 urban stretches (U) and 5 non urban stretches. MS = margin stability,
SV = surrounding vegetation, H’V = velocity diversity, MH = meso-habitats, SUB = substrate, SHA = Shading.
Stretch MS SV H'V MH SUB Area SHA
U1 0.47 0.54 0.60 0.30 0.38 24500.00 1.20
U2 0.15 0 1.06 0.11 0.39 20766.67 0.60
U3 0.80 0.05 1.01 0.50 0 14933.33 0.60
U4 0.10 0 1.05 0.55 0.31 24266.67 0.80
NU1 1.00 1.00 1.00 0.40 0.70 73733.33 1.70
NU2 0.50 0.22 0.98 0.04 0.59 32666.67 1.20
NU3 0.13 0 0.65 0 0.46 35466.67 1.20
NU4 0.73 0.05 1.29 0 0.60 65566.67 1.00
NU5 0.63 0.67 0.99 0.14 0.57 34766.67 1.60
0 0.2 0.4 0.6 0.8 1 1.2
1 10 100
U W=0,0002 0 0.2 0.4 0.6 0.8 1 1.2
1 10 100
NU
Fig4. Representation of the first two components of the Principal Component Analysis (PCA), with ten sample points and seven environmental variables. Together components 1 and 2 represent 66.85% of the variance. Urban stretches = U and non-urban stretches = NU.
The two groups of treatments are clearly segregated by the axis 1 of the DCA, with urban and non-urban points forming two distinct groups (Fig 5). The hypothesis test confirmed the segregation (Table 5). The dissimilarity between these groups was 74.41%. The species that most contributed to the segregation between urban and non-urban areas were P. avanhadavae, I. mirini, P. reisi, A. bockmani, A. fasciatus, Hyphessobrycon anisitisi, G. brasiliensis, Neoplecostomus selenae, I. borodini e B. stramineus. Of these, only P.
avanhandavae was slightly more abundant in the non-urban area and I. borodini and N. selenae occurred exclusively in non urban stretches. The others were more abundant in urban streams. Species of the genus Characidium, family Loricariidae (Hisonotus sp. and R. pentamaculata), P. argentea and C. iheringi were more abundant in non-urban streams (Table 6). U1 U2 U3 U4 NU1 NU2 NU3 NU4 NU5
Fig5. Representation of the first two axes of the Detrended Correspondence Analysis (DCA), drawn from the matrix of species abundance. Urban stretches = U and non-urban stretches = NU.
Table 5. Non parametric multivariated analisys of variance (Permanova) for abundance species matrix of urban and non urban stretches. F= statistical test, TSQ = total sum of squares; WGSQ = within group sum of squares; P= probability value.
F TSQ WGSQ P
Stretch type 2.017 1.576 1.223 0.0191
U1 U2 U3
U4 NU1
NU2NU3 NU4
NU5
0 0.4 0.8 1.2 1.6 2 2.4 2.8 3.2 3.6 4
Axis 1 -0.9
-0.6 -0.3 0 0.3 0.6 0.9 1.2 1.5 1.8
A
x
is
Table 6. Analysis of percentage of similarity (SIMPER), with mean abundance of each species in urban (U) and non-urban (NU) streams, mean dissimilarity (D), ratio of dissimilarity and standard deviation (D/SD);
contribution (% Cont) and accumulated dissimilarity (DA -%).
Species U NU D D/SD Cont. DA
Pimelodella avanhandavae 23.5 28.4 11.43 1.31 15.36 15.36
Imparfinis mirini 32.75 5.6 10.94 1.39 14.7 30.06
Phalloceros reisi 20 4.8 6.43 0.88 8.64 38.7
Astyanax bockmanni 19.75 3 6.06 0.71 8.14 46.84
Astyanax cf. fasciatus 12 7.6 5.06 1.05 6.8 53.64
Hyphessobrycon anisitisi 14.25 0 4.03 0.56 5.41 59.05
Geophagus brasiliensis 8.75 0 2.8 0.89 3.76 62.81
Neoplecostomus selenae 0 5.8 2.31 0.47 3.11 65.91
Imparfinis borodini 0 5 2.18 0.95 2.93 68.84
Bryconamericus stramineus 5 1.2 2.16 1.17 2.91 71.75
Piabina argêntea 1.25 4.8 1.98 0.87 2.66 74.41
Apareiodon piracicabae 5.25 0 1.89 0.56 2.54 76.94
Characidium gomesi 2.25 3.8 1.61 1.02 2.16 79.1
Characidium zebra 0.5 4.2 1.56 0.9 2.1 81.2
Rineloricaria pentamaculata 0.75 4.4 1.46 0.72 1.96 83.15
Trichomycterus sp. 0 3.4 1.36 0.81 1.82 84.98
Characidium schubarti 0 3.4 1.35 0.5 1.82 86.8
Astyanax paranae 0 3.2 1.27 0.47 1.71 88.51
Hypostomus nigromaculatus 2 0.2 1.19 0.59 1.61 90.12
Fig6. Regression between the axis 1 of the PCA, which summarizes the environmental variables, and axis 1 of the the DCA, which represents the assemblage composition of each sample point (r = 0.86, p <0.01).
DISCUSSION
Changes in the natural landscape that surrounds urban areas interrupts a series of natural processes, directly or indirectly altering the hydrological regime and channel morphology. Bearing in mind that fish are dependent on the physical and hydrological attributes of the habitat, changes in different characteristics of fish assemblages and populations are expected (Allan, 2004; Cunico et al., 2012; Paul & Meyer, 2001; Ramirez et al., 2008).
In the environmental gradient represented by component 1 of the PCA, visual segregation of the sampled stretches was detected. In order of importance, shading, area, amount of large substrates, surrounding vegetation cover, margin stability, and velocity diversity showed greater relationship to the non-urban stretches, while the amount of meso-habitats riffles and pools were related to the urban stretches. Note that the stretches analyzed herein did not exhibit the most extreme characteristics of anthropic impact, considering that they all had some degree of heterogeneity. However, a gradient of environmental deterioration can be considered. As the level of habitat and wildlife degradation is proportional to the urbanized area (Allan, 2004), this level of deterioration can be credited to
-2 -1.6 -1.2 -0.8 -0.4 0 0.4 0.8 1.2 1.6 Axis 1 PCA
0 0.4 0.8 1.2 1.6 2 2.4 2.8 3.2 3.6 4
A
xi
s
1
D
C
the fact that the stretches are located in towns of relatively small populations, below 30 thousand (CBH – ALPA, 2003; 2008).
Species richness tends to decrease as environmental degradation increases (Dias & Tejerina-Garro, 2010; Karr et al., 1986). However, we found no differences in the richness, diversity and evenness indices between urban and non-urban streams. The effects of urbanization on streams often leads to increased abundance of tolerant species (Scott, 2006). Thus, changes in the composition of the fauna are not always accompanied by reductions in species richness or abundance, as large populations of tolerant species can be supported (Walters et al., 2003). In this process, certain species typical of unaltered environments are replaced by others endowed with adaptations that enable their persistence in simplified environments regarding environmental structure (Casatti et al., 2006a; Smart, 2006; Scott & Helfman, 2001). Thus, some species increase in abundance to the detriment of others, keeping the structure of the assemblages very similar, in such a way that the indices are unable to detect these differences.
Imparfinis mirini, the more abundant species in urban streams, consumes large amounts of Chironomidae larvae, a very common resource in this habitats (Alexandre Peressin, personal observation). Some fish of the genus Astyanax, the species B. stramineus and H. anisitsi, all more abundant in urban streams, are opportunistic omnivores capable of consuming a large variety of food items (Ferreira et al., 2012; Gomieiro & Braga, 2008; Alexandre Peressin, personal observation). Being foragers of the water column, they depend on depth (Casatti & Castro, 1998), and, in fact, the urban streams showed a larger amount of pools which, added to trophic plasticity, justifies the higher abundance of these species. The species G. brasiliensis was also more abundant in urban stretches as it adapts easily to disturbed environments due to its ability to forage in sandy substrates and also to its trophic plasticity (Sabino & Castro, 1990).
Nevertheless, for the same number of individuals, estimated richness is greater for non-urban streams, just as the estimated richness based on rare species. In extreme cases, the analysis of a few populations of dominant species is sufficient to establish differences generated by anthropic impact. However, in less distinct gradients, rare species are more reliable indicators for different groups of aquatic organisms, since smaller populations tend to be more sensitive to anthropic impact (Cao et al., 1 998). These findings provide evidence that the changes are still not patent enough to promote significant differences in the assemblage structure; however, they are evident regarding the composition and estimated richness.
Several factors influence the ichthyofauna, which can generate the observed differences in the composition and estimated richness of the assemblages studied. It is generally known that the physical structure of the habitat is one of the most important factors to influence the composition of aquatic biota (Gorman & Karr, 1978; Marsh Matthews & Mattthews, 2000; Rodriguez & Lewis 1997). The correlation between environmental variables and the composition of fauna indicates that the structural changes caused by surrounding urbanization may explain the observed differences in fish assemblages. In general, the surrounding environment seems to be indirectly responsible by causing changes in the physical structure of the channel, which is indeed the most important element for maintaining fish populations (Cunico et al., 2012). The fauna of streams located in urban areas may also be adversely affected by a set of effects denominated by Walsh et al. (2005) as
they suffer sudden increases in flow that can have serious negative consequences, for fish populations, that cannot be measured through structural, morphological and chemical variables. Due to the smaller amount of water that percolates, aquatic organisms also suffer a stronger reduction of habitats than expected during the dry season, often resulting in a depleted and simplified fauna (Cleto-Filho & Walker, 2001).
In stable conditions, large species, represented by few individuals, are expected to dominate. Under conditions of disturbance, however, smaller species with shorter life cycles are favored (Clarke & Warwick, 1994). Thus, in the first situation, the biomass curve lies above the curve that represents abundance, while the opposite occurs in environments subject to exogenous disturbances (Clarke & Warwick, 1994). In the current study, both for urban and non-urban stretches, biomass curves were above the abundance curves. It is known that environmental heterogeneity is important for the maintenance of larger individuals, since it provides shelter for survival, food, and less waste (Casatti et al., 2006b). In the environmental gradient, the urban points were evident by a larger amount of pools, a meso-habitat important for the maintenance of H. malabaricus and Rhamdia quellen, two larger species that are able to survive in disturbed environments (Daga et al., 2012). Thus, regardless of the type of stream, the presence of these species is guaranteed, which did not allow us to distinguish between the environments using the biomass-abundance analysis (curve ABC).
ACKNOWLEDGEMENTS
The authors thank the Coordenação para o Aperfeiçoamento de Pessoal de Nível Superior (CAPES) and the Fundação de Amparo à Pesquisa do Estado de São Paulo (FAPESP) for the MSc scholarship to the first author (FAPESP 2010/13758-0) and the research grant to the second author (FAPESP 2009/53056-8). We also thank Professor Francisco Langeani Neto (UNESP-São José do Rio Preto) for his valuable help in the identification of specimens and Bruna B. Cruz, Rodrigo da S. Almeida, Fernanda A. Teshima and Bruno Mello for assistance in field collections. Finally, we are grateful to the graduate program in Biodiversity and Conservation (PPGDBC) for the financial support granted for translation of the manuscript.
REFERENCES
Allan, J.D. 2004. Landscapes and riverscapes: The Influence of Land Use on Stream Ecosystems. Annual Reviews of Ecology Evolution and Systematics, 35:257–84.
Angermeier, P. L. & J. R. Karr. 1983. Fish communities along environmental gradients in a system of tropical streams. Environmental Biology of Fishes, 9(2): 117-35.
Bojsen, B. H., & Barriga, R. 2002. Effects of deforestation on fish community structure in Ecuadorian Amazon streams. Freshwater Biology, 47:2246–2260.
Cao, Y., D.D. Williams, & N.E. Williams. 1998. How important are rare species in aquatic community ecology and bioassessment?. Limnology and Oceanography, 43(7):1403 – 1409. Casatti, L. & R.M.C. Castro. 1998. A fish community of the São Francisco river headwater riffles, sowtheastern, Brazil. Ichthiology Exploration Freshwaters, 9(3):229-242.
Casatti, L., F. Langeani, A.M. Silva, & R.M.C. Castro. 2006a. Stream fish, water and habitat quality in a pasture dominated basin, southeastern Brazil. Brazilian Journal of Biology, 66(2B): 681-696.
Casatti, L., F. Langeani & C.P. Ferreira. 2006b. Effects of Physical Habitat Degradation on the Stream Fish Assemblage Structure in a Pasture Region. Environmental Management, 38:974–982
Cetra, M., F.C. Ferreira & A.L. Carmassi. 2009. Caracterização das assembléias de peixes de riachos de cabeceira na bacia do rio Cachoeira (sudeste da Bahia). Biota Neotropica, 9(2). http://www.biotaneotropica.org.br/v9n2/pt/abstract? article+bn0160902.
Clarke K. R. & R. M. Warwick. 1994. Change in marine communities: an approach to statistical analysis and interpretation. Plymouth Marine Laboratory, Plymouth, UK. Pp.144. Cleto-Filho, S. E. N., & I. Walker. 2001. Effects of urban occupation on the aquatic macroinvertebrate from a small stream of Manaus, Amazonas State, Brazil. Acta Amazonica 31: 69–89.
Comitê Da Bacia Hidrográfica Do Alto Paranapanema CBH – ALPA. 2003. Fundo Estadual de Recursos Hídricos – FEHIDRO. Plano de bacia UGRHI – 14. Available from: http://www.sigrh.sp.gov.br/cgi-bin/sigrh_home_colegiado.exe? tema= apresentacao& colegiado=crh/cbh-alpa&lwgactw=145630 (04/03/2010).
Comitê Da Bacia Hidrográfica Do Alto Paranapanema CBH – ALPA. 2008. Relatório de situação dos recursos hídricos do alto Paranapanema. Fundação Paulista de Tecnologia e
Educação. Available from:
http://www.sigrh.sp.gov.br/cgi- bin/sigrh_home_colegiado.exe?COLEGIADO=CRH/CBH-ALPA&TEMA=RELATORIO2008 (04/03/2010).
Companhia de Tecnologia de Saneamento Ambiental do Estado de São Paulo – CETESB. Relatório de qualidade de águas interiores do estado de São Paulo, 2006. Available from: http://www.cetesb.sp.gov.br/agua/aguas-superficiais/35-publicacoes-/-relatorios (20/08/2012). Cunico, A.M., E.A. Ferreira, A.A. Agostinho, A.C. Beaumord & R.Fernandes. 2012. The effects of local and regional environmental factors on the structure of fish assemblages in the Pirapó Basin, Southern Brazil. Landscape and Urban Planning, 105:336–344.
Daga, V.S., E.A. Gubiani, A.M. Cunico & G. Baumgartner. 2012. Effects of abiotic variables on the distribution of fish assemblages in streams with different anthropogenic activities in southern Brazil. Neotropical Ichthyology, 10(3):643-652.
Dias, A.M. & F.L. Tejerina-Garro. 2010. Changes in the structure of fish assemblages in streams along an undisturbed-impacted gradient, upper Paraná River basin, Central Brazil. Neotropical Ichthyology, 8(3):587-598.
Falkenmark, M. 1997. Society’s interaction with the water cycle: a conceptual framework for a more holistic approach. Hydrologycal Sciences Journal, 42: 451–466.
Ferreira, A., F. De Paula, S.F.D.E.B. Ferraz, P. Gerhard, E.A.L. Kashiwaqui, J.E.P. Cyrino & L.A. Martinelli. 2012. Riparian coverage affects diets of characids in neotropical streams. Ecology of Freshwater Fish, 21:12–22.