THIS REPORT WAS PREPARED BY MARIA DO MAR AFONSO, A MASTERS IN FINANCE STUDENT OF THE NOVA SCHOOL OF BUSINESS AND ECONOMICS, EXCLUSIVELY FOR ACADEMIC PURPOSES.THIS REPORT WAS SUPERVISED BY ROSÁRIO ANDRÉ WHO REVIEWED THE
M
ASTERS IN
F
INANCE
E
QUITY
R
ESEARCH
Enel Green Power stands out from competition due to its ambitious growth plan of adding 4.6 GW in 2018 focused on Latin America and new markets, that will unlock share value.
New markets’s value comes from long-term cash flow contracts, that secure remuneration for the company (and its shareholders) and the strong pipeline of projects from increased support of governments.
We expect further regulation changes in Europe to be minor in terms of impact for EGP and our biggest concern in this sector is related with the evolution of market prices, which were assumed to decrease in the short-term.
We foresee that the cost efficiency plan together with the capacity addition will allow the company to increase earnings per share, from 0.11 in 2014 to 0.16 in 2017.
We evaluate Enel Green Power with a target price for 2015
of 2.3€ and a buy recommendation. Based on a Sum-of-the-parts valuation through DCF method and the analysis of multiple scenarios that in our view cover the different business risks.
Principal risks to consider are: exposure to market prices and regulatory changes in Europe, that could decrease the price to
1.6€; And emerging markets political environment uncertainty that could also impact PT by 30 cents.
Company description
Enel Geen Power is an Italian multinational company, focused on development and management of energy generation from renewable sources present in Europe, North and Latin America. It currently owns 9485 MW installed in different technologies from wind, to solar, hydro and geothermal. It resulted as a carve-out of Enel in 2010 when it floated 30.8% of its stake into the markets.
E
NEL
G
REEN
P
OWER
C
OMPANY
R
EPORT
R
ENEWABLES
U
TILITIES
7
J
ANUARY2015
S
TUDENT
:
M
ARIA DO
M
AR
A
FONSO
[email protected]
Unlocking Value in New Markets
Recommendation: BUYVs Previous Recommendation -
Price Target FY15: 2.3 €
Vs Previous Price Target - €
Price (as of 6-Jan-15) 1.68 €
Reuters: EGPW.MI, Bloomberg: EGPW:IM
52-week range (€) 1.65-2.19
Market Cap (€m) 8745.0
Outstanding Shares (m) 5.000
1-Year Return -8.72%
Source: Bloomberg
Source: Bloomberg
(Values in € millions) 2013 2014F 2015F
Revenues 2757 2761 2955
EBITDA 1766 1836 1981
Net Profit 598 534 592
EPS (€) 0.12 0.11 0.12
P/E 15 16.2 19.4
Net Capex 1676 1699 1894
ROIC 5% 4.9% 5.1%
Capacity installed (MW) 8883 9443 10525
ENEL GREEN POWER COMPANY REPORT
Table of Contents
RECOMMENDATION ... 3
COMPANY OVERVIEW ... 4
BUSINESS ... 4
CAPACITY ... 5
OPERATIONS RESULTS AND PERFORMANCE ... 5
STRATEGIC OUTLOOK ... 6
International Expansion ... 6
Diversification of operations ... 7
Optimization of Costs ... 7
Solid Capital Structure ... 8
Comparables... 8
ADITIONAL CAPACITY AND TRACK RECORD ... 9
CAPITAL EXPENDITURE ... 10
CAPITAL STRUCTURE ... 11
SHAREHOLDER STRUCTURE ... 12
MARKET ...13
PAYMENT MECHANISM ... 13
EUROPE ... 15
Italian Market ... 16
Regulatory and Policy Enviornment ... 17
NORTH AMERICA... 19
Production Tax Credit ... 19
YieldCo’s ... 20
LATIN AMERICA ... 22
Regional Grid ... 23
Brazil ... 23
Chile ... 24
Mexico ... 25
New Markets ... 26
VALUATION ...27
SCENARIOS ... 27
SUM-OF-THE-PARTS ... 28
Segment Assumptions ... 28
Consolidation ... 30
Weighed Average Cost of Capital (WACC) ... 31
RISKS ...32
FINANCIAL STATEMENTS ...33
ENEL GREEN POWER COMPANY REPORT
Recommendation
Currently the renewable sector in Europe is slowing down as most of the market players are moving towards other regions with less regulatory complexities, a more stable investment environment and greater pipeline of projects. EGP is doing its part by differentiating its geographical base and is directing the majority of its additional capacity to Latin American countries like Brazil and gradually other emergent markets, namely African and middle-east countries.
Latin America has been showing a great resilience in supporting investment in renewable technology, and I expect other emergent markets to follow the same track. Besides, the incrising population and modernization of these countries have led electricity demand to increase which is a good sign for those investing.
Another important aspect of these developing countries which is vital for EGP’s
strategy is the their use of PPAs to contract new projects which imply stable long-term cash flows for the parent company.
With this strategy of new markets EGP will be a first mover and will be able to set a track record in these countries that will ease future projects of expansion in those regions and will position the company one step ahead of the competition in my opinion.
Another comparative advantage for the company is the diversification in terms of technology, which helps reducing availability risk significantly, reducing operational risk.
In the North American market we see a short-term source of growth mostly in the wind sector. However the company will probably keep focusing most of its growth in emerging markets, specially with this uncertainty regarding the extension or not of the Production Tax Credit.
However one aspect that seems to have been unlocking value in this markets is the appetite for renewable assets, seen in the yieldCo market and asset rotation deals, that could allow some crystallization of value in the future for EGP, enabling the company to accelerate its expansion plan.
My recommendation for the market is a buy on Enel Green Power, as can be seen by the price target for 2015 of 2.3€ that implies an expected price return of 37% in one year and a return on invested capital improving from 5% in 2014 to 7.5% in 2020.
EGP is directing its additional capacity to new developing markets
Long-term cash flows are a major support of the expansion plan
First mover advantage in new markets and differentiation of technologies
ENEL GREEN POWER COMPANY REPORT
Company overview
Enel Green Power (EGP) is an Italian multinational company, focused on development and management of energy generation from renewable sources around the world. It was created in December 2008 as a subsidiary of Italian principal energy player, Enel, and it is a publicly traded company on the Italian stock exchange since November 2010 when Enel floated in the markets 30.8% of its stake.
The main purpose of this IPO for Enel was to reduce the debt level and avoid a rating downgrade. This followed a market trend in place, since 2006, by other
utilities like EDF, Iberdrola and EDP. Through these IPO’s of minority stakes utilities took advantage of very favourable market conditions regarding appetite for renewables, reaching multiples of 16 to 25 times EBITDA. This allowed utilities to raise high amounts of capital, which were then employed in financing their operations (growth), debt reimburssment or achieving investment-grade ratings1. However some did not choose this path, as was the case of E.On or RWE, that chose to retain full control of their renewable operations. This can be related to perceiving their renewable portfolio to be small when compared to competitiors, or not finding valuations attractive and the risk too high after the 2009 crisis, focusing their growth finance on institutional partners.
Business
The renewable business is characterized by renewable companies that own and manage plants that generate electricity from renewable natural sources, which is then distributed to the local grid. After that the transmission and sale of energy to the final consumer is of the responsibility of the distribution and retail company. EGP only operates in the first part of the electricity value model (generation) since it sold its retail business back in 2013.
The energy produced depends on the availability of the natural resource and the capacity of the devices to generate electricity (i.e load factor). Renewable Energy System (RES) load factors, when compared with non-renewable sources, are significantly lower because you cannot control your input. This important factor for competitiveness can grow either by an increase in availability or by improving the technology of the devices. For example wind load factor2 in US increased
1
Enel Green Power flotation: testament to the resilience of the green industry? by Datamonitor
2 4-Year Moving Average
IPO of 30.8% of equity in November 2010
Figure 1: Load Factor per Technology - 2013
Source: IEA
Followed the market trend and proceeds were used to reduce Enel’s debt.
ENEL GREEN POWER COMPANY REPORT
Figure 3: Installed Capacity by Technology (Sep-14)
Source: EGP Reports
Figure 4: Production distribution by technology (TWh)
Source: EGP Reports
from 25% in 1999 to c. 34% in 2011, due to increase in hub height and rotor diameter3.
Capacity
EGP has been growing in the past years to become one of the major players in the renewable sector, generating energy from a variety of renewable technologies such as wind, hydro, solar, geothermal and biomass. And in a multiplicity of locations from Italy, Spain and other European Countries, along with North and Latin American markets and a growing presence in other emergent countries. This makes the three operating segments in which the company is divided Europe, Latin America and North America.
Table 1: Capacity Installed at September 2014
MW Europe North
America
Emergent Markets Italy Iberia Rest of
Europe
Latin America
Africa
Total
Wind 720 1741 936 1666 651 0 5714
Hydro 1512 43 20 317 732 0 2624
Solar 122 13 124 28 32 10 329
Geothermal 723 0 0 72 0 0 795
Other 0 23 0 0 0 0 23
Semi-total 3077 1820 1080 1415 10 -
Total 5977 2083 1425 9485
Source: Company Reports
Currently, EGP operates 750 plants in 16 countries. In September 2014 it had an installed capacity 9485 MW, being wind the most relevant energy source followed by Hydro generation. These two technologies alone already make more than 88% of the total capacity. These 9485 MW of installed capacity are distributed between Europe, the biggest share, North America and Latin America.
Operations results and performance
Over the past four years, since its IPO, EGP has been able to maintain a constant and growing production level. With an increase in energy generated from 21.835 TWh in 2010 to 29.453TWh in 2013 which represents an output growth of 35% over the entire period. This growth was driven mostly by the successful expansion plan with the additional capacity installed throughout the years.
In terms of distribution of generation the technology that has gained more weight in relative terms is solar. On the other hand there has been a decrease in
production by residual sources (“Other”) which is justified by the
decommissioning of cogeneration plants in Iberia and Canada. Diversification has been improving as can be seen by the decreased weight of Europe
3
2011 Wind Technologies Market Report by US Department of Energy
Figure 2: Total Installed Capacity - GW
Source: EGP Reports
ENEL GREEN POWER COMPANY REPORT
Figure 8: EGP Additional Capacity Distribution By Geography (Mar 13)
Source: EGP Reports
Figure 5: Load Factor Evolution
Source: EGP Reports
Source: Analyst Estimates and EGP Report
Figure 6: Operating Margin Track Record
Source: Analyst Estimates and EGP Report
Figure 7: EBITDA Track Record Breakdown $ Million
0 500 1000 1500 2000
2011* 2012 2013
78% 76% 75%
15%7% 12% 11% 12% 14%
Europe Latin America North America
production or by the more evenly distribution among energy produced from wind, hydro and geothermal.
When analysing the load factor it has remained relatively constant, but in most technologies EGP has been able to improve year after year the indicator as it can be seen in figure 12. However they differ from region to region.
Revenues increased 22%4 since 2010, while EBITDA increased by 36%. This growth is explained mostly by a volume effect, resulting from the increase in capacity and the ability to improve EBITDA margin from 60% to 65% in four years. In the renewable sector this high margins are justified by very limited variable costs. Because even though the sector is characterized by high fixed costs of installation, the variable ones are not relevant since you do not have to pay for a specific fuel, like coal, in order to produce energy or pollution costs for instance5. So variable costs, which increase with production, are close to zero in the renewable industry6.
EBITDA in 2010 was highly concentrated in Europe, and even though EGP wants to decrease this weight it is still very relevant. We should note the impact on EBITDA of the regulation changes in Spain last year which was negative in
50€ million in 2013 and in the first 9 months of 2014 was negative in 67€ million. In Latin America and North America EBITDA has been steadily increasing due to both a volume effect and a price effect, although the volume effect is much more significant.
Strategic outlook
The strategic outlook of EGP for the next years sits on four essential topics: international expansion to new markets; Diversification of operations; Optimization of costs; Solid Capital Structure.
International Expansion
For the past years EGP has been directing its investment to new regions and countries and it intends to keep this strategy to take advantage of more stable long-term cash flows, through PPA agreements present in most developing countries. This allows the mitigation of part of the regulatory risk, that as became a significant problem in the most mature markets like the European one. However even though it mitigates the regulatory risks there are some new risks
4 Excluding other income (related to sale of assets) 5
How to Compare Power Generation Choices by Renewable Energy World
6
ENEL GREEN POWER COMPANY REPORT
Figure 9: EGP Additional Capacity Distribution by Technology (Mar 13)
Source: EGP Reports
associated with this choice as the non-enforcement of the PPA contracts or the political risk inherent to some new markets like the African countries.
I do believe this is a value creating strategy, because as we will see further on there is a lot of potential for growth in emergent markets. However we still remain to see how well these markets will develop in terms of stability, cash flows, and production levels.
In order to avoid further risks or losses, the company vouches to a thorough scouting process in order to choose sites for new plants. This process favours high availability of resources and a stable regulatory framework, as some macroeconomic aspects like GDP and power demand growth, ease of doing business and dependency on energy.
Diversification of operations
Another very important aspect is the diversification in terms of technology. The weight of wind capacity in EGP’s portfolio has been consistently increasing in the past years, from 43% in 2010 to 60.2% currently. Aligned with this the company has made an effort to diversify into other technologies, especially solar, decreasing its reliance on hydro capacity.
While in 2011 90% of the additional capacity was focused on wind, in the most recent plan the company’s intentions were to have a level of only 70% of the additions in the wind segment. This has the objective of reducing the availability risk to which the company is subject. So EGP’s targets continue to devote a high weight to wind energy, favouring however a more equally investment distribution among other sources.
In my opinion, this is a differentiating factor among the market, and it can decrease availability risk comparing with the competitors that operate only one
technology. However it also can diminish the company’s evolution in the specific sectors. As it is focused in more than one technology it might not have the structure to be a leader in all of them, which can eventually lead to disposal of plants if they do not enhance value.
Optimization of Costs
The third aspect of the strategy of the company is to optimize costs. Firstly this implies the optimization of Engineering, Procurement and Construction (EPC) costs, which is basically translated in the Capex/MW invested each year.
Secondly the company also has plans to grow on their integrated and global operation and maintenance (O&M) approach. This implies a reduction in portfolio volatility, lost production factor and O&M per MW. Basically this expresses a Expansion plan sees the
potential to unlock great value from developing countries.
More differentiation reduces the non-performing risk of the market.
ENEL GREEN POWER COMPANY REPORT
decrease of the risk of non-performing operations which eventually decreases the risk of the business and improves stability.
I am sceptical about this cost reduction plan based on the fact that it is not completely clear how the company will effectively do it. However they have been able to decrease these costs when comparing with previous periods due to economies of scale and the reshuffling of the technology mix with additions at lower costs. So I do believe they might be able to sustain it for the rest of the plan.
Solid Capital Structure
The last objective is related to capital structure as the company aims at keeping it constant. This is an aspect of vital importance because renewable energy is a capital intensive business and financing needs are essential to sustainability. This strategy implies that growth will be financed mostly by generated cash flows with no need to increase leverage from the current 44% ratio. I do believe this is feasible considering that in the previous two years the company already employed an ambitious capacity plan and the cash flows were enough to meet capital expenditures, being able to resort to debt but without leveraging more the company. However we must recall that cash flows are not certain, and unpredictable changes, for instance in regulations or contracts terms, can affect a
company’s flow and compromise these targets.
Comparables
When comparing EGP’s strategy with some of its comparables we conclude that
EGP additional capacity plan (4.6GW by 2018) is certainly the most ambitious one, considering EDPR aims to add only 2GW by 2017 and Iberdrola 1.2GW by 2016. The focus of the investment is also different, EDPR is also betting on security of cash flows through long-term contracts but, in opposition to EGP, more than half of the investment is directed to the United States. Iberdrola on the other hand is exploring and setting track records in new markets in terms of technology, especially wind offshore, exiting some non-core markets.
Optimization costs are also a priority for EDPR and Acciona. Not for Iberdrola since the company has already achieved its targets in terms of operation expenditure efficiency (initiated before). To be noted that EDPR has made a lot of use of asset rotation deals to finance its growth which is beginning to appear as a possibility for EGP (prospect deal in the US).
EGP’s strategy in terms of improved efficiency is in line with the market, however its capacity plan clearly stands out due to its ambitious scope and focus on new markets. I do believe this bet can bring a lot of value to the company, because Cash Flow generation and
sustainability of long-term contracts is essential
ENEL GREEN POWER COMPANY REPORT
Historical Business Plan
2010 2011 2012 2013 2014-2018
392 889 930 944 4600 Table 3 Additional Capacity Track Record (MW)
Source: EGP Reports
Figure 11: Comparables Capacity Distribution by Geography (2013)
Source: EDPR, IBE, and ANA Reports
Company Installed Capacity EDP Renewables 8034 MW
Iberdrola 13897 MW
Acciona 7596 MW
Enel Green Power 8883 MW
Table 4: Comparables Capacity
Source: EDPR, IBE, and ANA Reports
the European market is saturated and does not favour renewables as they used to. The uncertainty in US regarding PTC is also a drawback. Regarding investment in new technologies like wind offshore they are still too pricey in my opinion for EGP to include it in its short to medium term plans.
Aditional capacity and track record
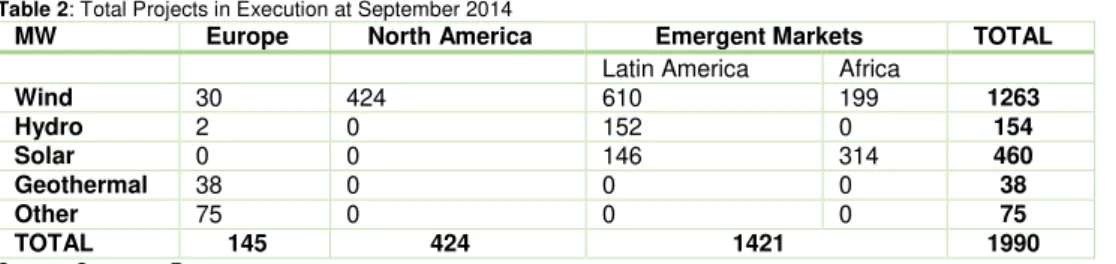
As said we are now witnessing a great effort to diversify the business in terms of technology and geography. Considering projects in execution, which are the future plants that EGP is already constructing or that are ready to build, EGP has currently 1990 MW in execution, of which 1144 MW are already under construction, 857MW of which in Latin American.
Table 2: Total Projects in Execution at September 2014
MW Europe North America Emergent Markets TOTAL
Latin America Africa
Wind 30 424 610 199 1263
Hydro 2 0 152 0 154
Solar 0 0 146 314 460
Geothermal 38 0 0 0 38
Other 75 0 0 0 75
TOTAL 145 424 1421 1990
Source: Company Reports
Of these projects in execution 64% are in wind plants, 23% in solar, 7% Hydro. All of this supports the business plan of EGP to increase its installed capacity by 4.6GW between 2014 and 2018 to a level of 13.5 GW.
In table 4 we can see EGP sustains a track record of close to 1GW installed per year since 2011 which has always been in line with the company’s targets that were proven to be reasonable. This and the fact that at September 2014, only 800MW were left to be contracted to reach the 4.6GW target in 2018 leads me to believe that the company will indeed be able to complete the capacity addition. Besides in my forecasts I assumed capacity addition in the end of 2018 to be up the target by 300MW to 4.9 GW.
When comparing with other players from Southern Europe, EGP is the second largest company in terms of installed capacity and it wishes to solidify even more this fact with the ambitious additional capacity proposed.
Even though both EDPR and Iberdrola are less dependent on European assets they are not as diversified as EGP since they only have two principal regions. Acciona also has some capacity in the emergent markets but 70% alone depend on Spanish capacity. Acciona, along with EGP, is present only in Mexico however it has projects under construction in Chile, Brazil, Costa Rica and South Africa. In terms of diversification of technology, both EDPR and Iberdrola have almost exclusively wind projects and the only one more diversified is Acciona. Track record of 1GW installed
per year supports capacity plan.
Figure 10: Projects in Execution by Region (Sep-14)
ENEL GREEN POWER COMPANY REPORT
Company Operating Margin
Load Factor (wind) EDP Renewables 70% 30%
Iberdrola 63% 27.7%
Enel Green Power 65% 27%
Source: Analyst Estimates and Companies Reports
Table 5: Comparables Performance (2013)
We must also refer the company has made same divestments in the end of 2014, with the total sale of its French assets that totalled 196 MW and in 2013 contributed with 20€ million of consolidated EBITDA to the parent company. EGP justifies this sale by wanting to focus more on markets with greater potential. This seems a reasonable decision, that will free-up resources to apply in better investments, since France’s was not able to sustain an attractive market for renewable growth, proved by its inability to meet the EU interim renewable target. EGP has also to complete an asset rotation deal in the US of 700MW of capacity in different technologies, yet no further disclosures have been made on this topic. However this would allow the company to finance part of its capacity additions plan and if we compare the most recent deal done by EDPR with an implied
value of 2€ million per MW with our US valuation of 1.2€ million I am confident
that this deal will indeed monetize some asset value for the company.
In operational terms, by analysing the past strategic plans of the company we can realize that EBITDA targets have been lowered since 2011 when the
company believed it would have an EBITDA of 2.5€ billion in 2015 which is
clearly unrealistic. I do believe however that the company will be able to meet its EBITDA targets for the next couple of years based on the fact that remuneration is now more dependent on contracted (lower risk) prices and I do not foresee more incentives adjustments in EGP principal European markets (Italy and Spain).
As it has been said EGP sold its retail business (Enel.Si) in June 2013 to Enel Energia, a subsidiary of Enel. Enel.Si operated in the Italian retail market in the installation of renewable generation devices for end users, in order to meet their demands regarding energy savings and efficiency. The total price paid to EGP
was 92€ million and it was used to amortize debt having a positive impact in the
capital structure. The impact on EBITDA of this transaction is not material since the contribution in 2012 of Enel.Si to EBITDA was 13€ million, which equals a 0.7% of the total amount. However in strategic terms it is relevant since it reinforces the strategy of maintaining a focus on developing and operating energy plants only.
In terms of margin and load factor comparing with other market players, it has indeed room to improve if we consider EDPR margin is significantly better as are both wind load factors of Iberdrola and EDPR.
Capital Expenditure
In terms of capital expenditure it has been decreasing on a yearly basis. While in 2011 65% of the annual investment was being allocated to Italy and the rest of Recent transactions show
focus of keeping assets in core value markets.
ENEL GREEN POWER COMPANY REPORT
Source: EGP Reports
Figure 14: Debt Currency Distribution (Dec-13) Source: EGP Reports
Figure 13: Capex Track Record by Technology ($mn)
Figure 12: Capex Track Record by Geography ($mn)
Source: EGP Reports
Europe (excluding Iberia), in 2013 only 32% of the Capex was directed to that region. On the other hand share of capex devoted to Latin America (including Iberia) went from 17% to 57%. In terms of technology, the majority of the investment has been on wind, but it is noted a shift from solar investment to geothermal last year. The focus of the investment has been, in all years, more than 85% devoted to expansion of capacity, and the rest to maintenance.
Table 6: Capex Data
Historical Business
Plan 2010 2011 2012 2013 2014-2018
Total Additional Capacity (MW) 392 889 930 944 4600
Growth Capital Expenditure7(Millions of €)
934 1444 1339 1148 5400
€/MW 2,38 1,62 1,44 1,22 1,17
Source: Company Reports and Analyst Estimates
By the table we can see that capital costs per MW installed have largely decrease since 2010, even though additional capacity per year has been increasing the total investment has been decreasing. This decrease in costs has been possible due to the increase in competition of manufactures and improvements of technology.
Future wise I expect market to become more efficient with a further increase in competition and consequent decrease in cost per unit, mostly fuelled by developments in China and other emergent countries manufactures.
Capital Structure
EGP structure sits on a 44% leverage ratio in 2013, which is a level the company wants to sustain for the future since they intend to fund their next years growth with generated cash flows.
In terms of financing and debt structure EGP gross debt total was €6.3 billion in 2013 of which the great majority is in Euros and has a long-term maturity. According to the company the average maturity is 6.5 years and close to three quarters were characterized by a fixed and hedged interest. From this total debt 48% was entitled to “third parties” such as Development financial institutions, Export Credit Agencies, Tax partnerships in the US or banks while EGP loans from related parties, namely from Enel Finance International, represented 52% of the nominal value of long-term debt. Net financial debt total was €5.4 billion in the end of 2013, an 18% increase when compared with 2012. The average cost of debt has been increasing from 3.5% in 2010 to 4.8% in 2013.
So far, the company has been financing its growth and operations using a mix of cash flow from operations and debt. However since 2012 the company has been able to finance its capex only with cash flow from operations, even though it
7 Does not include maintenance investment.
ENEL GREEN POWER COMPANY REPORT
Source: S&P, Moodys and Fitch Comunications
Source: EGP Website
Figure 15: Shareholder Geographic Distribution
resorts to debt to be able to meet all other expenses, like interests and dividends. This is what I expect to continue to happen in the coming years, with the increase in cash flows generated from new markets, reaching free cash flow parity in 2017. Again, there is always the risk that the expected cash flows do not materialize, but I am confident that the company has expertize enough to secure the new markets operations.
Future wise EGP also intends to have debt denominated in a more evenly
distribution of currencies, by “gearing up foreign subsidiaries with local currency
debt” in order to exploit low cost opportunities of some of the new markets they’re
entering. In my view there is an opportunity to secure debt financing from local development banks in Latin America, since the company has already secured some loans and according to Climatescope14 there are favourable conditions in these debt markets. And if we consider that most of these countries (Brazil, Chile, Mexico) have credit ratings similar to the Italian one the company is actually diversifying its currency base without increasing default risk.
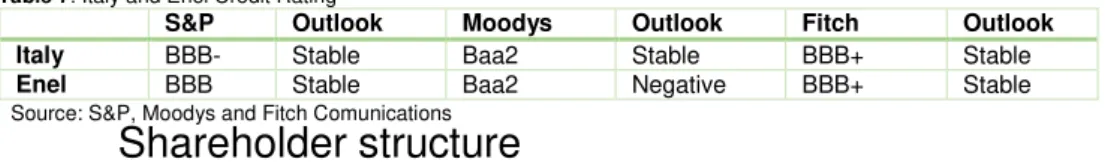
Regarding credit rating, Italy’s credit rating outlook has been revised upwards by all agencies in 2014, but S&P has cut its rating in December 2014 due to limited
GDP growth prospects. However Enel (EGP’s parent) did not suffer the same
downgrade because the agency believes it not to be entirely constrained by the sovereign risk. Moodys and Fitch evaluations of Enel were adjusted last in 2012.
They all reflect a “lower medium grade” for investment. With these outlooks we do not expect any major changes in EGP underlying cost of debt.
Table 7: Italy and Enel Credit Rating
S&P Outlook Moodys Outlook Fitch Outlook
Italy BBB- Stable Baa2 Stable BBB+ Stable
Enel BBB Stable Baa2 Negative BBB+ Stable
Shareholder structure
EGP resulted from the spin-off of the renewable activities of Italian’s energy company Enel when it decided to put close to one third of the capital on free float in the Italian Stock exchange. This fact obviously has a big impact on shareholder structure since 68,29% of the total capital is controlled by Enel, privately. We also know that in terms of share capital composition, 68,3% is strategic (Enel), 13,9% is retail and 17,8% is institutional.
This structure implies that Enel still retains most of EGP’s created value, and so EGP is very dependent on the parent company’s strategy success but also failures which an independent shareholder must take into consideration. In my opinion, the support of Enel is beneficial to EGP due to the expertize the company already has in the Italian energy market and worldwide, which might Capital structure expected to
remain stable but dependent on cash flow generation.
ENEL GREEN POWER COMPANY REPORT
speed up some of EGP penetration processes in new markets and support its growth ambition.
A potential investor should bear in mind the risks of multiple transactions with related parties that might not always be equally beneficial for both parties. To prevent this EGP has a defined corporate governance structure and created an independent Related Parties Committee in 2013 to guarantee the fairness of these transactions.
The dividend policy of EGP has been to employ a 30% payout ratio, based on the
group’s net income, and distribute them through the shareholder base, retaining
the rest of the profits to reinvest in the business. With the continuing of the ambitious business plan there is no indication that this payout ratio should change in the close future. Shareholder structure also seems relatively stable, mostly secured by the heavy weight of Enel.
A final aspect to refer is the possible buyback of the public shares by the parent company Enel, as occurred with Iberdrola Renewables and EDF Energies Nouvelles in 2011. This happened for two different reasons, Iberdrola had achieved the goals intended with the IPO and took advantage of a low share price at their view (48% decline since IPO). On the other hand EDF buy back was related to two different reasons, the increase in complexity of renewable projects
that were becoming more industrial but also to mitigate some of the company’s
dependence on nuclear power.
In my opinion, what might motivate a buy back by Enel is the undervaluation of the share price. This can be a positive point for the current or future shareholder since Enel might be willing to buy back the share at some premium, as it is common in these cases.
Market
Payment Mechanism
One aspect that we consider is very relevant and must be explained when exploring the renewable business and EGP is the payment mechanism, since it is not the most linear or simple process. In reality there is only one way to get the energy produced out the plant, through the grid. However there are various forms of payment. As renewable energy is a relatively recent market, consider that in 2002 only 1.6% of total electricity production came from renewable sources other Enel’s expertize can facilitate
EGP entrance in new markets, but it also limits management freedom and processes.
A buyback from Enel is a possibility, even if not in the immediate future.
Table 8: Levelized cost of electricity 2012
Source: International Energy Agency Technology Cost $/MWh
Wind 80.3
Hydro 84.5
Biomass 102.6
Solar 130.0
Coal 95.6
ENEL GREEN POWER COMPANY REPORT
Figure 16: Levelized Cost of Electricity Evolution $/MWh
Source: Lazard LCE - Version 8.0
than Hydro8, there were a series of incentives put in place to help the renewable companies enter the market. These incentives had the objective of helping companies face the higher generation cost of the industry, encouraging the investment in this type of energy production. This generation cost has been decreasing with time as can be seen in table 2.
The most common methods of payment in the market can be divided in two categories: Subsidies given by the governments or specific renewable energy auctions.
Subsidies are stated in the country’s regulation and can be of the following types:
Feed-in-tariffs9 (FiT): characterized as a fixed price per MWh paid to the renewable energy generator in accordance to its technology cost, above the market price. Countries: Italy, Portugal, Greece, France;
Production Tax Credit10: is a per-kilowatt-hour (kWh) tax credit for electricity generated by qualified energy resources and sold by the taxpayer to an unrelated person during the taxable year. Countries: United States;
Investment Tax credits11: reduces the tax liability for individuals or businesses that purchase qualifying solar energy technologies. Countries: United states; Green Certificates5: is a tradable commodity proving the production and the use of a certain amount of renewable energy. Countries: Italy, Romania.
Feed-in-Premium5: paid to the producers in addition to the market price.
The auction mechanism, mostly present in the US and developing countries, is the major source of growth expected by EGP, and is organized by government’s agencies. The government issues a call for tenders to install a certain capacity of renewable energy-based electricity with defined requirements, and the bidder proposes a certain electricity price at which they are able to do the project. The result is the signature of a Power Purchase Agreement (PPA) between the renewable company and the government which will guarantee that renewable companies will have all its electricity generated bought at a fixed price for a predefined number of years (usually 20 or 25). This guarantee can be used to facilitate the financing of the project12.
The incentive for renewables inherent in this mechanism is the certainty that all energy produced is sold, so as long as the price agreed is able to cover the full
8
Worldwide electricity production from renewable energy sourcesby Observ’ER and Fondation Énergies
pour le Monde
9
Methodology for calculating subsidies to renewables, by International Energy Agency (IEA)
10
Database of State Incentives for Renewables & Efficiency
11
Solar Energy Industries Association
12
ENEL GREEN POWER COMPANY REPORT
costs of the production expected, renewable investment is secured. To help prevent deficits, similar to the ones generated by FiT, the government can set a ceiling to the auction process, so it is not higher than the revenues collected from the overall electricity price paid by consumers.
Europe
For EGP the European renewable market in terms of growth prospects is already well explored and the company does not have many competitive advantages in
growing in this “saturated” market. However it is still very dependent on it and in 2013 75% of EBITDA resulted from the region.
The first aspect to refer when analysing the European renewables is the climate and energy package adopted in 2009. The package defined targets for 2020
regarding renewable energy, the “20-20-20”, setting three different objectives for the European Union until that date: a 20% reduction of greenhouse gas emissions from 1990 levels, raising the consumption from renewable sources to
20% and a 20% improvement in the EU’s energy efficiency.
In order to comply with these targets there has been a great effort by the EU members to increase the presence of RES. In 2013 generation from renewable sources in the European Union was 9257.5TWh, which represents a share of 27.5% and a growth between 2003 and 2013 of 9%13. This high growth was encouraged by national targets, adjacent to the European ones, that were supported by country-specific frameworks, like tax exemptions and price incentives. For example in Romania companies that produce energy from renewable sources can use accelerated depreciation for tax purposes or reinvest dividends with tax exemption.
This concern is not only present in Europe, but worldwide. According to REN 21, in early 2014 at least 144 countries had renewable targets imposed and 138 had renewable support policies in place. For example China has devoted a reasonable amount of resources to renewable energy, setting the 2020 target of 200GW14 , from 800 MW in 2010, to be installed in technologies such as wind, solar and biomass.
Another important driver of growth was the significant technological improvements, mostly in wind and solar, for example by increasing the size of turbine rotors15, the height of the turbine tower, or the development of cells for
13 Enerdata 14
China Greentech Initiative
15
Advancements in Wind Turbine Technology: Improving Efficiency and Reducing Cost by Renewable Energy World
20-20-20 targets and cost decrease were great
incentives for RES in Europe
ENEL GREEN POWER COMPANY REPORT
Figure 17: Europe New Investment In Renewable Energy (Billion $)
Source: Frankfurt School-UNEP Centre
Figure 18: Italy’s Electricity Price
Source: Bloomberg
solar panels that use alternative materials to silicon, allowing a better performance.
However a slowdown in investment is to be noted, down 44% from 2012 to 2013, driven mostly by the change in the regulatory framework in the recent past and the retroactive tariff changes16 in the region.
Italian Market
Italian electricity, or energy, market is not very competitive with other European countries since it faces three main challenges that limit its competitiveness17: higher prices for businesses and households comparing with rest of Europe; suboptimal security of supply in terms of natural gas: high dependence on imported fuels; and economic and financial difficulties experience by market players. This negative scenario is completed by a decrease in electricity demand that in the first eleven months of 2014 was 2.8% adjusted18.
To keep the needs of environment sustainability but also, to reach competitiveness, according to the national energy plan, Italy will focus on four main goals: reduce the cost gap; exceed 2020 environmental and decarbonisation targets; improve the security of supply especially in the gas sector; and endure sustainable economic growth. The second and last goals are the most relevant for EGP because they are closely related with green energy and the renewable sector.
Italian market prices, even with a 11% decrease since January, when compared to other European electricity prices have been one of the highest with an average
in June 2014 of 49€/MW when the European average was 40€/MW for the same
period. This is explained by the dependence on imports to meet domestic demand and the dependence on natural gas19. As so, the recent decrease in the price of natural gas, and also, the renewable generation penetration in the Italian market have led the Italian prices to decrease.
The priorities of action for the country until 2020 are to turn the gas market into a competitive one, bringing costs down and trying to be a door for imported gas into southern Europe. In terms of sustainable development it must align the level of incentives with the European ones and endorse development in other renewable sectors, besides electricity, like thermal and use of waste. Finally an
16
Global Trends In Renewable Energy Investment 2014 by Frankfurt School-UNEP Centre
17Italy’s National
Energy Strategy: for a more competitive and sustainable energy by Ministero dello Sviluppo Economico
18
Terna
19
Quarterly Report on European Electricity Markets, Volume 6 and 7 by EU Market Observatory for Energy Italian prices are expected to
ENEL GREEN POWER COMPANY REPORT
important aspect for EGP in the priorities plan is the modernization of the system governance which is more cumbersome than other countries.
So for EGP this national Italian plan might not be all good news, even though a more stable market will eventually benefit the company. In terms of electricity price and its decrease, EGP is subject to their volatility in the hydro and geothermal sector which represent close to 59% of the generation of the European segment, and big changes in this indicator can diminish the company’s performance. However the company has been investing in hedging sales at predefined prices in order to better control this fluctuations.
A final note, in a long view perspective, with the current business plan, this Italian exposure, and its setbacks, will decrease as EGP completes the expansion and diversification into other markets.
Regulatory and Policy Enviornment
With respect to the region performance of the 20-20-20 targets: of the 28 member states, 22 met the interim 2011/2012 milestone20. However due to the referred changes in European framework in terms of access to finance and the remuneration level of existing support schemes, there is some doubt of weather the EU-members will be able to meet their 2020 targets or not. According to EUFORES only nine countries are expected to meet their targets (being Italy, Romania and Bulgaria among them). While Spain, France, Greece and Portugal
(part of EGP’s portfolio) are not expected to meet their targets.
A big player in this uncertain framework were the renewable subsidies that have, in the recent past, suffered a deep review, due to the unbalance they created in
the government’s accounts. Namely huge tariff deficits resulting from a cost with incentives higher than the revenues collected from the access tariff charged to costumers.
These unbalance in subsidies is not only a European problem, one of Europe’s
competitors in terms of renewable energy is the United States and in 2013 alone the Production Tax Credit cost tax payers $2 billion21. This led to a big discussion regarding the continuance or not of this measure.
In EGP’s portfolio, last year Spain was marked by the big regulatory changes with the Royal Decree 9/2013 approved on July 12, 2013. The legislation eliminated the feed-in tariff scheme and established that electricity generated from renewable resources would be remunerated at the market price, although if
the market price is not sufficient to ensure “reasonable profitability” an additional
20
EU Tracking Roadmap by European Forum for Renewable Energy Sources (EUFORES)
21
Wind Production Tax Credit Imposes High Costs by The Institute for Policy Innovation Italy is not expected to be a
major source of future growth for EGP
Half of EGP’s portfolio countries are expected to meet their 20-20-20 targets
ENEL GREEN POWER COMPANY REPORT
amount per MW would be paid.22 In Romania an emergency measure was taken that limited the amount of green certificates traded, from 2 certificates per MWh to 1 for wind energy, and from 6 to 2 certificates traded per MWh of solar energy produced.
In the following table we can see the tariff deficits situation at 2013 in Europe:
Table 9: Tariff Deficit of Selected Countries for 2013
Spain Portugal Greece France Italy2012
Comulated Tariff Debt (€ Million) 30.000 3.700 700 4000 1.500
% GDP 3% 2,2% 0.4% 0.2% 0.1%
Source: European Comission
We must understand that the tariff deficit is not exclusively related to RES, but the high incentives the sector enjoyed in the past years had definitely an impact: for example the costs with support of renewable energy in Spain increased from
€1.2 billion in 2005 to €8.4 bn in 201223. In Iberia, the region with the most
serious deficits problems, costumers electricity cost is now composed of 45% related to the wholesale price of energy and 55% associated with the access tariff24, that has been growing with subsidies and other regulated costs25.
In my opinion, countries characterized by high tariff deficits, uncertainty in terms of future remuneration schemes and retroactive changes might not be able to meet their renewable energy targets. For example Greece has met its interim
targets but it’s not even halfway to the final target, so I do not expect it to happen.
In Iberia, both Spain and Portugal have been acting on high tariff deficits which will certainty decrease the renewable growth in those countries, jeopardizing the 2020 targets. For example in Portugal, with the financial crisis most of the RES incentives were abolished and some institutions believe that the new regulatory framework lacks transparency16. Spain is closer than Portugal to achieve its target (which is also less ambitious), however due to the retroactive changes happening, most investors do not feel safe investing in the country because their projects might fall short. Another big setback in this country was the forced competition at market levels which for some new renewable projects is not doable.
However I do believe governments will continue to impose renewable targets and will continue incentivising renewable energy development because it is the sustainable choice for the future. But some current incentives mechanisms must certainly be revised, as some already have been. This transition naturally brings uncertainty to the framework of the region and it will be a challenge to offer
22 Enel Green Power 2013 Annual Report 23
Electricity Tariff Deficit: Temporary or Permanent Problem in the EU? By European Comission
24
Includes the tariffs for the Global Use of System, the Use of Transmission Network and the Use of Distribution Network are paid by each electricity consumer in the Regulated and Free Market (ERSE)
25
Pulling the Plug on Renewable Power in Spain, by The Oxford Institure for Energy Studies Tariff Deficits are currently a
big concern of southern European governments
ENEL GREEN POWER COMPANY REPORT
remuneration certainty while moving to lower incentives and integrating greater levels of variable renewables into the grid system 26.
Regarding the overall regulatory environment in the European countries of EGP’s portfolio I do not expected much more changes, or significant ones, for the close future since: Spain already made a big restructuring last year to face the tariff deficit; Italy system of incentives “FER Decree”, put in place by the Ministerial Decree of 5 July 2012 that regarded mostly solar power, was abolished and, as a result, several energy incentives expired at the end of 2013; And also Romania made an adjustment in 2013 to lower the number of green certificates. These countries represent 92% of the generation in the region.
North America
According to the US Department of Energy, United States were the second country with most installed capacity in wind, which is able to meet 4.5% of the demand needs of the country. This is translated by the $1.8 billion invested in the sector only in 2013. In the end of 2013, 74% of the capacity installed of EGP in the United States was in fact wind, and this share is expected to increase to 79% in the end of 2014 as all the projects under construction are in this sector as well.
Production Tax Credit
A very relevant factor when discussing the North American Renewable sector is the support in place, the Production Tax Credit (PTC). It establishes the full credit amount of 2.3-cents per kWh produced27. from wind, closed-loop biomass, and geothermal technologies.
However, in the end of 2013 this mechanism expired. What this means is that plants that entered into operation after the end of 2013 will no longer be allowed to receive a PTC. Yet this was modified later on, allowing plants that were already under construction by 1st of January of 2014 to still be eligible for a PTC, which mitigates some of the impact on EGP’s under completion projects in the US.
This is not the first time PTC has expired, and has been later renewed. The incentive first appeared as part of the Energy Policy Act of 1992 and has been expired and extended five times28. This of course is not good for the long-term development and stability of wind energy since developers and investors, in order to invest, have to live under a very uncertain scenario.
26
EU News & policy debates, across languages (www.euractiv.com)
27
The Renewable Electricity Production Tax Credit: In Brief by Congressional Research Service
28
Production Tax Credit for Renewable Energy by Union of Concerned Scientists No further expressive subsidy
adjustment affecting EGP is expected
ENEL GREEN POWER COMPANY REPORT
Figure 19: US YieldCo’s Stock Performance
Source: Bloomberg
Regarding the most recent events, the Capitol is still debating on multiple tax breaks. For now the only thing certain (since December 3rd) is a one-year retroactive extension of the PTC that would expire again in the end of 2014. We believe however that there is good chance that the PTC will be renewed. In this case it is a good sign for the remuneration of EGP in the region, that will remain constant. Impact on Enel US enterprise value of the non-renovation of PTC from
2015 onwards is negative in 240€ million.
In an outlook view, growth prospects for 2015 onwards are very shaky in the country, mostly due to the expiration (temporarily or not) of the PTC and also due to low natural gas prices, modest electricity demand growth, and limited near-term demand from state renewables portfolio standards29.
YieldCo’s
A second aspect that is worth our attention is the most recent trend in the
renewable sector in terms of deals, which are YieldCo’s and asset rotation deals.
YieldCo’s appeared in the renewable market last year. They consist on the generation of a vehicle from a parent company, EGP for instance, that owns a bundle of operating assets normally in multiple renewable technologies previously held by the parent company. This vehicle is listed in a stock-exchange as a public company, but the norm is that the parent company keeps a majority of the shares of the YieldCo. The new public company is expected to generate stable long term cash flows (derived normally from the PPA agreements inherent to their assets). These cash flows are then distributed as large dividends to the shareholders. Investors can expect low-risk returns30.
For the parent company this is an effective way to monetize investments, somehow earlier than if it would have kept the assets to themselves. With the proceeds from the IPO they can either pay debt, or what it normally occurs, use them to invest in new projects, increasing the growth prospects and accelerating development. For example TerraForm yieldCo, spun out of American SunEdison, used part of the $436.2 million IPO proceeds to repay outstanding debts and fees. $86 million were intend to be used for further acquisitions and obligations of the current TerraForm portfolio and $194.4 million remain in the company for corporate purposes, such as, project acquisitions from SunEdison as well as unrelated third-parties31. More recently for example SunEdison used TerraForm to acquire First Wind which permits an expectation of installing as much as 2.3
29
U.S Department of Energy
30
A Deeper Look into Yieldco Structuring, National Renewable Energy Laboratory
31
SunEdison yield co nets extra cash from IPO by John Parnell, PV-Tech PTC expected to be extended
in the short-term, protecting EGP’s investments.
ENEL GREEN POWER COMPANY REPORT
Table 10: US YieldCo’s Return Since IPO
Source: Bloomberg
YieldCo IPO Date
Return NRG Yield Jul 13 120%
Pattern Energy Sep 13 13%
Abengoa Yield Jun 14 -8%
TerraForm Power Jul 14 22%
NextEra Energy Jul 14 30%
YieldCo Dividend
Yield
NRG Yield 3.22%
Pattern Energy 5.39% Abengoa Yield 3.93% TerraForm Power 3.55% NextEra Energy 2.30%
Table 11: YieldCo’s Dividend Yield
Source: Bloomberg
gigawatts of capacity next year, up from a range of 1.6 gigawatts to 1.8 gigawatts32 before the acquisition.
This new market so far has been performing well with double digit returns. Even though this is a good sign, the reliability of the market is not certain, for example it has not been tested in a scenario of increased interest rates where high
dividend yield securities could be substituted in investors’ appetite by higher
interest rate fixed income securities.
As said, an advantage of YieldCo’s is their high dividend yield, average of 3.7% versus the S&P500 average of 1.97%33 and the increase in dividends themselves, as was the case of NRG yield that increased its quarterly dividend by 10% in 2014 going from $1.20 per share annualized to $1.3234. This benefits both the parent company that owns a majority part of the YieldCo but also the new shareholders since both get paid the dividend.
Another upside for parent companies is the higher valuation of the assets
obtained in this listings that are “cleaned” from the construction risk.
Last, in comparison for example with tax equity partnerships (popular alternative source of capital in the US), a YieldCo is a lower-cost source of capital for parent companies35. The rationale of this partnerships is based on firms with big tax bills investing in renewable companies in order to later collect the tax exemptions allowed36.
To note that YieldCo’s are not risk-free however, because if they intend to deliver high growth they need to be able to materialize that growth into new projects which might not be as easy if the renewable markets decelerates.
Regarding EGP, I do not believe the company will be listing a YieldCo, at least in the near future, according to comments by the company in this mid-year. Besides there is still demand from institutional partners, which is less cumbersome and risky than a YieldCo.
With this, one aspect that the yieldCo phenomenon shows is the big appetite for renewable assets. And an alternative way to take advantage of this increased demand and consequently better valuation is through asset rotations, which is a much more common strategy in Europe. Namely in EDPR’s strategy and also EGP that has stated it is looking to rotate a portfolio of 700MW comprised of multiple technologies in the US for which they already have non-binding offers.
32
Bloomberg and Yahoo Finance
33 S&P Dow Jones Indices – November 2014 Factsheet 34 NRG Yield Press Release
35
A Deeper Look into Yieldco Structuring by National Renewable Energy Laboratory
36
An Analysis of the Costs, Benefits, and Implications of Different Approaches to Capturing the Value of Renewable Energy Tax Incentives by Lawrence Berkeley National Laboratory
YieldCo from EGP is not expected
ENEL GREEN POWER COMPANY REPORT
Figure 20: Latin America and Emergent MSCI index performance
Source: Bloomberg
Regarding this option, I believe there is an appealing price in the market and that this type of transaction can help EGP monetizing investments (hence value). Just consider the price obtained in a deal of EDPR last August with an implied enterprise value per MW of €1.16, compared with our valuation of €1.02 per MW in the North America.
Asset rotation deals, when compared to YieldCo’s, are a safer choice and consist of practically the same: the sale of a minority interest in a portfolio of operating assets to some minority shareholders; but instead of doing it in the public market to a variety of different investors, they do it to institutional partners, such as financial institutions, insurance companies, other energy players and so on, in a privately way.
Latin America
As it has been mentioned, EGP’s growth is expected to be delivered mostly
through capacity investments in Latin America and emergent markets in Africa. The region is now experiencing what developed countries already have which is a high growth in the overall economy as can be seen in the MSCI Latin America and Emergent markets index performance graph. In 2013 Latin America GDP growth was 2.5%37 that compares with a neutral 0.1% in the European Union. Even though the trend has been for the GDP growth to slow down across all regions, the gap between them has been consistent.
The renewable sector specifically, has experienced a constant improvement in terms of investment in capacity, according to Inter-American Development Bank it went from only 1.5GW in 2007 of Renewable capacity in LA to 26.6GW in 2012. Countries are realizing the large benefits renewable energy can bring such as
“job generation, energy security, environmental advantages, climate change
advantages and technology development"38. In terms of costs, for governments it is not as demanding as for European countries, for instance, because energy prices are higher in Latin America, than in Europe or US39. So they do not need to subsidize renewable energy so much as the market price is high enough to cover the renewable cost. In early 2014 at least 19 countries in the region had renewable energy policies, and at least 14 had renewable energy targets40. Regarding availability of natural resources, LA has a very good potential. And IADB states that Latin America and the Caribbean could meet 100% of their
37 World Bank 38
Latin America Enjoys Abundant Renewable Energy but Lacks Policies for Use, by Scientific American
39
The rise of renewables in Latin America by Global Trade Review
40
Renewables 2014 Global Status Report by REN21 Latin America is starting to
ENEL GREEN POWER COMPANY REPORT
electricity needs by renewable capacity only, and that currently renewable energy is just as affordable as other fossil sources41. Demand will also not be a limiting factor since the population is experiencing a big growth that will translate naturally in a higher demand for electricity.
Regional Grid
The first aspect that must be discussed is the poor grid network and limited reach in terms of different regions. In 2012 31 million people still lacked access to electricity which implies that significant investment is still needed in this area in order to fully be able to materialize investments. To face this challenge the region is focusing on regional integration, aiming to connect different countries by the same grid in order for electricity to get to everyone at competitive prices and aiming to decrease the dependence of fuel prices and their volatility.
Efforts in this direction have been shown by multiple countries of the American
continent, for example with the program “Connect 2022” presented by both
Colombia and the United States and that boldly propose an integration of the electrical system for the continent. The SIEPAC42 initiative is a regional system of transmission of energy, that connects Guatemala, El Salvador, Honduras, Nicaragua, Costa Rica and Panama with a 1800Km grid and was commissioned in mid-2013. This was the first regional effort in the direction of regional integration of electricity in the region, but there are other projects in development phase both in the Andean region, as to connect Brazil and Argentina.
This is a big challenge for the region and whoever invests on it but in my view this investment will be made and we will see a rapid evolution in terms of grid connections because it is of the most important need for the population and the development of the different countries.
Brazil
Brazil was the 7th world largest nation in 2013 in terms of GDP acknowledging
the tremendous influence the country’s economy can have in any market.
The target for renewable energy set in Plano Decenal de Expansão de Energia is of 33% of the new capacity in 2023 being from wind and solar43, while the current renewable share of capacity installed is 15.3%. This value excludes large-hydro which is a very developed sector in the country, representing 64% of national capacity41.
41
Climatescope 14 by Bloomberg New Energy Finance
42
Sistema de Interconexión Eléctrica de los Países de América Central
43 Associação Brasileira de Energia Eólica