THIS REPORT WAS PREPARED BY FRANCISCA NAVARRO, A MASTERS IN FINANCE STUDENT OF THE NOVA SCHOOL OF BUSINESS AND
ECONOMICS, EXCLUSIVELY FOR ACADEMIC PURPOSES.THIS REPORT WAS SUPERVISED BY ROSÁRIO ANDRÉ WHO REVIEWED THE VALUATION METHODOLOGY AND THE FINANCIAL MODEL. (SEE DISCLOSURES AND DISCLAIMERS AT END OF DOCUMENT)
O
M
ASTERS IN
F
INANCE
EQUITY RESEARCH
! Global leader in distribution business (42.3% market
share) and Airline IT solutions (31% share). Both businesses are synergistic.
! Strong EBITDA margins showing a consistent growth:
the diversification into IT solution has hedging additional risk GDS industry may be suffering
! Global air traffic growth: typically 4%-5%; more
concentrated in emerging markets (where AMS makes over 40% of its bookings – Latin America, Middle East and APAC)
! Additional market share gains are expected in IT
solution mainly boosted by Navitaire acquisition. Distribution is estimated to grow due to new agreements and customers in emerging markets
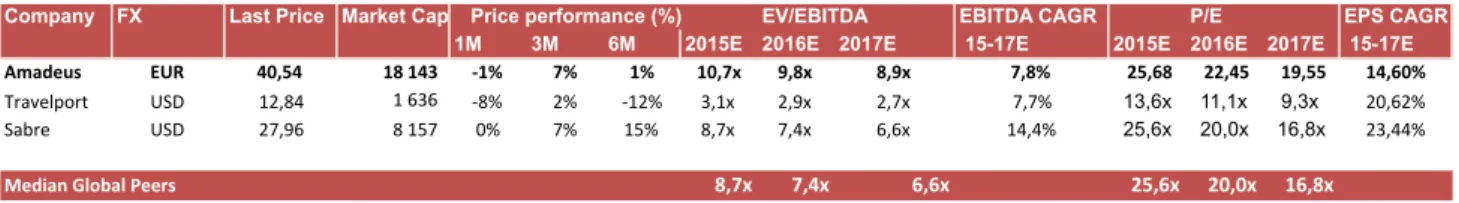
! The company is currently trading at higher multiples
compared to its global peers but that is justified by the company growth and outperforming results versus its competitors.
Recommendation:
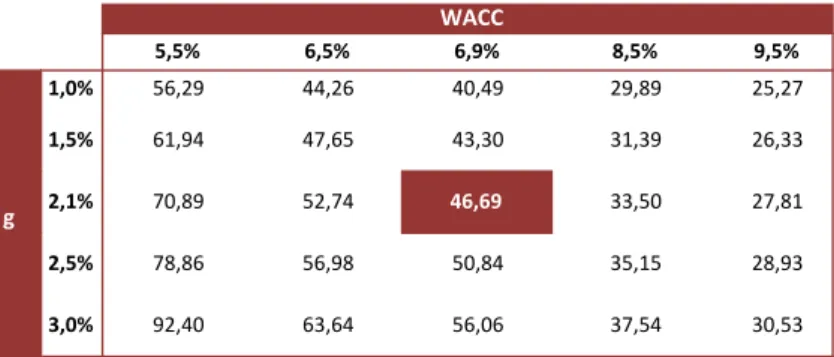
We initiate our coverage by recommending a buy rating and a target price of 46.69Eur. We believe Amadeus is a global leader in the IT and GDS sectors, and it has been showing resilience outperforming the market. Despite the threats of disintermediation and increasing consolidation of OTAs, the company experiences a growing expansion of its customers’ base throughout the world.
AMADEUS
IT
HOLDINGS
C
OMPANY
R
EPORT
INFORMATION
TECHNOLOGY
7
J
ANUARY2016
S
TUDENT
:
F
RANCISCA
N
AVARRO
[email protected]
Momentum growth maintained
Flying high with bookings growing
Recommendation: BUY
Price Target FY16: 46.69 €
Upside: 19.62%
Price (as of 7-Jan-16) 39.03 €
Bloomberg: AMS SM
Market Cap (€m) 19,771
Outstanding Shares (m) 447.582
Other (…)
Source:Bloomberg
(Values in € millions) 2014 2015E 2016F
Revenues 3418 3174 4134
EBITDA 1306 1474 1705
Net Profit 629 704 867
EPS 1.41 1.58 1.95
AMADEUS ITHOLDINGS COMPANY REPORT
Table of Contents
Investment Case ... 3
Amadeus: a global leader ... 4
Shareholder structure ... 5
Global Distribution Systems Sector ... 5
Revenue Inflows despite airlines’ performance ... 6
Amadeus GDS vs Industry ... 7
Barriers to entry ... 7
Risk Factors ... 8
Understanding the GDS risks and the value of network effect ... 8
IT Solutions Sector ... 10
Strong market fundamentals ... 11
IT Solutions segment has a higher contribution margin than GDS ... 12
High Barriers to Entry ... 13
IT Solutions mitigates risk in distribution ... 13
Airport IT ... 14
Hotel IT & Rail IT ... 14
Recent M&A: Navitaire ... 15
Air Travel Trends ... 16
WORLD ... 16
ASIA ... 18
EUROPE ... 18
NORTH AMERICA ... 19
MIDDLE EAST & AFRICA ... 19
LATIN AMERICA ... 20
Financial Performance ... 20
Online Travel Agencies ... 20
Financials ... 21
GDS ... 21
IT SOLUTIONS ... 23
Navitaire ... 24
CapEx and R&D Investment ... 24
Working Capital ... 25
Debt Structure ... 25
Valuation ... 25
Terminal Value ... 26
Multiples ... 27
Sensitivity Analysis ... 28
Appendix ... 29
Disclosures and Disclaimer ... 32
AMADEUS ITHOLDINGS COMPANY REPORT
5,37% 4,39%
7,50% 6,64%
10,11%
3% 5% 7% 9% 11%
0 1 000 2 000 3 000 4 000
2010 2011 2012 2013 2014
Revenues
Growth
1972
3418
1602 Sabre
Amadeus
Travelport 30,0% 32,0% 34,0% 36,0% 38,0% 40,0%
0 500 1 000 1 500
2009 2010 2011 2012 2013 2014
EBITDA
EBITDA margin
20% 25% 30% 35% 40%
2012 2013 2014
Sabre
Travelport
Amadeus
0 200 400 600 800
2010 2011 2012 2013 2014 Amadeus Sabre
Investment Case
Amadeus operates within two business – Global distribution systems and IT Solutions – and is the global leader in both sectors. These two sectors are synergistic businesses. Its performance has been consistently improving showing resilience in its EBITDA growth. Revenues reached its highest in 2014 – 3,418Eur million – value never achieved by its competitors.
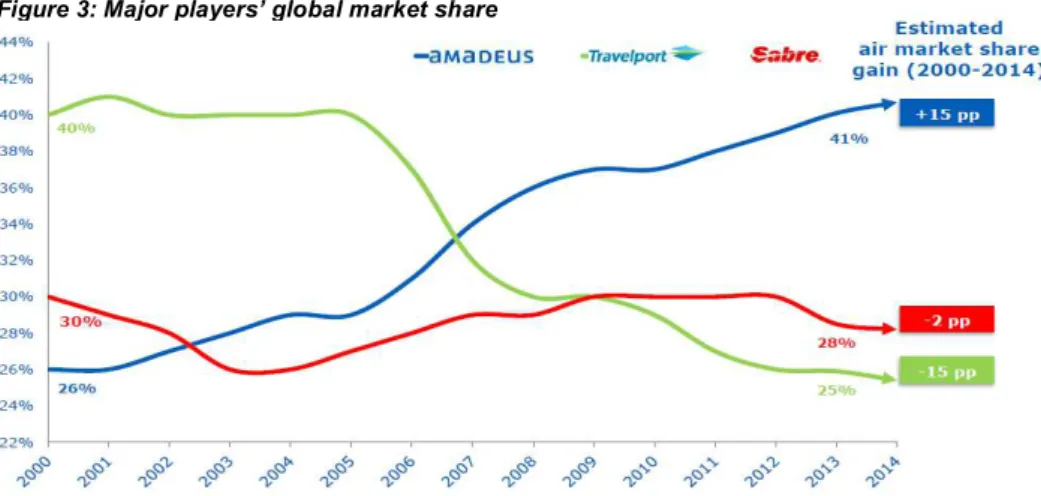
In GDS1 business Amadeus detains a global market share of 42.3%. This sector represents 73.4% of the group’s total revenues. Amadeus holds the leading position in all regions except for North America and Latin America, where Sabre has a heavier presence. Nevertheless, Sabre is strong in America but weaker in everywhere else. The company’s revenues enhance its positioning in the market: Amadeus’s sales represent 170% of Sabre’s revenues (figure III), the 2nd largest GDS firm in the world. We expect the volume of bookings done through Amadeus GDS growth since one of the main drivers of its revenues is global air traffic growth that is expected to growth 4.9% annually over the next 20 years. Emerging economies, where Amadeus has been increasing its presence and detains a leading positioning, will mainly drive this growth.
Amadeus has a market share of 31% in IT Solutions business, followed by Sabre. The main drivers of this business are also air traffic growth - due to the transaction fee per passenger boarded – but also due to the continuing migration of airlines to Altéa platform. Considering airlines that are projected to migrate to Amadeus IT platform, it is expected Amadeus will have more than 1 billion passengers boarded in 2018, presenting a CAGR 2014-18E of 10.73% - above the expected annual air traffic growth. This business presents high visibility also due to the length of the contracts – usually 10-15years contracts.
Hence, we projected strong cash flow generation mainly supported by high EBITDA growth. EBITDA growth will be driven by an increase in revenues but also due to scale economies enjoyed by both businesses (but mainly in IT Solutions). We believe shareholder remuneration will be increased (reaching a payout ratio of 60%) because the cash generated by the company will be enough to keep Net debt/EBITDA within the levels set by the company, finance operating needs and pay interest expense.
1
GDS – Global Distribution System Source: Amadeus
Figure I: Amadeus EBITDA (Eur in millions) Figure II: Amadeus Revenues (Eur in millions)
Figures III & IV: Major Players’ revenues in 2014 (Eur in millions); EBITDA margin
Source: Amadeus, Sabre and Travelport
Figures V: Passengers boarded
AMADEUS ITHOLDINGS COMPANY REPORT
14%
55% 31%
North America
63% 13%
24%
EMEA
Amadeus Sabre Travelport
Figure 1: 2013 GDS air bookings share in North America, and in Europe, the Middle East and Africa
Amadeus: a global leader
Amadeus is a global leader in the travel and tourism industry within the global distribution system sector and IT solutions sector. Amadeus delivers real-time search, pricing, booking, ticketing and other solutions to travel providers and travel agencies within the GDS business. On the technology solutions sector the company offers business process such as reservations, inventory management and operations for travel providers focusing on operational efficiency and enhancing customer’s experience.
Amadeus, founded in 1987 by Air France, Iberia, Lufthansa and SAS as global distribution system, was created with the purpose to allow the access of airlines providers' inventory with travel agencies and consumers in real time. At the time the intention was to offer to European airlines and OTAs2 an alternative to Sabre, a GDS3 based in U.S. Travel providers provide their content to Amadeus (at zero cost) getting access to travel agencies around the world. Amadeus generates revenues from travel providers when a booking is done in its system. On the other hand, Amadeus pays an incentive fee to travel agencies when a booking is done in its system. The company currently has a market share of 42.3% of Global Distribution Systems. GDS revenue drivers are correlated with GDP growth (such as disintermediation, air traffic growth). Therefore, given the heavier presence of Amadeus’ GDS in emerging markets compared to its competitors, the company is expected to outperform participants in this business since World Real GDP is expected to growth 3.1% annually within the next ten years with Asia and Africa leading the growth with yearly GDP change of 4.3% and 4.5%. Amadeus provides travel providers (mainly airlines but also include hotels, airports, rail markets) IT solutions. A transactional fee is paid to Amadeus for the use of the technology. Passenger Services Systems are part of the core business processes for airlines that were initially developed by the airlines themselves in the 1960s and 70s. Amadeus holds a market share of 31% in PSS4 business. Nowadays, the airlines application market has more recently shifted to third party suppliers, since there are now a number of quality offerings in the market. Some of the Amadeus’s competitors work on an outsourcing basis, outsourcing the in-house systems to a services seller which is uniquely developed to the client, but typically charges a fixed price.
2
OTA - Online Travel Agencies
3
GDS – Global Distribution System
4
PSS – Passenger Services System
42.3% global market share in GDS
31% global market share in PSS
AMADEUS ITHOLDINGS COMPANY REPORT
Source: Amadeus
99,40 %
0,50%
0,09% Free Float
Treasury shares
Board Members
Shareholder structure
Amadeus’ shareholder structure is composed 99.4% by free float, 0.09% by Board members and 0.5% by Treasury shares. The top 5 investors included in the company’s free float are MFS Investment Management (5.017% of direct voting rights), Government of Singapore Investment Corporation Pte Ltd (4.925% of direct voting rights), Blackrock Inc. (3.832% of indirect voting rights), Fidelity International Ltd. (2.069% of indirect voting rights) and Invesco Ltd (2.003% of indirect voting rights).
Global Distribution Systems Sector
3 major players, Amadeus, Sabre e Travelport, control the Global Distribution Systems sector worldwide. The three together hold more than 90%5 of the market, with the 4th participant having a market share of just 6%. This sector has some barriers to entry, as a large investment would be needed to replicate GDS technology. Historically capital expenditure required by Amadeus has been between 9-13% of its annual sales. Consequently GDS tends to an oligopolistic business. Amadeus is a clear global leader, currently holding a 43% market share, showing consistency in its market share gains over the years.
GDS, also known as Computer Reservation system, works as an intermediary between travel agencies and airlines. When a customer approaches an online travel agency searching for airlines tickets possibilities, these agencies access the airline’s inventory through the global distribution system supplied by companies like Amadeus. By connecting a large number of travel providers to a large number of travel agencies, the company helps to create value in the distribution chain. The more agencies airlines are exposed to, the more travellers
5
Numbers of travel agency air bookings according to Amadeus estimates. Figure 2: Shareholder Structure
Source: Amadeus
AMADEUS ITHOLDINGS COMPANY REPORT
0,0 200,0 400,0 600,0 800,0 1000,0 1200,0
-‐5000 0 5000 10000 15000 20000 25000 30000 35000 40000 45000
2007 2008 2009 2010 2011 2012 2013 2014
Airlines Opera8ng Profit (mils) GDS Contribui8on Margin (in mils)
Source: ICAO and Amadeus 4% 9% 14% 19% 24% 29% 34% 39% 44%
4% 6% 8% 10% 12%
Weighted Average ROIC
Max Cost of Capital
Min Cost of Capital
3,8 3,8 3,8
5,1 5,1 5,2
3,9 3,9 4,0
2012 2013 2014
Amadeus Travelport Sabre
Source: Amadeus, Sabre and Travelport
(weather business or leisure travellers) have access to their flights. In the travel agencies’ perspective, it allows them to have a wider range of products to offer their clients, therefore increasing their possibility of selling tickets. This is called the network effect (see appendix A). Currently, Amadeus has a customer base of travel providers of 705 airlines, more than 235,000 hotels properties, 248 tour operations, 44 car rental companies, 51 cruises and ferry lines, 90 rail operators and more than 18 insurance provider groups.
GDS follows transaction-based model. Travel providers provide their content to Amadeus, free of cost obtaining access the distribution system connecting the inventory system of travel providers to travel agencies around the world. When a booking is done, travel providers pay to Amadeus a booking fee. Concerning travel agencies, Amadeus offers real-time search, booking, ticketing back-office solutions specifically to TAs6. However travel agencies cannot afford to use more than one/two GDS systems: it requires training equipment and accounting complexity. Hence, when a booking is done, Amadeus pays an incentive fee to TAs, creating motivation in agencies to keep using its system. Travel agencies operating with Amadeus GDS platform pay an IT fee for technology and
functionality (Appendix B).
Revenue Inflows despite airlines’ performance
The bookings’ pricing level is defined based on the origin of booking with respect to the prime market of the provider, depending on the value it generates to travel provider: country bookings are the lowest value bookings, regional bookings are medium value and international are the highest bookings value. Amadeus was the pioneer GDS Company adopting this pricing model (in 2004) reasoning why it started gaining market share from Travelport and Sabre. Currently, all GDS firms use the same value-based pricing model. Bookings revenues have shown to be resilient since what drives fees are booking volumes made through TAs. The volume of bookings is linked to air traffic evolution, which in turn is correlated to GDP growth. Amadeus takes the commission fee regardless the price charged by the travel provider and so it does not depend on the providers’ revenues performance (figure 4 e 5): if airlines are keen to sell more seats to increase the load factor, they will have to lower the price charged by ticket, but the fee commission delivered to Amadeus will remain the same. In fact, it is actually positive for Amadeus that airlines lower their prices since number of bookings will increase, leading to higher revenues.
6
TA – Travel Agencies Source: Mckinsey for IATA Figure 4: Industry’s companies ROIC and Cost of Capital
Figure 5: Financial Performance
AMADEUS ITHOLDINGS COMPANY REPORT
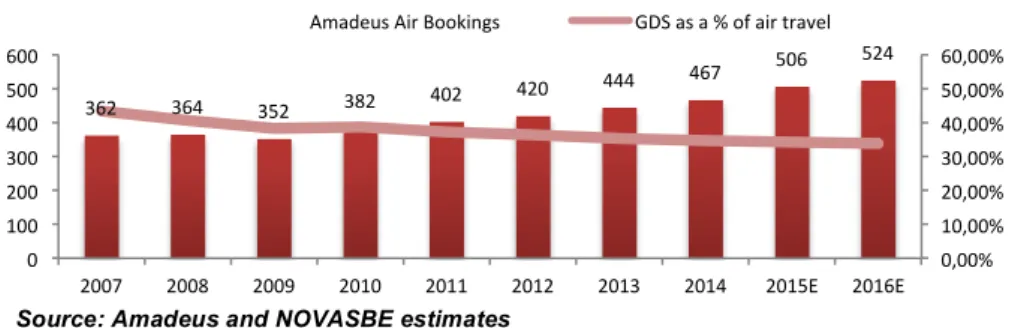
362 364 352 382 402
420 444 467
506 524
0,00% 10,00% 20,00% 30,00% 40,00% 50,00% 60,00%
0 100 200 300 400 500 600
2007 2008 2009 2010 2011 2012 2013 2014 2015E 2016E Amadeus Air Bookings GDS as a % of air travel
Source: Amadeus and NOVASBE estimates
41,3%
9,8% 13,3% 15,1%
7,0% 13,6%
Western Europe CESE
MEA APAC
La8n America North America
Source: Amadeus
0,0% 1,0% 2,0% 3,0% 4,0% 5,0% 6,0% 7,0%
2012 2013 2014
Sabre
Travelport
Amadeus
Source: Amadeus, Sabre and Travelport
43,0% 44,0% 45,0% 46,0% 47,0% 48,0%
700 800 900 1000 1100
2009 2010 2011 2012 2013 2014 Contribution Contribution Margin
Source: Amadeus
Amadeus GDS vs Industry
The Contribution of GDS presents a low volatility over the years also due to mix shift in value-based pricing model – average bookings fee has been gradually growing since 2009. However GDS contribution margin has been showing some deterioration signs with a decrease of 3.2% since 2009. GDS has been diminishing its share of air travel. This is fuelled by disintermediation from some airlines but also air travel is growing faster than online bookings. Despite the fact the GDS share of air traffic is weakening, Amadeus’s market share has been increasing over the past years and mainly in emerging markets: these are expected to drive growth in the upcoming years with Asia Pacific and the Middle East & Africa most likely to lead that growth. These 3 regions together weighted 35.3% of total air bookings in 2014.
International travel is the one that brings more value to bookings revenues and this segment continues to rise. It is harder for airlines to sell international flight tickets directly from their websites and so the best way to increase its high value flight selling is by GDSs. Therefore this segment is unlikely suffer disintermediation with international travelling being a consist driver for GDS.
Barriers to entry
As said before, this sector benefits from high barriers to entry due to its network effect. Hence, GDS companies benefit from the relation established between travel suppliers and travel agencies. Travel agency contracts range from 3-10 years for major travel agencies and 1-5 years for local travel agencies, providing good visibility to Amadeus’ customer base. Plus, the advanced technology that is constantly being upgraded requires high levels of investments.
Hence, if a new company wants to enter the business would have to face hard obstacles to succeed; (i) it has to get a wide airlines network to add to the platform; (ii) in order to negotiate with airlines the company would have to offer a low fee (since it still has a small costumer base) – thus travel agencies would be
Figure 8: Amadeus Geographic split of air bookings 2014
Figure 7: Amadeus bookings (millions) and Global GDS share of air travel industry
Figure 9: GDS revenues growth
AMADEUS ITHOLDINGS COMPANY REPORT
0 20 40 60 80 100 120 140
1949 1955 1961 1967 1973 1979 1985 1991 1997 2003 2009 2015
Source: ICAO and NOVASBE estimates
-‐20,00% -‐15,00% -‐10,00% -‐5,00% 0,00% 5,00% 10,00% 15,00% 20,00% 25,00%
-‐30000 -‐25000 -‐20000 -‐15000 -‐10000 -‐5000 0 5000 10000 15000 20000 25000
2000 2002 2004 2006 2008 2010 2012 2014
NetProfit (mils) Revenue Growth
Source: ICAO
receiving a lower incentive fee and it would most likely refuse to use the new GDS (recall travel agencies do not use more than one or two GDSs); (ii) even if travel agencies wanted to leave to the new company’s GDS, they would have to wait until the end of the contract they have with the current GDS supplier; delaying the migration to new entrance GDS and increasing the risk of failure.
Risk Factors
The main risk for travel distribution industry is the disintermediation. This has been fuelled by the increasing growth in market share gains of LCCs7, which sell their tickets partly through their own websites. Only when LCCs experience a slowdown in growth, they consider using GDS. On top of that, airlines have been trying to increase its bookings through direct channels. This is due to high costs airlines incur with GDSs: in 2012 it was estimated that roughly US$7 billion in GDS fees were paid by airlines, which was over twice the industry’s expected net profit for that year8 (figure 12). The GDS industry is growing at a slower pace than RPK-growth driving to the decline of the industry’s share of total bookings. However, airlines are also taking risk by not using GDSs. If the airline’s competitors are using the GDS and the airline company is not, TAs will not have access to the airline’s tickets so it is unlikely the airline tickets will be sold by them.
Amadeus also faces other risks, such as operational risk in the sense that it runs and manages its own data centre. If a failure in the system occurs, it could cause loose a part of the business. Finally, GDS have been experiencing many changes in regulations that affected its businesses and it is not free of changing again.
Understanding the GDS risks and the value of
network effect
Global distribution systems were born in the pursuit of satisfying the need to supply the increasing air traffic demand that airlines were enjoying in the 60’s – paper passenger lists and telephone confirmations were proving to be insufficient. At the time, initial investment of such technology would be comparable to the cost of buying six Boeing 707 jet airplanes - US$4.3 million each in 19559. The airlines that firstly developed a CRS experienced a reduction of 30% in reservations staff (decreasing operating expenses). This system, once installed in travel agencies, start to progressively increase passenger revenues
7
LCC – Low Cost Carrier
8
Source: The Economist: The ineluctable middleman (2012)
9
Source: Bowers, Peter M. Boeing Aircraft since 1916. London: Putnam Aeronautical Books, 1989 Figure 11: Global LCC presence
AMADEUS ITHOLDINGS COMPANY REPORT
Source: LSE article from 2014 “Losing access to online distribution platforms cost American Airlines more than $50 million in revenues”
for airlines, therefore encouraging other airlines to adopt the same technology and develop their own CRS.
Each GDS had different techniques to execute similar tasks. Hence, due to the complexity, equipment and training required; travel agencies would only accept to use 2 or 3 different GDS that allowed access to multiple airlines. Consequently, airlines start allowing their bookings into other carriers’ GDS.
The (airlines) owners of each GDS start revealing an opportunistic behaviour by setting their flights at the top of the system, that was consulted by TAs, regardless the charging fare – other airlines could be offering the same flight at a lower fare and would still appear after the owners. In 1983, in U.S., some regulations were established to regulate the business: owners of GDS were not allowed to rank flights based on carrier identity and they had to provide the same accurate and reliable information to all airlines and TAs enrolled in the platform. Additionally, all airlines that owned GDS business had to offer their content (flights) to all other GDS too.
By 2000, 15% of total bookings came from OTAs10 that were using GDS. Airlines assumed intermediation would eventually disappear and customers would buy flights from airlines’ websites. Thus, owners of CRS sold part or all of their participation of GDS companies. At the time, Lufthansa, Air France and Iberia sold part their Amadeus’ shares.
However, the loss of direct commission from airlines faced by travel agencies made them more beholden to GDS that besides offering back-office computing also pay them an incentive fee. In 2002 the U.S. suffered a deregulation that no longer obliged airlines that own a GDS to be signed in all other GDSs and GDS now could privately negotiate with each different airline/TA: airlines could only give to GDS their highest fares or could allow GDS to access lower fares and enjoy discounts on booking fees.11
Airlines efforts to bypass GDS were not succeeding. American Airlines, for instance, attempted to override GDS through to what they called at the time Source Premium policy: it planned to charged travel agencies a fee per booking made through GDSs except for bookings made through two specific GDSs the airline had a contract with that agreed to charge lower fees than other GDSs. Since contracts between TAs and GDSs are medium-long term, even if TAs wanted to leave the current GDS to migrate to one of the two GDSs suggested by the airlines, they couldn’t. American Airlines was then risking travel agencies to steer passengers to other airlines flights leaving the company worse off than
10
OTAs – Online Travel Agencies
11
Source: Benjamin Edelman. Distribution at American Airlines, 2009 Figure 13: change in Results of
AMADEUS ITHOLDINGS COMPANY REPORT
79% 88% 90% 90% 88% 89% 21% 12% 10% 10% 12% 11%
0% 20% 40% 60% 80% 100% 120%
2009 2010 2011 2012 2013 2014 Non-transactional Revenues
Transactional Revenues
Amadeus
Sabre
Navitaire
Others
963
589
148
2014
Amadeus Sabre Navitaire
when it was paying normal GDS fees. Hence, the company decided not to go forward with this policy.
In 2011, American Airlines attempted again to escape to GDS fees. The company created its own reservation system to permit travel agencies to access the carrier’s inventory avoiding the GDSs. In response, most GDSs blocked the access of their platforms to the airline’s inventory. Consequently, during the first quarter of the same year, the carrier was not capable of selling several tickets to OTAs leading to a huge reduction in revenues, load factors, passengers and flights as it is shown figure 13. The revenue loss incurred during this quarter is estimated to be over than $50 million.12
IT Solutions Sector
IT solutions play an important role in tourism and air travel industry. Amadeus detains 31% of market share within the full service PSS business. The extensive portfolio of technology solutions allows airlines to address its key operational requirements to optimize financial and management performance. Altéa suite, Amadeus’s PSS, is composed by Altéa Reservation, Altéa Inventory, Altéa Departure Control and e-commerce.
In figure 14 Amadeus’ share of reservation systems does not correspond to Amadeus estimated market share because Amadeus is not competing in the LCC segment, the same way that Navitaire, for instance, is not in the full service need.
Altéa Reservation delivers an all-in-one service across all sales channels through reservation technology between airlines and travel agencies. It enables airlines to manage their books, fares and tickets. Altéa Inventory is used to enabling the airline to manage and control availability in real time by planning schedules, monitor seat capacity and connected fares on a flight-by-flight basis. Altéa
Departure Control allows flight departure monitoring as customer check-in, baggage management, and other functions related to passenger flight boarding. E-commerce focuses on delivering a wide range of solutions that aids airlines to lower distribution costs and compete effectively in the fast-growing online market. Additionally, Amadeus offers a range13 of IT solutions to support airlines in procedures related to customers, such as Amadeus Ticketing Platform, Revenue Integrity, Payment Solutions, Revenue Management, Ticket Changer, Airline Ancillary Services, Electronic Miscellaneous, Passenger Revenue Accounting and Loyalty, etc. Although these solutions have been designed to incorporate
12
Source: LSE article from 2014 “Losing access to online distribution platforms cost American Airlines more than $50 million in revenues”
13
Range of IT solutions also refered as modules Figure 14: Reservation Systems’ 2014
share of passengers boarded
Source: Amadeus
Figure 15: Revenues in millions of Eur
Figure 16: Amadeus percentage of transactional and
non-transactional revenues of IT sales Source: Amadeus, Sabre and Navitaire
AMADEUS ITHOLDINGS COMPANY REPORT
124 193 238
372 439
564 616 695 751
808 -1% 5% 10% 15% 20% 0 200 400 600 800 1000
2007 2008 2009 2010 201
1
2012 2013 2014
2 0 1 5 E 2 0 1 6 E
Amadeus Passangers Boarded
YoY air passenger demand growth
Source: Amadeus, ICAO and NOVASBE estimate
183 238 225
411 380 288
0 100 200 300 400 500 600 700
Sky Team Star Alliance
One World Airlines using Altéa Other Airlines
Source: Sky Tam, Start Alliance, One World and NOVASBE estimates
1,6%
1,5% 1,5% 1,4%
0,7%
0,6% 0,6% 0,8%
0,5% 0,9% 1,3% 1,7%
2011 2012 2013 2014
IT operating spend IT capital spend
Amadeus Altéa suit, airlines have the ability to choose which solutions and features they need to integrate their systems and so those solutions can also be used on a stand-alone basis with other in-house or PSS systems supplied by other companies.
Strong market fundamentals
Amadeus operates under a transaction-based business model linked to global travel volumes. IT solutions business is mainly driven by transactional revenues (89% of IT solutions revenues in 2014 in figure 16) thus depending on the number of passengers boarded in each one of the airlines the company has a contract with. Amadeus also profits from non-transactional revenues that refers to services like consulting and implementation of Amadeus technology. According to the Air Transport Industry Insights report done by SITA14, the airline IT spend as a percentage of revenues has remained stable over the years (around 1.5% over the last 4 years – figure 17) and is expected to be kept like this in the following time. Airlines’ revenues have been increasing; meaning the market for technology in air transport has been rising (figure 18).
The pricing model allows airlines the possibility of replacing fixed R&D and maintenance cost by a variable cost that vary with passenger volumes, thereby better matching the airlines’ revenue. This model also links Amadeus’ revenue to global travel volumes instead of linking it to travel spending, thus reducing the volatility Amadeus’ operating results.
Amadeus Altéa Suite is the main IT platform provider of two thirds of Star Alliance members, three quarters of one world carriers and more than of the members of SkyTeam (figure 19). These represent roughly 90% of total passengers boarded in 2014. The Amadeus Altéa Suite facilitates closer integration between partner airlines that need to share availability, fares, and customer and booking information, enabling a seamless customer experience across alliance members.
The Amadeus Altéa approach entails continuous upgrades, having the ability to respond to changes in market conditions. It provides IT solution to different level of air transport sophistication: airlines carrying 70 million to below 1 million passengers annually. The customer base for Altéa has been growing and has quite good expectations of migrations in a near future. Major airlines such as Japan airlines and Southwest (domestic flights), that are expected to migrate to
14
SITA is an arline IT solutions provider Figure 17: IT & Telecoms spend as % of airlines’ revenue
Source: SITA
Figure 18: Amadeus’ PB vs Passenger demand growth
AMADEUS ITHOLDINGS COMPANY REPORT
94 100 109 114
124 125
15 15
12 11
8 10
0 20 40 60 80 100 120 140 160
2010 2011 2012 2013 2014 2015E Contracted Airlines not yet migrated
Airlines already migrated to Altea
Source: Amadeus and airlines’ websites
45,8%
5,1% 14,5% 10,5%
24,0% 0,1%
Western Europe
Central, Eastern and Southern Europe Middle East and Africa
La8n America
Asia & Pacific
73,4% 26,6%
63,28 % 36,72
%
GDS IT Solu8ons
Figure 22: Amadeus future migrations/exits
349,5 409,5 455,9
497,1 550,7
702,2 791,5
936,1
64% 68%
73% 70% 70% 73% 73% 74%
50% 70% 90% 110%
0,0 200,0 400,0 600,0 800,0 1000,0
2009 2010 2011 2012 2013 2014 2015E 2016E
Contribution % over net revenues
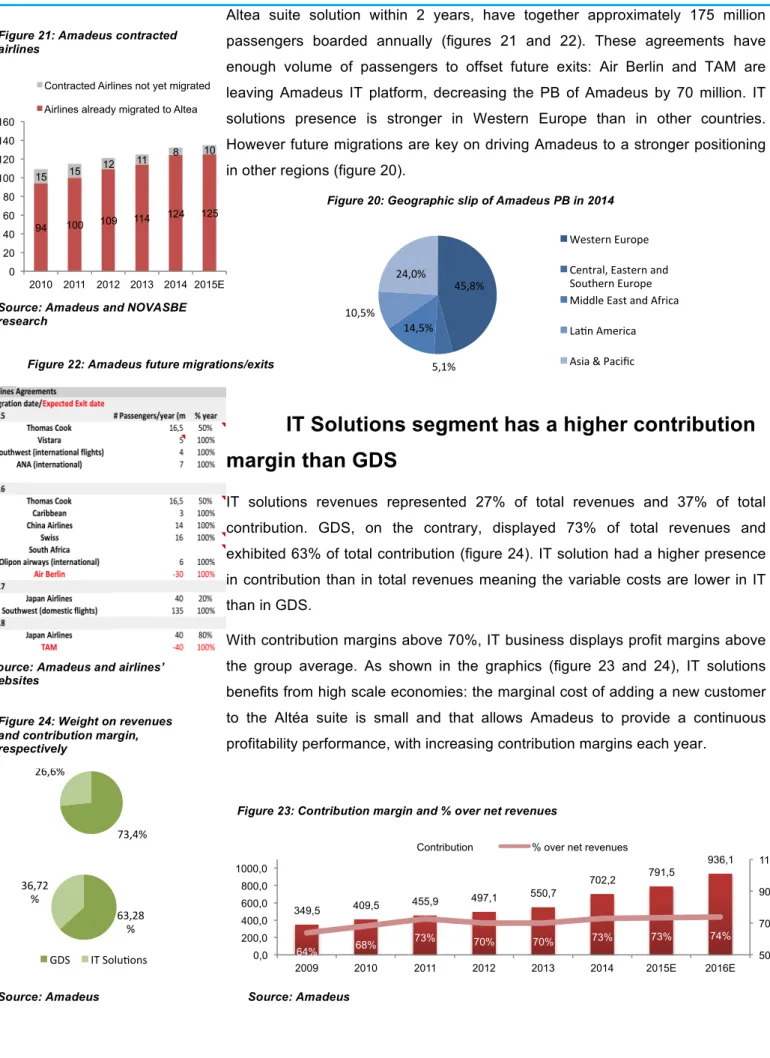
Altea suite solution within 2 years, have together approximately 175 million passengers boarded annually (figures 21 and 22). These agreements have enough volume of passengers to offset future exits: Air Berlin and TAM are leaving Amadeus IT platform, decreasing the PB of Amadeus by 70 million. IT solutions presence is stronger in Western Europe than in other countries. However future migrations are key on driving Amadeus to a stronger positioning in other regions (figure 20).
IT Solutions segment has a higher contribution
margin than GDS
IT solutions revenues represented 27% of total revenues and 37% of total contribution. GDS, on the contrary, displayed 73% of total revenues and exhibited 63% of total contribution (figure 24). IT solution had a higher presence in contribution than in total revenues meaning the variable costs are lower in IT than in GDS.
With contribution margins above 70%, IT business displays profit margins above the group average. As shown in the graphics (figure 23 and 24), IT solutions benefits from high scale economies: the marginal cost of adding a new customer to the Altéa suite is small and that allows Amadeus to provide a continuous profitability performance, with increasing contribution margins each year.
Source: Amadeus Figure 21: Amadeus contracted
airlines
Figure 24: Weight on revenues and contribution margin, respectively
Figure 20: Geographic slip of Amadeus PB in 2014
Source: Amadeus and NOVASBE research
Source: Amadeus
AMADEUS ITHOLDINGS COMPANY REPORT
244,6 325,8 344,4
414,1 500,4 527,1
557 620
0% 5% 10% 15% 20% 25%
0 100 200 300 400 500 600 700
R&D Investment % sales
High Barriers to Entry
IT Solutions also benefits from high barriers to entry due to the length of contracts: travel providers typically sign long-term contracts with 10-15 years duration15. Switching of IT platform can be very costly for airlines: additional costs of training and the opportunity cost of the employees’ time spent on learning the new technology. Barriers to entry are further enhanced by high capital expenditure requirements: the more airlines migrate to Altéa, the more Amadeus will be benefiting from further economies of scale and other players may therefore find it challenging to take market shares away from Amadeus. Over the years, many airlines have tried to develop these systems in-house but most of them ended it up by outsourcing IT platform since it was too costly develop their own because airlines would not enjoy economies of scale – Amadeus has multiple customers.
IT Solutions mitigates risk in distribution
Amadeus, Travelport and Sabre started offering IT solutions to Airlines to reduce the risk impact in GDS. Travel distribution is subject to a number of risks that we discussed above in this report. The most well known is the on going disintermediation. IT Solutions business mitigates disintermediation: the clients concentration remains high in IT Solutions, thus reducing exposure to travel distribution through revenue diversification.
Over the last 10 years, airline industry has been facing some consolidation mainly due to the difficulty of performing well within an underperforming sector. Take for example airlines based in U.S such as American, Delta, United and Southwest; that control nearly 86% of domestic flights16. Further consolidation may represent a risk for companies like Amadeus: on the GDS side, disintermediation can increase. On the other hand, IT solution companies might loose their bargaining power when negotiating the migration features. However, IT solutions enjoy long term contracts that allow Amadeus to secure its expected revenues for many years. Plus, over the last years, with the ongoing consolidation, what the market trend have been to migrate from in-house developed PSS to a third party platform provider. However, governments will keep controlling the market, by creating regulations that minimize consolidation.
15
Source: Amadeus
16
Source: “Airline industry: Consolidation calls for regulation” 2015, Global Travel Industry News Source: Amadeus and NOVASBE
research
AMADEUS ITHOLDINGS COMPANY REPORT
102 105
117
128,9 134 4,19% 4,30%
4,90% 4,41%
5,07%
0% 1% 2% 3% 4% 5% 6%
0 20 40 60 80 100 120 140 160
2010 2011 2012 2013 2014
Airport industry revenue in Bn$
Total IT&T spend as % revenue Figure 26: Total IT & Telecoms spend and airport
Thus, barriers to compete between airlines won’t go down and companies like Amadeus are protected from regulation17.
Airport IT
Amadeus started its Airport IT business in 2013: an integrated suite of solutions for airport operations. Airport IT spend has been rising and valued approximately 6.7 billion of US$. The leading companies offering IT solution are Amadeus, Rockwell Collins, SITA and Ultra Electronics Airports Systems. Since this market is highly concentrated, these companies are trying to differentiate their offering through cost effective solutions.
This segment has been growing at a good pace for Amadeus: Munich Airport, Copenhagen Airport and MAP Handling were the pioneer customers for Amadeus. Amadeus is investing heavily to build a comprehensive airport IT portfolio. In 2014 it acquired UFIS Airport Solutions, a leading player in the airport IT business for the last 20 years, during which time the company has won the trust of major airports across the world.
Until now, Amadeus has experienced a continued momentum in the market with its ACUS offering (Amadeus Airport Common Use Service). In 2015, Amadeus got its first customer in Australia, Perth airport that expects to reduce its passenger costs by 26% with the implementation of ACUS. Perth airport is fourth busiest airport in Australia by passenger traffic with over 14 million passenger per year. Also in the current year Amadeus signed an agreement with the Avinor Group, which is operating 46 airports in Norway, to adopt its ACUS.
Hotel IT & Rail IT
Amadeus is developing hotel management solutions to enable hotel business and brand revolution. So far Amadeus has acquired two companies core in this business: (i) Newmarket – provides of cloud-based group and event IT solutions to the hotel industry and serves around 22,000 properties in 154 countries; (ii) Netherlands-based Itesso BV, a provider of cloud-native property management systems (PMS). Itesso currently provides PMS technology to 1,800 properties worldwide.
The rail industry is in expansion: high-speed rail networks are expanding due to liberalization in Europe and consumer demand for rail travel is increasing. Amadeus currently works with more than 90 railways on local and global solutions. It had over 30 million rail booking last year across 195 different countries.
17
AMADEUS ITHOLDINGS COMPANY REPORT
56% 38%
6%
LCCs
Hybrid
Charter
83%
5% 1% 11%
PSS
Accounting Solutions
Loyalty management
Specif projects/ services
432
508
490
2013 2014 2015E
Recent M&A: Navitaire
On July 1 2015 Amadeus has agreed to acquire Navitaire, an IT solutions company, for US$830m; at 14.2x current year FCF and 13.8x current year EBITDA. The transaction will be 100% debt financed. Amadeus’ acquisition of Navitaire will result in proforma Net Debt/EBITDA for Amadeus of 1.6x 2015E. Navitaire delivers industry-leading technology services for low-cost and hybrid-carrier segments of the airline industry and has a global customer base of more than 50 operators in 29 countries throughout EMEA, APAC, Latin America and North America. Some of its clients are Ryanair; Vueling; Jetstar; GermanWings; AirAsia. It serves its customers through a transaction-based model and provides its solutions as software-as-a-service. Navitaire has developed loyal customer relationships - average client retention rate of 95%. The company's key competitors include Sabre, SITA and Radixx. The products offered by Navitaire include its PSS (83% of revenue), Revenues accounting solutions (5% of revenue) and loyalty & yield management (1% of revenue). The outstanding 11% of revenues is related to specific services/projects. PSS customer split: 56% LCC; 38% Hybrid; 6% Charter.
Navitaire is geographically complementary to Amadeus Airline IT business, bringing a set of customers which is based throughout the globe and with headquarter operations in the U.S. Amadeus plans to run Navitaire mostly as a separate business from the rest of Amadeus’ Airline IT business, maintaining differentiated brands.
Amadeus expects to reap the benefits of synergies from all opportunities related to cross-selling and upselling and from the ability to deliver a double PSS offering to Amadeus’ airline group: (i) These two companies have complementary products that can be a benefit to both segments. In some cases, Navitaire is not running some of the products Amadeus has with Altéa. Moreover, Navitaire has developed functionalities for the LCCs that could be valid for some of Altéa’s customers. (ii) In terms of evolution, there are some customers that may decide to evolve from a simple functionality – that is what Navitaire is providing – to something that is more complex, like Altéa (but this will depend a lot on the business evolution of the customer). (iii) There could also be distribution opportunities, bringing some of LCCs into Amadeus distribution platform – it is happening in the industry that LCCs are much keener of being part of the travel agency community.
Figure 27: Navitaire’s PSS customer split
Figure 28: Navitaire's revenue split Source: Amadeus
Source: Amadeus
Figure 29: Navitaire’s PBs
AMADEUS ITHOLDINGS COMPANY REPORT
12% 13% 14% 16%
18% 19% 20% 21%
23% 24% 25% 26%
0% 5% 10% 15% 20% 25% 30%
2003 2004 2005 2006 2007 2008 2009 2010 201
1
2012 2013 2014
9,20% 9,20% 9,20% 8,10% 7,40%
8,20%
0% 5% 10% North America Middle East
Africa La8n America
Europe Asia
Figure 30: LCCs share of Global Airlines seats sold
3,60%
96,40%
Navitaire
Amadeus 4,40%
95,60%
Figure 31: Weight of each company on Amadeus’ group revenues and EBITDA, respectively
Navitaire had 508 million PBs in 2014; 15% growth YoY; and according to Amadeus the company expects 490 million PB’s in 2015. The expected organic growth is positive but what impacted those PBs for Navitaire was AirTran exit as a result of its acquisition by Southwest.
CAGR 2015-2019 of Navitaire’s PBs is expected to be between 7%-9%. If in 2019, Navitaire’s PBs volume is 667 million (assuming constant growth of 8% annually) and 10% of LCC decide to join GDS; Amadeus could experience an increase of nearly 67 million passengers in its system, leading to higher bookings revenues.
From segment approach, Amadeus is not competing in the LCC segment, the same way that Navitaire is not in the full service need. Therefore, Amadeus is not competing with Navitaire and nor the contrary. Navitaire will represent approximately 4.4% of Amadeus revenue and 3.6% of EBITDA (figure 31): Navitaire average transactional fee per PB is around 0.37Eur, way lower than the average fee charged by Amadeus: this enhances the different market target of each company and also the distinctive products each company offers.
Navitaire has added a number of new clients every year and Amadeus expects this to continue over time. Navitaire just announced VivaAerobus chose Navitaire for its industry-leading technology platform. This LCC carried nearly 4 million passengers in 2014. Moreover, with the complementary fit between both platforms, Amadeus believes it can provide an enhanced solution to the industry, especially to alliances for groups with different range of carriers share business, which is becoming more and more common, and we expect this to accelerate growth in the future for Navitaire. We would expect the company to benefit from an increasing share of business with low-cost carriers (figure 30).
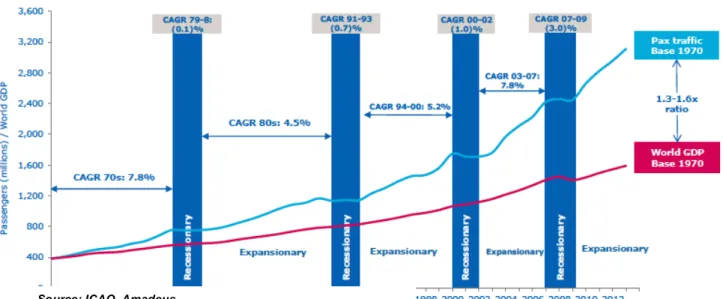
Air Travel Trends
WORLD
Globalization and economic growth have been linked to air traffic growth since the beginning – one cannot go without the other. Has shown in the graphic below, air traffic has been consistently rising at a multiplier of the world real GDP growth valued between 1.3 - 1.6x18. With a total of 3.3 billion passengers carried last year, the contributions of travel and tourism to GDPs in each different region in 2014 (figure 32) were in the range 7.4%-9.2%19, highlighting the importance of the sector to economic expansion. Emerging markets are clearly the ones
18
Source: Amadeus
19
Source: World Travel & tourism council Source: World Travel & Tourism council
Source: IATA, CAPA and OGA
Source: Amadeus and Navitaire
AMADEUS ITHOLDINGS COMPANY REPORT
1,50%
6,70% 5,70%
5,90%
12,80% 3,00%
5,90%
0,00% 5,00% 10,00% 15,00%
World North America Middle East
La8n America and the Caribbean Europe
Asia and Pacific Africa
Figure 33: World GDP and Air traffic demand
Figure 34: Air Traffic Growth
bringing more opportunities to growth within airline industries. Despite the progress and growth in EM20, North America and Europe airlines are the leading regions that carried more than half of global aviation. In 1994 North America and Europe airlines possessed approximately 73% of the world traffic but it is estimated that within 20 years, in 2034, their combined market share will drop to 38% with Asia Pacific and Middle East airlines capturing market gains in world traffic21.
In each different region, airlines are faced with different market conditions regarding specialized requirements. Still, they all face many common challenges such as oil price volatility (decisions on weather airlines should hedge this risk and but which amount), emission control regimes, increasing airport congestion, technological change and the growth of low cost carriers. These fluctuations affect aviation around the world.
Over the past years, LCC gained short-haul market share and have been driving single-aisle growth: they have been able to provide an ampler range of destinations. Due to the speedy expansion of LCCs it is expected that by 2034 LCC’s will enjoy market share gains in air traffic of 21%22. During the last year, Amadeus has made distribution agreements with 15 new hybrid and LCCs – to date 79 LCCs have become Amadeus distribution partners. Bookings from travel agencies on LCCs were up by 16% year-on-year during 2014.
20
EM – Emerging markets
21
Source: Boeing - Current Market Outlook 2015-2034
22
Source: Airbus - Global Market Forecast Book Source: ICAO, Amadeus
AMADEUS ITHOLDINGS COMPANY REPORT
68,30% 77,40%
80,40% 77,80% 77,70% 83,50% 79,50%
0% World 50% 100% North America
Middle East
La8n America and the Caribbean Europe
Asia and Pacific Africa
2%
31%
27% 5% 9%
25%
Africa Asia and Pacific Europe
Latin America and the Caribbean Middle East
North America
Figure 35: Airlines’ Load Factors 2014
Figure 36: Air Traffic Market Share in 2014
Figure 37: Air traffic International Market Share in 2014
3%
27%
38% 4% 14%
14%
Africa Asia and Pacific Europe
Latin America and the Caribbean Middle East
North America
In 2014 RPK23 performance grew nearly 6%24 - airlines’ load factors were closed to 80%: efficiency and customer experience within airlines are partly due to IT spend by airlines, weather its in-house developed or through a third party.
ASIA
Each year there are approximately 1 billion passengers flying to/from/within Asia and it is expected that up to 2034, 100 million passengers will enter the market per year25. This increase in demand will lead to a higher number of airlines supplying passengers and to an upsurge of airports. Airlines’ capacity has grown 7% annually and although North America and Europe hold the biggest share of the market, Asia’s network carriers include some of the largest and oldest airlines in the world, including Korean Air, Air China and JAL.
Over the past 10 years, LCCs ‘ average annual growth has been 24.5% compared to a 2.2% and 13.4% growth in North America and Europe, respectively26. LCC presents penetration of approximately 60% in domestic markets in Emerging countries within the region, one of the highest penetration rates when compared to other regions27. From the top 15 successful LCCs in Asia, Navitaire supplies IT platform to 6 LCC and Amadeus to 3.
Regarding future demand, it is estimated that Asia will be the largest travel market in the world, growing at 6.1% annually over the next 20 years. The bookings increase of Amadeus in Asia-Pacific has been driven by the contracts with powerful Asian airlines such as Singapore Airlines, EVA Airways, Garuda Indonesia, Thai Airways, Asian Airlines, All Nippon Airways – the international passengers business and Korean Air. This shift towards Asia-Pacific will continue, as we have a number of migrations of Asian carriers million passenger per year.
EUROPE
During 2014, Europe’s GDP grew by 1.4% but it is expected that up until 2034, the region will grow 1.8%, with an increase of 3.8% per year in air traffic. Airlines are performing well in Europe and according to the Association of European airlines; its members carried more 4.1% passengers in 2014 compared to the year before. However LCCs play an important role in passenger traffic as members of European Low Fares Airline Association presented a 9.1% growth regarding passenger traffic over 2013. Roughly 51% of both GDS bookings and passengers boarded on Amadeus’ platforms come from Europe, meaning
23
RPK – Revenue Passenger Kilometres, often used to measure air traffic growth
24
Source: ICAO
25
Source: Boeing - Current Market Outlook 2015-2034
26
Source: Boeing - Current Market Outlook 2015-2034
27
Source: Airbus - Global Market Forecast Book Source: ICAO
Source: ICAO
AMADEUS ITHOLDINGS COMPANY REPORT
1%
38%
9% 7% 1% 44%
Africa Asia and Pacific Europe
Latin America and the Caribbean Middle East
North America
31%
31% 10%
17% 11%
North America Europe
Middle East & Africa Asia Pacific Latin America
Amadeus it is still highly dependent on air traffic performance in Europe. Navitaire will help to diversify this concentration along with future migrations and contracts in EM.
NORTH AMERICA
In North America, airlines’ net income represented in 2014 two thirds of the projected net income for the entire global aviation industry28 One of the main drivers of such performance was the oil prices reduction that by decreasing operating expenses, pushed earnings up. Traffic passenger for network airlines and LCCs increase of 2.5% and 3.6%, respectively.
The long term air traffic outlook for North America is positive with an expected market value of US$640 billion supported by a forecasted grow of 3.1% per year. Although NA is one of the regions where Amadeus has a weaker presence, this optimistic outlook in the region is positive for Amadeus: Southwest, an airline that carries 135 million passengers annually, signed a contract for Amadeus Altéa
Suite to support the carrier’s US domestic operations. Southwest wishes to fully
migrate to the Amadeus Altéa platform for both international and domestic flights
in the coming years.
MIDDLE EAST & AFRICA
Nearly 80% of the world’s population live within an 8 hours flight from the Gulf. This positioning allows Middle East carriers to gather traffic at its major centres and offer direct routes to passengers. Nevertheless, the region is still facing some obstacles to air traffic growth since large sections of airspace are under military control thus reducing the potential growth of commercial aviation. Nevertheless, MEA29 was the 3rd biggest market in GDS, with a share of global air bookings made through GDSs of 10% in 2014: the region presented the highest increase in total capacity of 12.5%30. Over the next years, domestic market growth will be remarked, stimulated by long-term economic expansion of 3.8% GDP growth per year. The projected outlook of annual air traffic growth for the region over the next 20 years is 6.2%31.
Africa has the fastest urbanization rate at 82%: despite the fact that has the lowest urban population (40%), its average has been increasing for the past 25 years – 3.5% annually – with growth estimation over the next 25 years of 3.1%. The population inflow that will be felt in major cities will lead to an increase in
28
Source: IATA
29
MEA – Middle East and Africa
30
Source: ICAO
31
Source: Boeing - Current Market Outlook 2015-2034 Source: ICAO
Figure 38: Air traffic domestic market share in 2014
Source: ICAO
AMADEUS ITHOLDINGS COMPANY REPORT
spending on infrastructures, services etc. and will push productivity up along with disposable income, promoting economic expansion.
Besides, two thirds of Africa countries are currently considered by the World Bank middle income or higher income - Africa’s economy has been growing at a rate of approximately 4.5% regardless of global economic crisis. Long run GDP growth is expected to remain stable at 5% with a yearly air traffic increase of 6%.
LATIN AMERICA
Last year, Latin America air travel grew by 5.9%. Latin America is the second largest urban population in the world real GDP growth over the next 20 years is projected to average 3.6%. One stimulates the other as together they increase the propensity to travel in the region.
The two largest economies in Latin America are Brazil and Mexico. Future expectations on traffic growth are supported by an agreement reached between US and Brazil, implemented in October 2015, where they agreed an open-skies aviation regime, which will liberalize US-Brazil air services for airlines consequently boosting Brazil’s air travel growth32. Hence, the long-term air traffic for Latin America is expected to remain stable at 6%33.
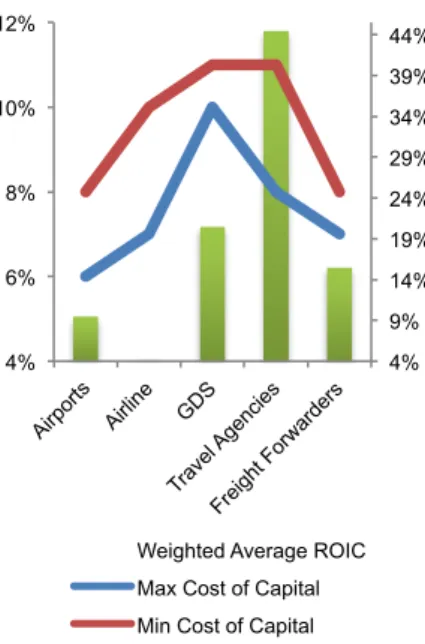
Financial Performance
If by on side GDS is one of the sectors in air travel that generates a higher gap between ROI and WACC (figure 32), airlines on average have been destroying value for its equity investors instead of creating it. The underperforming results have been one of the drivers of disintermediation: airlines start cutting costs by leaving GDSs. However, tendency shows that WACC have been declining over time with ROI increasing for the past 3 years. According to IATA airlines industry will present a larger ROI than WACC in 2015; not only because air travel perspectives for this year are very positive for airline profitability but also WACC is expected to lower in line with the drop of bond yields34.
Online Travel Agencies
The world is technologically much more evolved compared to a 15 years ago, and that can be proven through the information provided in figure 42: nowadays, 46% of the world population is considered an Internet user and 48% of total internet users are Asians (figure 41). OTAs were probably the first companies to understand the potential of online channels for selling travel products and
32
Source: U.S. Department of Transportation
33
Source: Boeing - Current Market Outlook 2015-2034 34
Source: Economic Performance of the Airline Industry mid-year 2015 forecast - IATA Figure 40: Airlines WACC&ROIC
AMADEUS ITHOLDINGS COMPANY REPORT
10%
48% 18%
4% 9%
10% 1%
Africa Asia Europe Middle East North America Latin America / Caribbean Oceania / Australia
Source: Internet World Statistics
28,20% 40,00%
73,50%
52,20% 55,00% 87,90%
73,20%
46,10%
0,00% 10,00% 20,00% 30,00% 40,00% 50,00% 60,00% 70,00% 80,00% 90,00% 100,00%
Africa Asia Europe Middle East
Latin America / Caribbean North America Oceania / Australia WORLD TOTAL
Source: Internet World Statistics
services like airlines, car rental, cruise lines, hotels, railways and vacation packages on behalf of suppliers.
The enviable margins some OTAs presented in the beginning brought many players into the market, increasing the competition. In order to gain market share, OTAs many times provided too large discounts on bookings incurring losses and starting a price war, which can lead either to local and regional players dropping out or to consolidation of OTAs.
The U.S. online travel market is growing at the slowest pace compared to other economies such as Europe, Latin America and Asia-Pacific. Nevertheless it remains the biggest market in terms of online travel sales. Expedia (largest OTA in U.S), that is about to complete the acquisition of Orbitz (belongs to the top 4 OTAs in U.S.), will capture more than 75% of U.S. OTA gross bookings. The company will have only one direct competitor - Priceline35. The U.S market shows signs of maturation in the OTA market. Consolidation of OTAs might be a risk to Amadeus regarding the decrease of its bargaining power towards OTAs: it might have to pay higher incentive fees.
Meanwhile, the European market is still highly fragmented but also maturing. Facing a completely different scenario, OTAs in Asia are experienced the fastest growth across the globe, presenting a massive increase in online gross bookings of 24% reaching US$37.7 billion in 201436. PhoCusWright estimates that the share of online channels in travel bookings will be 43% by the end of 2015 increasing the number of bookings done through GDSs.
Financials
GDS
Revenues from GDS business are generated by segment booking fees. An air segment fee follows a value-based pricing model and there for it is defined depending on the value it brings to the airlines - flying outside the airlines region is more valuable than flying to a another country within region. Similarly, flying to foreign country is more valuable than flying than domestic flights. The key drivers that steer air bookings revenues are real GDP growth rate, airline traffic multiplier (assumes traffic grows at a multiplier of the GDP), rate of disintermediation, Amadeus GDS market share and booking fee.
To estimate the air traffic multiplier we run a regression between the world GDP growth rate and the air traffic growth with data from 1991. The coefficient obtained was 1.45 with a confidence interval at 95% of [1.22; 1.68]. According to
35
Source: Can European OTAs Survive the Big Squeeze?- www.pata.org
36
Phocuswright - Asia Pacific Online Travel Overview Eighth Edition: Online Travel Agencies (an Asia Pacific and Global Edition publication).
Figure 42: Penetration in Internet (%of population) in 2014
AMADEUS ITHOLDINGS COMPANY REPORT
3,82 3,81 3,93 3,94
4,02 4,06 4,06 4,05
3,7 3,7 3,8 3,8 3,9 3,9 4,0 4,0 4,1 4,1
Figure 43: Global GDS as a % of global air travel
0% 10% 20% 30% 40% 50%
2007 2009 2011 2013
2015E
2017E
2019E
2021E
2023E
2025E
Figure 44: Average Booking fee
the data used, air traffic have been raising at a 1.45x the world GDP. The coefficient of determination is approximately 82.63% revealing the explanatory level of the world GDP growth regarding traffic growth. We assumed this year the air traffic multiplier is 1.46 (it has been rising for the past years) but then during the next 10 years we’ve forecasted an increase on traffic multiplier of 0.005 in each of the following years because within 20 years air traffic growth will be 1,58x the world GDP rate mainly driven by emerging markets that have not yet reached their potential37. To adjust for the risk of further disintermediation we have deducted 0.5% in percentage of GDS in air travel each year (figure 43):
•Firstly, air travel has been growing at a higher pace than GDS market – the increasing growth of LCCs worldwide impacts the entire industry. They not only take market shares (mostly domestic) from airlines thereby affecting financial performance of the airlines; but also typically distribute a large proportion flight tickets through their direct channels. LCCs typically adopt an indirect channel distribution strategy only as they grow and become more mature, seeking to access higher yield customer segments.
•Secondly, despite the fact airlines would incur a huge loss if they leave GDS systems, the bookings growth in suppliers website has been raising. The increasing penetration on Internet has facilitated airlines selling through direct channels. Airlines allocate incentives to customers in the form of extra frequent-imposing a fee on tickets sold through 3rd party distributors – the latest announcement made by Lufthansa regarding GDS fees suggested it would start imposing a 16Eur charge on external reservations, penalising travellers and making their system less competitive.
Amadeus has been exhibiting market share gains at a stable pace through the years. Thus, it is expected the company to keep the same rhythm over the next 5 years showing market share increases of 0,5% yearly and then its kept at 45%. Considering the assumptions above referred, we got the forecasted Amadeus Air bookings for each year until 2025.
Average booking fee showed a healthy evolution over the years, except for 2009 due to the economic downturn (figure 44). The increase in average book fee is impacted by forex fluctuations and the increase of international travel (higher value bookings). During the next 5 years it was assumed a dilution of 1% annually due to new airlines agreements that will increase regional and local booking. From 2020, it was estimated the average booking fee remains stable at 4.05Eur. Hence, total Air bookings revenues were obtain by multiplying the estimated average booking fee per expected number of air bookings made through Amadeus GDS.
37
Boeing - Current Market Outlook 2015-2034 Source: Amadeus and NOVASBE
research
AMADEUS ITHOLDINGS COMPANY REPORT
Non-Air bookings revenues were forecasted assuming a constant growth of 1% over the years. This segment only counts of about 10% of total booking revenues and has been decreasing its share in revenues over the years. Although Amadeus is trying to expand GDS business into other markets, it is still premature to know how big the impact is going to be on total revenues because it takes time to get travel providers and travel agencies due to network effect in companies where non-air booking are their core business.
Other revenues of GDS refer to subscription fees paid by travel agencies for the use of Amadeus’ GDS. These are expected to growth at a constant rate 0.8%, the average growth of the past five years.
The increasing threat of OTA consolidation might lead to a reduction of the GDS margins. OTAs are gaining bargaining power over GDS businesses and Amadeus might have to pay higher incentive fees. Hence, the operational costs were set to increase at the same rate bookings are growing, decreasing the contribution margin of GDS over the years.
IT SOLUTIONS
IT solutions revenues are divided into airlines IT service, airports IT service, Hotels IT and Railway IT.
In Airlines IT revenues are divided into IT transactional, direct distribution and
non-transactional. IT transactional revenue refers to Altéa suite and e-commerce. PBs organic growth was settled to rise at the same rate of air travel, based on increase diversification of the portfolio of airlines using Altéa and the ones expecting to migrate in a near future. The uplift in PBs due to additions of signed contracts to date was allocated to the expected migration year (as shown in figure 21). IT transactional fee is estimated to suffer a decline over the next two years and then remain flat due to cross selling of new modules: the decline in transactional fee is due the entrance of hybrids (like Southwest) in the Altéa community; whose are charged lower fees. Direct distribution relates to the single
reservation solution and expects to growth at the same pace of air travel. Non
-transactional revenue relates to implementation fees for new Altéa clients. We
assume this segment will grow at 3% over the next 10 years keeping the historically pace.