THIS REPORT WAS PREPARED EXCLUSIVELY FOR ACADEMIC PURPOSES BY [INSER STUDENT’S NAME], A MASTERS IN FINANCE STUDENT OF THE NOVA SCHOOL OF BUSINESS AND ECONOMICS.THE REPORT WAS SUPERVISED BY A NOVA SBE FACULTY MEMBER, ACTING IN
A MERE ACADEMIC CAPACITY, WHO REVIEWED THE VALUATION METHODOLOGY AND THE FINANCIAL MODEL.
M
ASTERS IN
F
INANCE
READY TO GROW: The firm is well positioned to organically grow in all the geographies, focusing on specific portfolio categories in each region. We expect a volume grow of 14% until 2021.
INVESTING IN EMERGING MARKETS FOR GROWTH:
In contrast to the anaemic growth in Europe (revenue CAGR of -3% between 2012 and 2016), Heineken is experiencing high volume growth in emerging markets, thanks to growing populations and developing economies. This trend is expected to continue and estimates identify the Americas and the Asia Pacific geographies as main drivers of volume growth (16% and 36% respectively).
FACING THE MARKET RISKS:Given that more than half of
Heineken’s total revenue comes from sales outside the euro zone, the devaluation of key currencies, affecting the consolidated results is a risk that the firm should be aware of. Nevertheless, the unfeasibility to predict future exchange rates, organic changes were considered to forecast future performance.
AGGRESSIVE ACQUISITION: Heineken and its competitors have been accelerating their growth through acquisitions, increasing their exposure to critical markets. After some significant M&A operations in the last years (2010, 2012, 2016), given the unfeasibility to predict major operations in the short/medium term, we rely on the suspension of those activities.
Company description
Heineken N.V. (“Heineken”) is a Dutch brewing company with global operations in more than 70 countries. Company shares are traded on Euronext Amsterdam, where the company is included in the AEX Index.
H
EINEKEN N
.
V
.
C
OMPANY
R
EPORT
B
EVERAGES INDUSTRY
11
SEPTEMBER2017
S
TUDENT
:
M
ARIA
D
INIS
M
INEIRO
[email protected]
Hopping to brew a better future
Time to invest!
Recommendation: BUY
Price Target FY17: 104 €
Price (as of 2-Sep-17) 88.01 €
HEIA: EN Bloomberg: HEIA:EN
52-week range (€) 67.47-89.71 Market Cap (€m) 40.595 Outstanding Shares (m) 570
Source: Bloomberg
Source: Bloomberg
HEINEKEN N.V. COMPANY REPORT
Table of Contents
Company Overview ... 3
Smaller breweries are green with envie ... 3
Shareholder structure ... 6
Business structure ... 7
Brewing industry trends
–
Heineken among the peers ... 9
Geographical overview ... 10
Europe ... 11
The Americas ... 13
Africa, Middle East & Eastern Europe ... 15
Asia Pacific ... 16
Heineken among the peers ... 18
Valuation ...19
Financials ... 19
DCF – Target Price ... 27
Sensitivity analysis ...28
Multiples analysis ...28
Annex ...30
Balance Sheet ... 30
HEINEKEN N.V. COMPANY REPORT
Company Overview
Smaller brewers are green with envie
Heineken N.V. (“Heineken”) is a Dutch brewing company with global operations. Heineken shares are traded on Euronext Amsterdam, where the company is included in the AEX Index. The company shares are also trading over-the-counter in the USA as American Depositary Receipts.
From a single brewery in Amsterdam around 150 years ago, Heineken exponentially grew and nowadays is one of the world’s brewing giants. The flagship brand is Heineken, but the global portfolio amounts to more than 250 international, regional and specialty beers and ciders, including Amstel, Affligem, Strongbow Ciders, Sol, Desesperados or Cruzcampo (Spain), Oxota (Russia), Sagres (Portugal) and Bitang (Indonesia). Heineken ingredients are only water, barley, hops and yeast and the company spent 15 years mastering their craft to ensure that despite of the country of production, the taste is exactly equal all the world over.
The company considers itself as the “most international brewer”, selling its namesake beer in almost every country in the world, being present with over 165 breweries in more than 70 countries, employing about 75.000 people and with 53 nationalities representing senior management. Today, Heineken is the number one brewer in Europe and the second largest brewer by volume in the world.
The firm sells its products through multiple distribution models including direct sales via own wholesalers or own pubs as well as though indirect sales via third parties. The company markets through a more-than 23,000-strong sales force and has built commercial partnerships with popular marques such as James Bond film series and sporting events such as the UEFA Champions League. We assess and highlight three key aspects of the company: the continuous investment in innovation & long-term brand investment to increase leadership positions in both developed and developing markets, the continuous capturing of opportunities in developing markets and the commitment to leverage the benefits of Heineken’s global scale1.
1 The company describes its six business priorities as i) Win in premium led by Heineken brand, (ii) Shape the cider
category, (iii) led by cool marketing and innovation, (iv) be commercially assertive, (v) Drive End2End productivity and (vi) Brewing a better world.
From a single brewery….
To one of the world’s brewing giants…
Figure 1- Heineken innovation rate
HEINEKEN N.V. COMPANY REPORT
Regarding the first point, the company relies on top-line investment through innovation to capture opportunities in both developed and developing markets, achieving different targets, bringing new costumers into the beer category and opening up new drinking occasions. Innovation rate2 evolution is presented in figure 1. Among the most important innovations we point out the following examples:
Radler, a combination of 40% beer and 60% lemonade, with low alcohol volume (2%) and already available in 23 different markets3;
Luso de Fruta, a combination for those who do not enjoy alcohol and want a healthy lifestyle. It was the first combination of water and natural juice in the Portuguese market;
The SUB – an at-home draught beer system that cool beers down to 2ºC;
Heineken igNITE, an interactive beer bottle, aiming to socially connect people in clubs while highlighting the product;
Adapt the bottles design and capacity to the consumer needs: For instance, the company was the first company, in 2015, to be available in a 330ml sleek can with a design that allows standing out visually. Regarding the second point, the company aims to diversify the business, avoiding the dependence on one sole geography. Being already a key player in some developed markets, the company has been focused on increasing the presence in emerging markets through both organic and acquisitive growth. The results are visible, with 61% of the profits delivered by developing markets in 2015 compared to 20% in 20104 (figure 2). In 2016, strong growth in Mexico drove consolidated organic beer volume in the American region (3.7%)5 and in the Asia Pacific region, organic volume change amounted to 17.9% driven by Vietnam, Cambodia and Indonesia. In terms of investments, a relevant investment was in 2012, the acquisition of Asia Pacific Breweries (APB)6. The company had established leadership positions in several markets (namely Singapore, Malaysia, New Caledonia, Indonesia, Papua New Guinea and Solomon Islands), which gave them access to several important markets and supported a CAGR of 354% in the Asia Pacific region. In 2016, Heineken continued to invest in key developing markets and added capacity in Ethiopia and Cambodia, opened a brewery in Shanghai, acquired a brewery in Vietnam and built a new brewery in Mexico. In 2017, the company completed the
2 Percentage of sales coming from new innovations. 3 Source: Heineken website.
4 Source: Barclays Global Consumer Staples Conference, 6th September of 2016. 5 Company data does not discriminate the Mexican volume growth.
6Asia Pacific Breweries Limited brews and distributes beer in the Asia Pacific. Figure 2 - Profits from developing
HEINEKEN N.V. COMPANY REPORT
transaction to acquire Kirin Brazil, and after the closing Heineken become the Brazilian second largest player.
In what concerns to the third point, the company established the Global Business Services in 2010, aiming at globalizing the processes and business operations across the group and increase efficiencies. Among the objectives of the program, the company created the Global Procurement Company (HGP) based in Netherlands, in order to coordinate procurement, production and logistics and being able to manage raw materials, price volatility and drive cost savings. As part of the HGP, the company developed the Total Cost Management program that led to a cost-saving of €637 million from 2012-20147.
Lastly, Heineken has been engaging in mergers and acquisitions as a strategy to grow. This type of internalization strategy is common among all the main peers. The acquisition of local firms increases the company’s competitive positioning and allows of benefiting from synergies and economies of scale from the sharing of means of production, from the distribution network and from the knowledge about the consumer’s behaviour. Additionally, as we will later see on this report, there are clear differences in the levels of development in the beer market across the regions, that also support the growth by acquisition of the breweries.
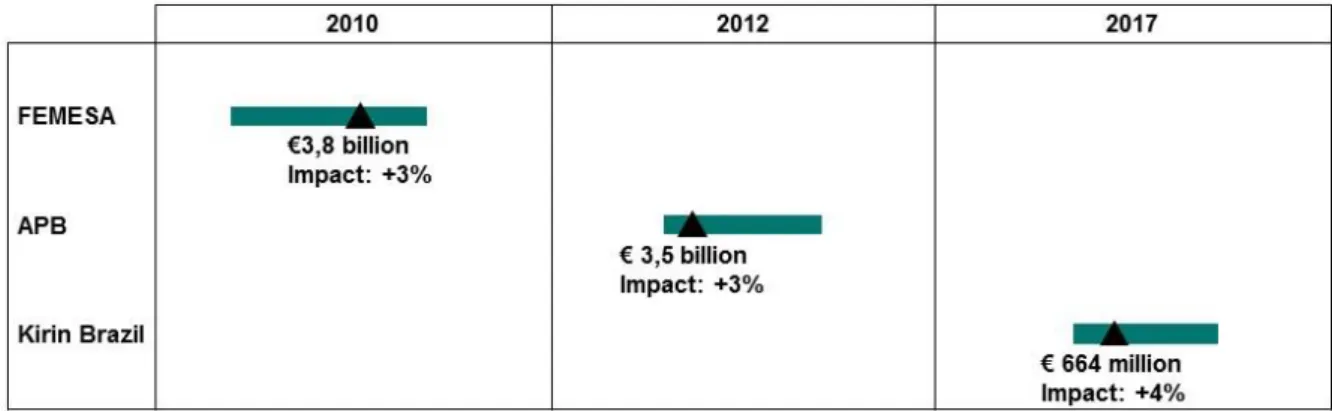
Depending on the relevance of the market for the acquirer brewery as well as of the portfolio of the company itself, the beer companies have been acquiring the 100% or the targets or not. We point the following three examples see table 1 -with the amounts and market reaction (price return post-announcement):
The purchase of the beer business of Fomento Económico Mexicano (FEMSA), in an all-stock transaction in 2010 to increase the exposure in the Americas.
The acquisition of APB in 2012 (previously run by Heineken and F&M through an equally held joint venture), to increase the presence in the Asia Pacific geography. The price was 17 times EBITDA, price that the CEO considered fair due to the opportunities of the market.
The partial acquisition of Lagunitas8 Brewing Company in 2015. The brewer bought the first 50% stakes to enter in the craft beer segment in the U.S., which has recently gained market share (11% of total beer volume in 20179). Because the partnership was successful, the craft beer market in the U.S. continued to grow and Lagunitas has been
7 Source: Financial Times
8 Craft brewery founded in 1993 in the United States. We do not identify this acquisition in table 1 because there is no
available data.
HEINEKEN N.V. COMPANY REPORT
outperforming the market, Heineken announced in 2017 that it will acquire the remaining shares.
The acquisition of Kirin Brazil in 2017 by Heineken was an important strategic move that allowed the company to gain market share (second biggest player), broadens the reach across the country and increases Heineken exposure to growth from developing markets.
Shareholder structure
Heineken shareholder structure has not suffered many changes across the past years with Heineken family retaining a controlling interest in the brewer via a tiered holding structure. The company is held 50.005% by Heineken Holding N.V., which in turn is owned 51.709% by L’Arche Green N.V., a company owned by the Heineken family and by the Holder family. Fomento Económico Mexicano (FEMSA)10 is the second major shareholder of the group, retaining about 12.5% of Heineken shares and 14.9% of Heineken Holding N.V. shares. Consequently, the family controls the group holding an economic interest of only about 23% while FEMSA shareholding represents a 20% economic interest in the Heineken Group. Heineken main shareholder (Heineken Holding) is not an ordinary holding company and its main object is to manage and supervise the management of Heineken group and to provide services for Heineken in accordance with internal policy principles.
Even though Heineken family still holds the majority of the economic interest in the group, the concentration of Heineken ownership structure is not abnormal and the level of free-floating in the group is above 50%. Family-owned companies have been a source of interest among scholars, politicians and economists and amongst the results of studies on the topic, two success factors show up
10 FEMSA is a global company in the beverage and retail industry.
Table 1 - Heineken recent relevant acquisitions
HEINEKEN N.V. COMPANY REPORT
frequently: strong boards and a long-term outlook coupled with a prudent but dynamic portfolio strategy11. Studies reveal that longer perspective tends to steer strategy and makes family business less successful during bombs but increases their chances of staying alive in periods of crisis12 while more diversified institutional investors look for higher short-term returns. Secondly, large family business tends to have strong governance13. Governance mechanisms implemented generally separates ownership from management, setting up family and business rules and defining dividend policy. Besides, members of these families are considered a good asset for the management, since they know the business for a long time and avoid the principal-agent issue by participating in the work of company boards. On average, 39 percent of the board members of family businesses are inside directors (including 20 percent who belong to the family), compared with 23 percent in nonfamily business14. Lastly, most studies defend that family business long-term vision makes it easier to the family business owners to make decisions on innovation and long-term projects, despite returns are not immediate.
We find evidence on those aspects in the Heineken case. Firstly, Heineken’s annual returns outperformed the market in the period between 2007 and 2010 and were of 2% against the -4% of the Eurostoxx600 Index (see figure 3). Secondly, the two executives of the Board of Directors are part of the Heineken family, Charlene Heineken (part of the board of directors since 1988) and Michel Ray de Carvalho (member of the supervisory board since 1996)15. Thirdly, innovation, as previously referred, has been in the heart of the Heineken Company.
Business structure
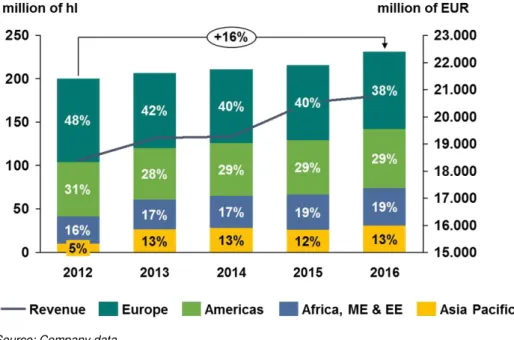
Despite the global recession, Heineken was able to beat the market and continue to generate profits. Volume had been steadily increasing along with revenues, and between 2012 and 2016, the firm annual volume sold increased from 201 to 231 million of hectolitres (figure 4). Heineken brand presents a significant portion of total volume (figure 5).
Heineken operates in four different regions: Europe, The Americas, Africa, Middle East & Eastern Europe and Asia Pacific. Each region has different contribution to the global volume sold. From figure 4 we can notice that Europe contributed the most with 38% of the volume sold in 2016.
11The five attributes of enduring family businesses, McKinsey & Company, 2010
12In “The five attributes of enduring family businesses”, the authors found evidence that a broad index of publicly traded
family-influenced business from 1997 to 2009 achieved a total returns to shareholders two or three percentage point higher than those of MSCI World, the S&P 500 and the MSCI Europe indexes.
13European Family Business Barometer — Successful & Resilient (fifth edition), EFB and KPMG, September 2016 14 Ronald C. Anderson and David M. Reeb, “Founding-family ownership and firm performance: Evidence from the S&P
500,” The Journal of Finance, 2003, Volume 58, Number 3, pp. 1301–27.
15 The Board of Directors consists of two executive members and four non-executive members. Figure 3 - Heineken and Eurostoxx600
cumulative returns 2007-2010
HEINEKEN N.V. COMPANY REPORT
The Americas is the second biggest source of volume for Heineken since 2010, the year in which the company acquired FEMSA. To note that also Asia and Africa, Middle East and Eastern Europe have become promising regions in the last years.
The anaemic growth of the European markets obliged the company to search opportunities in growing markets and to address its M&A and expansion activities to those markets. The FEMSA acquisition in 2010, the APB in 2012 and Kirin Brazil in 2016 were major steps towards that aim (as previously mentioned). In fact, the M&A activities have been a source of revenue growth for the firm. Over time, Heineken performance has been a balance between organic and expansion growth. In 2013, for example, the acquisition of the controlling stake in APV and the acquisition of 28% of the Efes Breweries International16 in Central Europe Beverages contributed to a total revenue growth of 5%, despite the organic variation of -1%.
16 Beverage Company which primarily operates in Turkey, Southeast Europe, Russia, Central Asia, and the Middle East. Figure 5 - Volume evolution (% of total)
Source: Company data
Figure 4 - Volumes (weighted by region) and revenues evolution
HEINEKEN N.V. COMPANY REPORT
Brewing industry trends
–
Heineken
among its peers
Industry overview
–
Key players and trends
Heineken operates in the beverage industry. This sector can be divided in sub-industries: Brewers, Soft Drinks & Waters and Wines and Spirits. Heineken’s activities are mainly related with beer production and selling. Given the higher importance of beer for Heineken’s business and because the firm’s statements do not discriminate between types of beverages, we only analyse this core sub-industry.
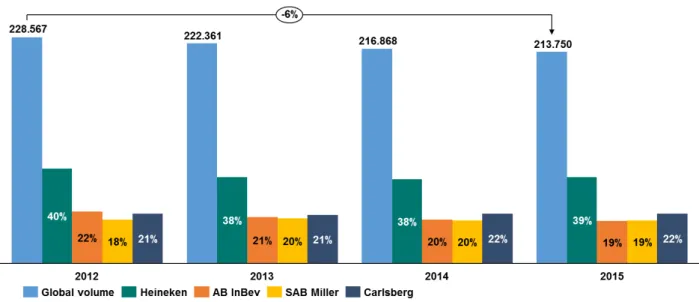
Beer is one of the highly preferred alcoholic beverages across the world (World Wealth Organization). However, available data on the industry is very scarce and almost limited to the company’s statements. The beer industry has undergone some changes. One decade ago, the market was fragmented and dominated by regional players. Progressively, a global consolidation process, through M&A and joint Ventures, took place and enables some brewers getting bigger penetrate other growing markets. According to the Canadean17, the main players in the market in 2015 are restrictive to “the big four”: AB InBev, SABMiller, Heineken and Carlsberg. The four firms have in common a diverse and global footprint achieved through exportations, joint ventures and a significant number of mergers and acquisitions.
The firms’ accumulated sales figures have been following an upward trend (see figure 6). Based on the companies’ statements, we conclude that all the companies together sold about 1 Billion hl of beer in 201518, from which AB InBev represents 45% and Heineken 19% of the total. The companies’ portfolios have many brands now exploiting niche segments on account of increasing health consciousness among drinkers and constant changes of consumers’ preferences. For example, the increase of the health consciousness opens up a new range of new beer categories and Heineken just launched its all-natural alcohol free beer. Also AB InBev has as main objectives to ensure that low-no alcohol products represent at least 20% of the company global volume by 2025. Another example has been happening in the U.S. beer market: while in 2015 the whole beer category only grew by 0.6%, volume growth of craft beer for the same
17 Independent market research and data management provider.
18 We do not use the volumes reported for 2016 to compute this statistics because AB InBev consolidated partly
SABMiller and in 2016 created a new reported segment (Africa & Europe). We do not have enough data to extrapolate those two effects, which can skew the data.
Heineken: A global player in a consolidated industry
Figure 6 - Global volume of the main players
Source:Companies data
Figure 7 - Main players' volume evolution (% of total)
HEINEKEN N.V. COMPANY REPORT
period was 10.2%19. Given the trend in the U.S. market, Heineken acquired 50% of the shares of Lagunitas in the same year. Also AB InBev is entering into the craft beer market and announced in May of 2017 the intention to acquire the North Carolina’s Wicked Weed Brewing.
The market is highly dynamic and at the behest of Heineken, all the global companies in the sector have been focusing on extending the geographic spread benefiting from a balance between the growths that emerging markets provide and the mature but valuable markets of Europe. Heineken global footprint requires the portfolio strategy to adapt in each market because the key performance drivers vary across regions.
The most important acquisition of the history of breweries occurred in October of 2016 in an operation that Financial Times classified as “the third largest acquisition in the world”, with AB InBev acquiring SABMiller for 107 Billion Euros. The acquisition is a threat for Heineken because the combined companies will have a strong presence in a wide range of countries, taking advantage of the knowledge each of them already have. AB InBev will benefit from the SABMiller strong presence in key emerging markets as Latin America and Africa, benefiting from the growth opportunities in those markets, while the company already has strong presence in key developed markets, such as U.S.
Geographical overview
The industry have different expressions all around the world. Those differences are related with consumptions patterns, growth opportunities, legislation, purchasing power, population demographics evolution and urbanization rate.
Also beer consumption is miscellaneous around the world, creating opportunities in several geographies. Considering as reference Czech Republic, the country with the highest beer per capita consumption – 142 litters/per capita20, we conclude that there is still room to grow in many economies.
The year of 2016 was very positive for Heineken, with positive volume growth in all the geographies. The company was able to outperform the volumes sold in all the markets, expect in Europe.
To get a better understanding of each region, we further present a geographical overview.
19 Data source: Nielsen
20 Our reference for all the data on per capita consumption is “Per Capita Beer Consumption by Country in 2015, Kirin
Holdings Company”.
Figure 8 - Liters per capita
HEINEKEN N.V. COMPANY REPORT
a. Europe
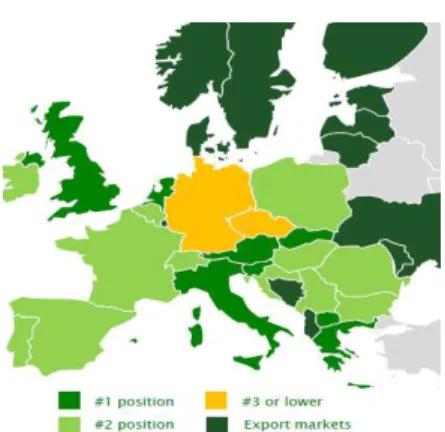
Heineken is Europe’s leading player and Carlsberg is the second largest brewer. The two companies are more dependent on the region than AB InBev and SABMiller. Heineken represents 39% of the total volume sold in the region and Carlsberg represented 22% in 2015. The European market is a mature market that has been experiencing stagnation for all the big-four companies operating in the region. Heineken has strong positions in the European largest markets, as might be seen in figure 9.
In a study in 201621, Liesbeth Colen and Johan Swinnen examined the effects of income growth and found that as GDP per capita increased in poorer countries, beer became more popular. But when it reached around $27.000 per person, consumption began to fall again, and the reason is likely to be, according to the authors, because people became more aware of the danger alcohol poses to health. The recent financial crisis impacted negatively the beer business: real wages decreased22 and taxes on beer increased. The demographic trends are also a limitation for breweries operating in Europe, with an expected population growth of -1% until 202123. Additionally, European citizens changed their consumption patterns during the financial crisis and switched from on-trade consumption to off-trade consumption24, pattern that Euromonitor expects to continue. This trend has a negative impact on margin (even though the
21 Economic Growth, Globalisation and Beer Consumption (2015)
22 Real wages in the euro area decreased by 3.1% in 2009, started to grow in 2009 by 2.% (source: European
Comission). In the UK wages drop 10% since the onset of the financial crisis.
23 Source: United Nations
24 Source: www.thebrewersofeurope.org
Source: Companies data
Figure 9 - Volume evolution in the European region (in thousands of hectoliters)
Figure 10 - Heineken volume evolution - Europe
HEINEKEN N.V. COMPANY REPORT
companies do not make this quantification publicly available) because generally the margin is higher in on-trade consumption.
Despite the various consumption patterns in terms of beer per capita consumption across the region, the region’s average consumption per capita is high (global average is 67/per capita)25 and several markets are already part of the most valuable ones in terms of global market share.
We identify France and Italy as potential countries for growth. Both countries are already global valuable markets but their beer per capita consumption is still below the European one (see figure 13).
Thus, on mature markets as the European one, consumers are increasingly looking for variety and new experiences outside the core lager. Delivering top-line growth in these markets is dependent on innovating products in order to appeal to more consumers and also by investing in premiumisation (specifically on marketing)26. Even though quantification data is not publicly available, Euromonitor pointed out that category such as non/low alcohol beer saw strong sales in 2016 in several European countries. For example in France, the independent researcher considers that the Heineken’s market leadership is due to the investment in premium markets as Aggligem and Desesperados.
The leading breweries strongly invest in innovative marketing as a way to gain market share. AB InBev is the one which invests the most in marketing and selling as percentage of revenue, despite the difference is not substantial (figure 14). In 2015, Heineken stayed above the competition on brand awareness, as it was the leading beer brand in social and digital media (19.4 M fans on Facebook against 12.5M of Budweiser) and was awarded with the Creative Marketer of the year.
25Source: What’s brewing seminar, 26th November of 2016
26Source: Heineken NV 2014 What’s Brewing Seminar Western Europe Figure 14 - Marketing expenses as
% of revenues
Source: Companies' reports
Figure 11- Heineken market-share position across Europe
Source: Company presentation
HEINEKEN N.V. COMPANY REPORT
b. The Americas
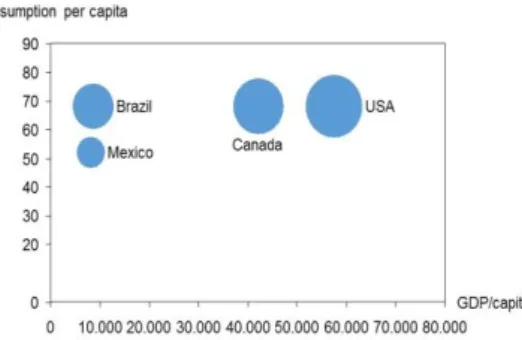
Heineken reports Americas as a single geography. However, there are strong differences across the region, since it encloses high GDP per capita as the U.S. and Canada and lower GDP per capita markets, as Mexico and Brazil (figure 15). Nonetheless, this is a region with attractive characterisitcs and large beer markets. Beer is the favourite alcoholic beverage in Mexico (87%), Brazil (60%) and United States (50%)27.
The most recent available data indicates that Unites States, Brazil and Mexico are respectively the second, third and sixth largest beer markets in the world (13%, 5.1% and 4% global volume market shares) but there is still room to grow. Despite the U.S. and Canada are more mature markets, those are still attractive because the economic situation was not as severe as in Europe, the level of beer consumption is already considerable high but there is still room to grow, GDP per capita is high and regulation is not so restrictive28.
The Americas increased its importance for the Heineken Group since the acquisition of FMESA in 2010, and since then the region has been representing volume growth (figure 17).
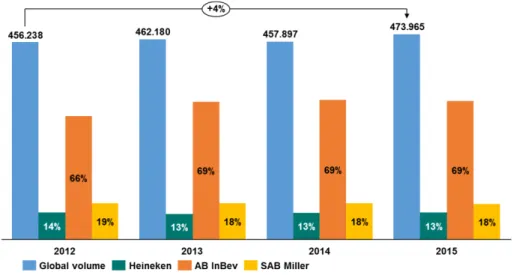
From the direct competitors, only Carlsberg does not operate in the region. The other three breweries have been experiencing volume growth, with positive CAGR (figure 16). Nonetheless, the region is dominated by AB InBev, which represented 69% of the volume of the three companies in 2015 and which revenues came mainly from Latin America (63%) while the rest from North America (37%). SAB Miller was the second largest player in the region in that year (18%). With the acquisition of SAB Miller, the combined company will become a giant in the region, despite the disinvestment that the companies have to make in the U.S. because of anti-competition issues. The impact is still not visible in the report of 2016, due to the consolidation issues previously mentioned.
27 See Status Report on alcohol and health, World Health Organization, 2014
28 Several countries in Europe have been enforcing national laws and self-regulation on the advertising and marketing,
sponsorship, availability and increased taxes and duties of alcoholic beverages.
Figure 15: Consumption per capita vs GDP per capita - main markets in the Americas
HEINEKEN N.V. COMPANY REPORT
The U.S. beer market is a higly concentrated industry since a few large firms occupy a large market share driven by some mergers and acquisitions in the last years29. According to Euromonitor, AB InBev led the industry with a volume market share of 44% in 2016 with Corona Extra being the leading brand with 24% volume market share (MS). Modelo and Heineken followed the lead, with respectively 14% and 11% of volume MS. Due to the AB InBev acquisition of SABMiller, the company can not acquire another brewer, not even a craft brewer, without prior approval of the U.S. Department of Justice. That is an opportunity for Heineken in a country with already high beer per capital consumption (75 liters per capita), because craft breewer is a segment that is growing at a fast pace in the country’s beer market (CAGR of 12% in 2016).
Regarding the emerging companies that are part of the region, Mexico is one of the company’s most important markets and the main driver of performance in the region30 (despite the company does not provide any quantification of “strong performance”). The market is practically a duopoly, dominated by Heineken and Grupo Modelo (part of AB InBev) with respectively 40% and 57% volume market share as of December 201631 and increased the brewers pricing power. While both the leading companies have well-developed distribution networks, they have been focusing on expanding their reach to other regions of the country and invested in massive advertising campaigns - according to Euromonitor, in 2016, a common trend was the investment in digital advertisement and in-store promotions. We believe that companies are taking
29 E.g. joint venture between SABMiller and Molson Coors in 2007 and now the acquisition of SABMiller by AB InBev 30 Source: Heineken 2016 annual report
31 Source: Euromonitor
Figure 16 – Volume evolution in the Americas region (in thousands of hectoliters)
Source: Companies data and analyst's estimates
Figure 17 - Heineken volume evolution - Americas
HEINEKEN N.V. COMPANY REPORT
those actions because there is room to increase the per capita consumption32. According to the same research, beer sales are expected to continue to growth as companies are expanding the points of sale and consumers are increasing their interest in trying different brands and discovering new consumption occasions. Heineken is planning to invest in a new brewery in northern Mexico, its seventh in the country, in an investment of $470 Million. Brazil is other important market for breweries. It is, as previously mentioned, the third largest market in the world33 and the per capita consumption is of 67.7 liters per capita. However, the beer category has been declining in the country, seeing a 3% decline in 201634 as a consequence of the challenging consumer environment, in which the rising unemployment rate reaching 11%, the highest level since 199535, resulted in a shrinking real disposable income. However, consumer confidence increased, impacting the companies involved in consumer and retail and the prospects are sligly positive, with forecasts pointing to a 1% CAGR of the beer volume with recovery from 2018 onwards supported by new trends in the market, as reduction in the purshasing frequency and the look for more promotions and discounts.The positive GDP outlook and population growth made Heineken to believe that the purchase Kirin Holding S.A. would consolidate the firm positioning in the country, broadening its reach across the region, streghnt the company portfolio and further increase the exposition to the emerging markets, being the second largest player in the country, only after AB InBev (19% agaisnt 63% volume market share)36 .
Overall, prospects in the region are very promissing due to already large markets but with still room to increased per capita consumption, GDP growth prospects and age of working age population prospects. The main variables affecting the region are population growth (average of 1% between 2015 and 2020), GDP (average of 2% between 2015 and 2020) and GDP per capita growth (average of 1% between 2015 and 2020).
c. Africa, Middle East & Eastern Europe
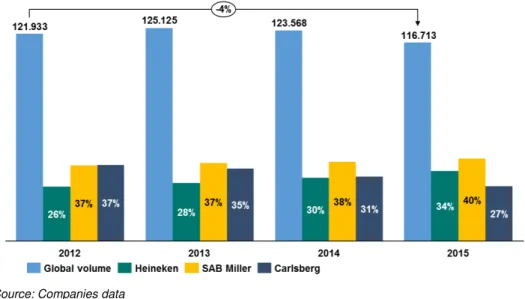
Heineken reports Africa, Middle East & Eastern Europe (AMEE) as a single geography. Heineken faces two important competitors in the region, SABMiller and Carlsberg. SABMiller, with its partly South African origins, holds 40% of the volume total operations in 2015 and its operations are set in the African continent where the company is present in 17 countries with its primary brewing
32 We take as reference the per capita consumption list (#30) from which Mexico is not part of. Source: Per Capita Beer
Consumption by Country in 2015, Kirin Holdings Company
33 Source: Euromonitor 34 Source: Euromonitor 35 Source: OECD data 36 Source: Heineken
Source: Company data and analyst's estimates
HEINEKEN N.V. COMPANY REPORT
Source: Companies data
and beverage operations and in further 21 through associated interests. Carlsberg focuses on the Eastern European region, accounting for 34% of total volume sold in the region (figure 19).
Most markets in the region have an oligopolistic structure, which could benefit pricing power and consequently margins. Still, margins have strong limitations due to the low consumer income and underdeveloped infrastructures37.
Heineken has confidence in the performance of this market due to the last few years’ GDP rise, inflation fall and working-age population growth. However, there are still severe barriers to entry the market, such as several countries low per capita income and weak infrastructures.
The most important markets for the company are Nigeria, South Africa, Egypt and Ethiopia38.In all of them, excpet in Nigeria, volumes and revenues increased. The Nigerian performance was impacted by a weak consumer environment with low oil production output, economic recession and high inflationary pressure.
d. Asia Pacific
Asia Pacific is a very diversified region with beer markets at different stages of development, with the consumption levels varying from 1 to 85 liters per capita (figure 25). It was the region where all the four bigger competitors most increased the volumes sold (figure 22).
37Source: Heineken N.V. 2014 What’s brewing Seminar Africa & Middle East 38 Heineken N.V. reports 2017 half year results
Figure 21 - GDP growth (most relevant countries in AMEE)
Source: IMF
Figure 20 - Population between 15-64 yo (%) in the most relevant countries in AMEE
Source: World Bank
HEINEKEN N.V. COMPANY REPORT
Figure 24 - GDP per capita growth in the Asia and Pacific region (excluding high income countries)
Source: World Bank
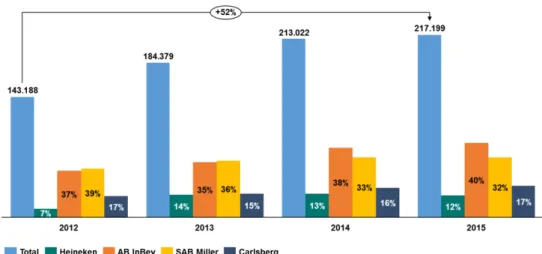
In the Asia Pacific region, Heineken ranked the fourth place in terms of volume (12%) and AB InBev dominates the region with 40% of the sales. The sales in the region still do not represent a significant portion of Heineken’s sales despite the company was in the Southern Asia for decades. However, as shown in figure 23, it has been gaining importance for the firm, mainly since the acquisition of APB in 2012.
The region comprisis some mature markets as Australia, New Zeland and Japan but some grewing and relevant markets, as China and Vietnam. China is the larggest beer market in the world, accounting for 24% of global volume
market share and Vietnam is the 9th largest market, accounting to 2.1% MS. Despite both countries are already above the global average of beer consumption (27 liters/capita) and the Asia region (18 l/capita), there is still room to grow.
Figure 25 - Consumption per capita in Asia Pacific Source: Companies' data and analyst’s estimates
Figure 22 - Volume evolution in the Asia Pacific region (in thousands of hectoliters)
Figure23: Volume evolution - Asia Pacific
HEINEKEN N.V. COMPANY REPORT
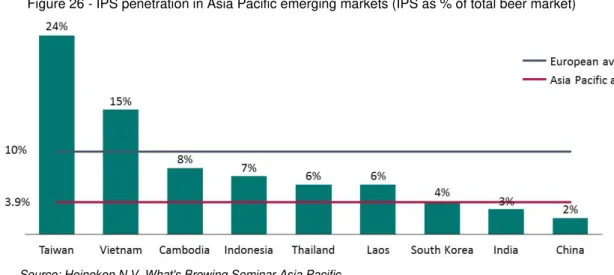
Summarizing, Asia Pacific region is very attractive for brewers due to the low average beer consumption in the region, younger average population base and rising urbanization39 and income levels. Further, the International Premium Segment (IPS) penetration is still low in large markets, offering significant upside for growth:
China is an important example where brewers have been investing in market innovation, having as target the young adults. In 2016, AB InBev held or sponsored multiple festivals and cooperated with ele.me, the largest online food and beverage delievery platform in China, to create an O2O beer festival to culminate beer culture and establish brand reputation among young consumers.
Heineken among the peers
In order to synthetize the study of the industry and Heineken position within it, we present a SWOT analysis.
Strengthens:
Creative Marketing campaigns; Leader in the IPS;
Strong position in the markets where operates (e.g. Mexico, the largest beer market);
Weaknesses:
Still high dependence on the European market;
Opportunities:
Emerging markets in Asia;
Rising market for craft beer in the U.S.A.;
39According to the World Bank, urbanization rose from 37% to 53% in the region.
Figure 26 - IPS penetration in Asia Pacific emerging markets (IPS as % of total beer market)
HEINEKEN N.V. COMPANY REPORT
Room to increase in the beer consumption per capita in key markets; Capability of growing through acquisition;
Threats:
Volatility of exchange rates;
Increase in AB InBev negotiation power; Increase in rivalry from other beverages; Increase in regulation and taxes;
Increase in commodities price; Changes in consumer preferences.
Valuation
The valuation of the company was not done through a sum of the parts approach because of the lack of information to accurately perform the valuation per geographic region. We instead apply a discounted Cash Flow model and discount the Free Cash Flow (FCF) at the firm Weighted Average Cost of Capital (WACC). As a complementary method, we perform a valuation using multiples. We finish our analysis assessing the robustness of our target price and how it is affected by changes in the selected drivers. Thus, we lastly run a sensitivity analysis to the cost of capital and terminal value growth rate.
Financials
In this section we explain the main assumptions made to forecast future Cash Flows. Revenues are breakdown in regions considering each regions volatility, performance and sales main drivers and thus to facilitate more reasonable assumptions but the other figures are not discriminated because historical data was not provided.
Revenues
The projected revenue growth is the sum of volume growth per region multiplied by the average price per hectolitre. Because of the unfeasibility to predict future exchange rates movements and major M&A operations in the short/medium term, only organic changes were considered.
Considering the differences in each region analysed in the previous chapter, we evaluated the variables impacting the volume growth in the last years per geographic region. We came up with the following critical variables per region:
HEINEKEN N.V. COMPANY REPORT
The Americas: GDP per capita growth, innovation rate, population growth & urbanization rate
Asia and Pacific: GDP per capita growth, urbanization rate, population growth and innovation rate
Africa, Middle East and Eastern Europe: GDP per capita growth, Population growth, urbanization rate & innovation rate
We further analysed the IMF prospects for those variables in the coming years. We got our prospects on future revenue growth considering the historical growth and the impact of those variables.
The explicit period considered is 5 years. We expect a global growth of 14% until 2021, driven by a CAGR of 36% in the Asia Pacific region and 16% in the Americas.
For Europe, we expect a slight increase on volume in the next years. Despite the ongoing decline in volumes, organic growth in the consolidated beer volumes has been showing signs of better performance since 2014. Considering the past performance, expectations on the economic recovery in the region and the capacity of the firm to innovate, we forecast a growth of between 1% and 1.7% for the next 5 years.
We expect an increase in the volume of the Americas driven by the U.S. market, Mexico and Brazil. The U.S. already contributed meaningfully to Heineken sales, and despite the growth changes are quite limited to the already high beer per capita consumption, the craft segment where the company is investing offers positive prospects. Inequitably, Mexico and Brazil are two markets that offer very promising growth perspectives. We estimate volume increases of around 3%over the next years.
The Asia Pacific region is the most promising among the four geographies. Volumes are expected to grow in line with the values verified in the past years and considering the positive and already stated positive prospects for the region. Hence, we estimated a volume increase between 5% and 7% over the next 5 years.
Lastly, we estimated the volume of AMEE to grow at between 1% and 2% annually, with the exception of 2017. Although the firm is well positioned in some markets, as already stated, the high volatility of the economies in general aligned with the still low GDP per capita and low infrastructures results in a quite unstable growth prospects.
HEINEKEN N.V. COMPANY REPORT
meaningfulness to predict by how much the average revenue per hectolitre will increase in each region and therefore we used the estimated average revenue per hectolitre of 2016 (90 EUR/hl).
Based on the previously described, we estimated the following 5 years volume per region:
Table 2 - Forecasted volume summary (in Millions of hectoliters)
3. Operating Expenses
Operating Expenses are closely tied to sales and include raw materials, consumable & services (RC&S) and personal expenses.
RC&S include materials and expenses directly related with the good sold. Given the stability over the last years of the components of the item, we estimated each of those as an average of the last 5 years (2012-2016) percentage of revenue, expecting for Raw Materials and Energy and Water. For those items, we considered the percentage of revenue of 2016 because those have been decreasing over the previous years due to the Heineken’s cost management programmes.
Regarding the personnel expenses, we analysed the evolution of the revenue per employee. Heineken has been able to increase productivity and effective use of the firm’s resources. While between 2011 and 2013 the number of FTE increased along with revenue resulting in a stable ratio of revenue per employee, the firm reduced the headcount 6% in 2014, but was able to increase its productivity. In the last two years, the firm smoothly reduced the number of employees but was still able to increase the productivity ratio. We estimate the revenue per employee to remain at 2016 level and the cost per employee as an average of the last 5 years.
2017E 2018E 2019E 2020E 2021E
Europe 90 91 92 94 95
Americas 70 72 74 77 79
Africa, Middle East & Eastern Europe 44 44 45 46 46
HEINEKEN N.V. COMPANY REPORT
Tax Rate
According to Heineken’s expectations, the future effective tax rate40 will be in line with the one in respect to 2016 (27.9%).
Net Working Capital Requirements
We identified the items composing Heineken’s Working Capital: Current assets are composed by Inventories, Trade and Other Receivables and Prepayments and Trade and Other Payables are the firm’s current liabilities.
Heineken presented historically a successive negative Working Capital. This is a result of the Hunt for Cash Management Program. This programme started in parallel with the TCM programme given the major financial crisis and consequent uncertainty in the markets, and the aim was to change the focus of the firm from profit to cash flow.
40 Tax Rate over Earnings before Share of profit of A&JV
Table 4: Historical and forecasted personnel expenses (in Millions of Euros)
2012 2013 2014 2015 2016 2017E 2018E 2019E 2020E 2021E
Personnel Expenses 3 031 3 108 3 080 3 322 3 263 2 949 3 019 3 108 3 193 3 283
Number of FTE 76 191 80 933 76 136 73 767 73 525 70 867 72 565 74 687 76 724 78 905
Revenue per employee 24% 24% 25% 28% 28% 30% 30% 30% 30% 30%
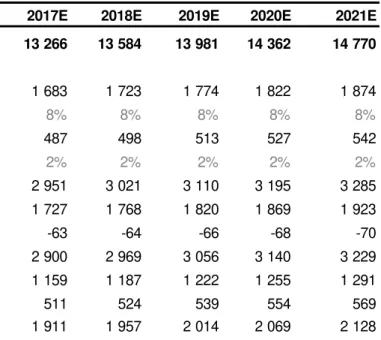
Table 3 - Forecasted operating expenses (in Millions of Euros)
2017E 2018E 2019E 2020E 2021E
Raw materials. consumables and services 13 266 13 584 13 981 14 362 14 770 from which
Raw materials 1 683 1 723 1 774 1 822 1 874
percentage of revenues 8% 8% 8% 8% 8%
Energy and water 487 498 513 527 542
percentage of revenues 2% 2% 2% 2% 2%
Non-returnable packaging 2 951 3 021 3 110 3 195 3 285
Goods for resale 1 727 1 768 1 820 1 869 1 923
Inventory movements -63 -64 -66 -68 -70
Marketing and selling expenses 2 900 2 969 3 056 3 140 3 229
Transport expenses 1 159 1 187 1 222 1 255 1 291
Repair and maintenance 511 524 539 554 569
HEINEKEN N.V. COMPANY REPORT
As a result, the company has been very efficient managing its Cash Conversion Cycle. Heineken takes longer to pay its costumers than to sell inventory and to collect receivables, holding onto its money for a longer time period. Also the main competitors present negative Working Capital41, using working capital as an interest free way to finance their operations and increase liquidity. One of the reasons that can explain this fact is that those are big companies that have high bargaining power among the suppliers and so credit from them is extended. We estimate future Working Capital Requirements assuming the same Days Sales Outstanding (DSO), Days Inventory Outstanding (DIO) and Days Payable Outstanding (DPO) as of 2016. We do not consider any improvement in the CCC because it has been historically stable.
Capital Expenditures (CapEx) and D&A
For the purpose of estimation, we divide the CapEx and D&A between tangibles and intangibles.
Regarding the purchase of PPE, we observe that Heineken has been increasing its investment since the economic downturn. Except in 2011, the firm’s ratio of capital expenditures to depreciation was always above 1, representing an expectation of future growth. The ratio of CapEx to revenue increased from 6% in 2012 to 8% in 2016.
There is not available information regarding the plants’ capacity per region, so we cannot calculate which part is already used. However, according to company data, the firm has been engaging activities evolving the acquisition or construction of new plants or expansion of modernization of already existing ones. We remark the following recent important activities in all the four geographies:
Expansion and modernization of plants in two breweries in the UK in 2015 and 2016 that increased the total brewing capacity by 2 million hectolitres;
Inauguration of Ethiopia’s biggest brewery in 2015 that permits to meet the needs of Heineken continent by up to 1.5 million hectolitres;
41 Source: Bloomberg
Figure 27 - Historical and forecasted purchase of PPE & depreciation (EUR M)
Table 5: Historical and forecasted NWC (EUR Million) and CCC (days)
2012 2013 2014 2015 2016 2018E 2019E 2020E 2021E
Net Working Capital
-974 -839 -1 095 -1 226 -1 135 -1 163 -1 197 -1 229 -1 264
HEINEKEN N.V. COMPANY REPORT
Figure 28- CapEx to depreciation ratio
Purchase, from Carlsberg, of a brewery in Vietnam with the capacity of 50 million hectolitres per year. In 2016 announced an expansion plan to increase the capacity up to 510 million hectolitres.
Investment in a plant in Chihuahua, Mexico, that will increase the brewing capacity in the country in 5 million hectolitres a year, with the possibility of expansion up to 10 million.
We forecast CapEx to be in line with the historical upward trend of the last 5 years and estimate the investment in CapEx as the percentage of revenue of 2016 (8.45%) to face future demand over the next 5 years.
Regarding the investment in Intangible Assets, we excluded Goodwill from our estimates because being a result of acquisitions for premium values, it is very hard to predict and may led to misleading information. Having very little information about the prospects of this item, we computed it as the percentage of revenues, assuming the last 5 years average ratio (0.4%).
In what concerns Depreciation and Amortization, we forecasted those items as the percentage of PPE and Intangible Assets, respectively, as of December 2016.
Variation in Defered Tax Assets (Liabilities)
Deferred tax assets or liabilities are short-term differences between tax accounting and financial accounting. Because of the nature of those items, we have to consider them in our estimation.
We estimated them as a percentage of revenue, considering for that purpose the average of the last 5 years (2012-2016). The company has been recognizing more tax liabilities than assets. We consider that this trend will continue in the future, considering the revenue growth. Historical and future deferred tax assets (liabilities) as well as its variations may be observed be in table 4.
Noncontrolling interest
Noncontrolling interest on the balance sheet increases each year by the nonctrolling interest on the income statement less the projected dividends to noncontrolling shareholders.
Table 6 - Forecasted deferred tax assets (liabilities) – in Millions of EUR
2012 2013 2014 2015 2016 2017E 2018E 2019E 2020E 2021E
Net Deferred Tax Assets (liabilities) -1 242 -936 -842 -900 -661 -1 002 -1 026 -1 056 -1 085 -1 116
HEINEKEN N.V. COMPANY REPORT
We assume a future payout ratio of 35%, in accordance with historical data and the firm’s prospects.
Considering the historical firm’s return on existing capital, i.e. the Return on Invested Capital (ROIC) of 21% and the Reinvestment Rate (RR) of 26%, we would expect a sustainable growth of 8%. However, we believe this value to be too high to be used as a stedy state.
Employee benefits
Employee benefits of Heineken NV include, among other itms with lower relevance, post-employment benefits (pension plan), termination benefits and short-term employee benefits.
Therefore, we forecast employee benefits for the period 2017-2021 based on personnel expenses estimated.
Weighted Average Cost of Capital (WACC)
WACC was used to discount the global Cash Flows, reflecting the opportunity cost for Heineken bondholders and shareholders weighted by the percentage of the firm that each owns. Table 7 specifies the summary of the WACC computation.
Cost of Equity
The company’s cost of equity was estimated by means of Capital Asset Pricing Model (CAPM), which has three different inputs: risk free rate, Levered Beta and Market Risk Premium (MRP).
The proxy used for the risk free rate was the 10-year German Government bond yield because it is in euros (and therefore avoiding FX risk) and the lower yield expressed in that currency. The one that was used was of 0.5%.
Regarding the MRP, the MSCI World Index was used as a market proxy; a portfolio whose return we believe closely tracks the true market portfolio.42 To compute the MRP we first transformed the risk-free rates into monthly rates. After subtracting those to the monthly index returns, we annualized the average of the monthly differenced, which resulting in a MRP of 6.3%.
In order to estimate the raw beta, we regressed the firm’s returns against the return of the market index (MSCI World). We subsequently did the same for the competitors (AB InBev, SABMiller and Carlsberg)43 and finally averaged the estimated betas. Lastly, we estimated the adjusted beta, which we consider is a better estimate of a security future beta - using historical data of the stock but
42 Euro adjusted returns were considered.
43 We considered the pre-acquisition beta for SABMiller.
RE 7.8%
RD (after tax) 1.6%
E/EV 71%
D/EV 29%
WACC 6.02%
Table 7 - Summary of WACC computation
Risk-free rate 0.47%
Levered beta 1.13
Market risk premium 6.26%
Cost of Equity 7.8%
Table 8 - Summary of cost of equity computation
HEINEKEN N.V. COMPANY REPORT
assuming that a security beta moves towards the market average over time. We reached a beta of 1.13.
Considering the previous inputs, we estimated a cost of equity of 7.8%. Cost of Debt
The cost of debt (𝐾𝑑) is estimated by computing the estimated average return on Heineken bonds44.
We only consider the bonds’ yields (YTM) because by the one hand Heineken’s debt is the major source of debt (see figure 30) and by the other hand due to limited additional information. Additionally, one should note that using bond yields we are considering the cost it would take to finance the company at the data of the valuation, instead of considering historical cost of debt.
Heineken has been managing debt financing mainly through the Euro Medium Term Note Programme established in 2008, which allows the issue of Notes until a total amount up to 15 billion (currently approximately €7.2B is outstanding under the programme). The company has a strong prospect for debt management, establishing a target of Net Debt to EBITDA of 2.5 (see evolution on figure 31).
As of December of 2016, Heineken has placed 21 types of bonds outstanding which differ on currency, the amount outstanding and also maturity. We computed the average of the bonds weighted by its amount in Euros.
Regarding the Recovery Rate, we used the methodology expressed by Hull45 due to lack of available data. The estimated Recovery Rate (RR) is 58%. In what concerns to the probability of default (PD), according to available data and that Heineken bonds are rated as BBB+, we considered a rate of 0.19%. We achieved a 𝐾𝑑of 2.2% and an after-tax 𝐾𝑑of 1.6%.
Capital Structure
Capital structure ought to be market values. Although one should consider the target and not historical capital structure, Heineken intends to maintain the operations financed by a low level of debt.
The market value of equity is equal to the market capitalization of the company, which was EUR 40 595M as of 31st of December of 2016 (see table 9).
We estimate the market value of debt through the bonds’ value of trade (ask price). For the other debt instruments, due to the lack of information, we were not
44 Kd= YTM ∗ PD ∗ (1 − RR) where YTM is the average yield of the Heineken rates, PD is the probability of default and RR is the
Recovery Rate.
45 “Options, futures and other derivatives”, John C. Hull, 2009 Figure 31- Net Debt/EBITDA
Source: Heineken annual reports
Figure 30 - Division of gross debt FY 2016
Source: Heineken annual report
Shares (M) 570
Share Price (€) 71
Market capitalization (€ M) 40.595
Table 9 - Heineken market capitalization (EUR Million)
HEINEKEN N.V. COMPANY REPORT
able to use the NPV estimation, and instead assumed that the market value equals the accounting value. By summing up the different types of debt, we reached a market debt amount of EUR 16.237M.
Heineken is mainly dependent on equity financing. Equity has a weight of 71% while debt the remaining 29%.
In line with the financial discipline in the generation and use of cash across the industry, as previously stated, competitors are focused on investing behind the brands to take advantage of the organic growth opportunities in the business. The main competitors state that are committed into deleveraging to a net debt to EBITDA ratio of around 2 times and are prioritizing debt repayment in order to meet the objective46.
Terminal Value
The accurate estimate of the terminal value is fundamental, since it accounts for a large percentage of a company’s total value.
Because Heineken is a global company, the growth rate assumed in the terminal value shall not be greater than the one of the global economy. The expected real GDP growth rate of 3.7% in 202047 is then the cap for Heineken growth. Because the industry is already in a mature phase, we do not expect the company to grow at that rate. We then applied a cut-off of 75%, assuming then a 2.6% growth rate, value that is in line with the average of the last three years FCFF growth rate (2.8%). We further conduct a sensibility analysis to analyse the impact on valuation in the case of changes in the growth rate.
Considering the cost of capital of 6.02% and the last projected FCFF in 2021, we calculated a terminal value of EUR 76.274 million.
DCF Analysis
–
Target price
The following graph illustrates the forecast of FCFF until 2021. We estimate a Target Price of 104€. Given the implied upside potential of 18% (market price as of 2nd of September of 88.01€), we issue a BUY investment recommendation to Heineken.
46 Source: AB InBev and Carlsberg annual reports. 47 IMF estimates.
Table 10: FCFF estimation (in Millions of Euros)
2017E 2018E 2019E 2020E 2021E
HEINEKEN N.V. COMPANY REPORT
Sensitivity Analysis
All our valuations were performed under the assumptions that the variables used for growth rate and cost of capital are the ones that best describe the current and future figures of Heineken.
As terminal value represents a considerable portion of Heineken estimated Enterprise Value (EV) and because of some uncertainties regarding market performance that may impact NOPLAT, we performed an analysis of changes in growth rate. The discount rate is also a critical variable impacting valuation, and the fact that we derived our cost of debt only from bonds may mislead the price of debt. Cost of debt may be impacted by eventual changes in the bond rating. We present our results in a two-dimensional table, where are analysed changes of 25 bps in each of the variables:
As one may observe, the outcome of the DCF valuation is very sensitive to changes in WACC and terminal growth rate. Moreover, by changing the two dimensions we achieved a range of prices that varies between 61€ and 263€. Even so, those scenarios are very unlikely; as the variables considered for WACC and g in this case are very far from the ones we believe accurately reflect the firm’s growth perspectives.
Multiples analysis
We complement our DFC valuation with a relative valuation. In the multiples valuation, one values an asset by looking at how the market prices similar assets. Our peers are the ones considered by the Financial Times (FT). The only exception is that the FT considers Heineken Holding NV for the relative valuation, which we do not consider appropriate because its earnings only depend on 1,60% 1,85% 2,10% 2,35% 2,60% 2,85% 3,10% 3,35% 3,60%
5,02% 106 115 125 137 154 170 193 223 263
5,27% 98 105 114 124 138 151 169 192 221
5,52% 90 97 104 113 124 135 150 168 190
5,77% 84 90 96 104 113 122 134 149 166
6,02% 78 83 89 95 104 111 121 133 148
6,27% 73 78 83 88 95 102 110 120 132
6,52% 68 78 77 82 88 94 101 110 119
6,77% 64 68 72 76 82 87 93 100 109
7,02% 61 64 67 71 76 81 86 92 100
Terminal growth rate
W A C C
HEINEKEN N.V. COMPANY REPORT
Heineken’s performance. All the companies in our selection operate internationally, to be fairly compared with Heineken.
We selected EV/EBITDA48, EV/Earnings and P/Earnings and downloaded the ratios from Bloomberg. We compute forward-looking multiples instead of trailing 12-month estimates, to better account for the growth perspectives.
The target price obtained in the relative valuation is above the current share price of Heineken’s stock (88.01€). The prices reached are slightly higher than the one reached in our DCF valuation, except in the Price-to-EBITDA ratio (95€).
48We did not consider the EV/EBIT ratio to avoid skewedness due to accounting differences. Multiples Target
Price (€)
EV/EBITDA 107
EV/Sales 135
Price/EBITDA 95
Table 13: Heineken's multiples valuation
Source: Analyst's estimates
Table 12- Peer group composition
Source: Bloomberg
Company Market Capitalization (M€) EBITDA margin
AB INBEV 205 069 36%
CARLSBERG AS-B 14 667 21%
PERNOD RICARD SA 30 948 27%
DIAGEO PLC 61 177 32%
HEINEKEN N.V. COMPANY REPORT
In millions of € 2012 2013 2014 2015 2016 2017E 2018E 2019E 2020E 2021E
Assets
Property, plant and equipment 8 844 8 454 8 718 9 552 9 232 9 640 10 029 10 414 10 792 11 169 Intangible assets 17 688 15 934 16 341 18 183 17 424 17 161 16 915 16 686 16 474 16 276
from which goodwill 11 040 10 407 10 803 11 731 11 436 11 436 11 436 11 436 11 436 11 436
Others that not goodwill 6 648 5 527 5 538 6 452 5 988 5 725 5 479 5 250 5 038 4 840
Investments in associates and joint ventures 1 950 1 883 2 033 1 985 2 166 2 166 2 166 2 166 2 166 2 166 Other investments and receivables 1 099 762 737 856 1 077 1 077 1 077 1 077 1 077 1 077
Advances to costumers 312 301 254 266 274 274 274 274 274 274
Deferred tax assets 550 508 661 958 1 011 791 810 834 856 881
Total non current assets 30 443 27 842 28 744 31 800 31 184 31 108 31 271 31 451 31 639 31 843 Inventories 1 596 1 512 1 634 1 702 1 618 1 613 1 652 1 700 1 746 1 796
Other investments 11 11 13 16 0 0 0 0 0 0
Trade and other receivables 2 537 2 427 2 743 2 873 3 052 3 129 3 204 3 297 3 387 3 484
Prepayments 232 218 317 343 328 327 335 345 354 364
Income tax receivables 0 0 23 33 47 47 47 47 47 47
Cash and cash equivalents 1 037 1 290 668 824 3 035 5 179 7 390 9 647 12 011 14 375
Assets classified as held for sale 124 37 688 123 57 43 29 14 0 0
Total current assets 5 537 5 495 6 086 5 914 8 137 10 338 12 656 15 050 17 546 20 066 Total assets 35 980 33 337 34 830 37 714 39 321 41 446 43 927 46 501 49 185 51 909
Equity
Share capital 922 922 922 922 922 922 922 922 922 922
Share premium 2 701 2 701 2 701 2 701 2 701 2 701 2 701 2 701 2 701 2 701 Reserves 365 -858 -427 -655 -1 173 -1 173 -1 173 -1 173 -1 173 -1 173 Retained earnings 7 746 8 637 9 213 10 567 10 788 12 775 14 811 16 914 19 082 21 321 Equity attributable to equity holders of the Company 11 734 11 402 12 409 13 535 13 238 15 225 17 261 19 364 21 532 23 771 Non-controlling interest 1 071 954 1 043 1 535 1 335 1 495 1 718 1 910 2 159 2 358 Total equity 12 805 12 356 13 452 15 070 14 573 16 720 18 979 21 274 23 691 26 129
Liabilities
Loans and borrowings 11 437 9 853 9 499 10 658 10 954 10 954 10 954 10 954 10 954 10 954
Tax liabilities 140 112 3 3 3 3 3 3 3 3
Employee benefits 1 575 1 202 1 443 1 289 1 420 1 296 1 327 1 366 1 403 1 443
Provisions 419 367 398 320 302 302 302 302 302 302
Deferred tax liabilities 1 792 1 444 1 503 1 858 1 672 1 793 1 836 1 890 1 941 1 997 Total non-current liabilities 15 363 12 978 12 846 14 128 14 351 14 349 14 423 14 515 14 604 14 699 Bank overdrafts and commercial papers 191 178 595 542 1 669 1 669 1 669 1 669 1 669 1 669 Loans and borrowings 1 863 2 195 1 671 1 397 1 981 1 981 1 981 1 981 1 981 1 981 Trade and other payables 5 285 5 131 5 533 6 013 6 224 6 204 6 353 6 539 6 717 6 908
Tax liabilities 305 317 390 379 352 352 352 352 352 352
Provisions 129 171 165 154 154 154 154 154 154 154
Liabilities classified as held for sale 39 11 178 31 17 17 17 17 17 17 Total current liabilities 7 812 8 003 8 532 8 516 10 397 10 377 10 526 10 712 10 890 11 081 Total liabilities 23 175 20 981 21 378 22 644 24 748 24 726 24 948 25 227 25 494 25 780 Total equity and liabilities 35 980 33 337 34 830 37 714 39 321 41 446 43 927 46 501 49 185 51 909