Scenario Analysis in Ria Formosa with EcoDynamo
Duarte, P.
1*, Azevedo, B.
1, Ribeiro, C.
1, Pereira, A.
1, Falcão, M.
2,
Serpa, D
2, Bandeira, R.
1& Reia, J.
31
University Fernando Pessoa - Centre for Modelling and Analysis of
Environmental Systems.
2
National Research Institute for Fisheries and Sea.
3Ria Formosa Natural Park.
DITTY (Development of an information technology tool for the
management of Southern European lagoons under the influence of
river-basin runoff)
(EESD Project EVK3-CT-2002-00084)
Summary
CONTENTS
1 Introduction ... 2
1.1 Brief environmental, socio-economical context... 2
1.2 Identification of environmental concerns and management options... 4
1.3 Objectives... 4
2 Methodology ... 4
2.1 DPSIR... 4
2.2 Models, processes and variables ... 6
2.3 Spatial and temporal scales ... 8
2.4 Description of scenarios analysed ... 9
2.4.1 Scenario set 1 – Bivalve farming ... 10
2.4.2 Scenario set 2 – Use of salt-marsh areas ... 10
2.4.3 Scenario set 3 – Population / Waste water treatment ... 11
2.4.4 Scenario set 4 – Water circulation... 13
3 Results and discussion... 16
3.1.1 Scenario set 1 – Bivalve farming ... 16
3.1.2 Scenario set 2 – Use of salt-marsh areas ... 17
3.1.3 Scenario set 2 –Population / Waste water treatment ... 18
3.1.4 Scenario set 4 – Water circulation... 22
4 Conclusions ... 26
1 Introduction
1.1 Brief environmental, socio-economical context
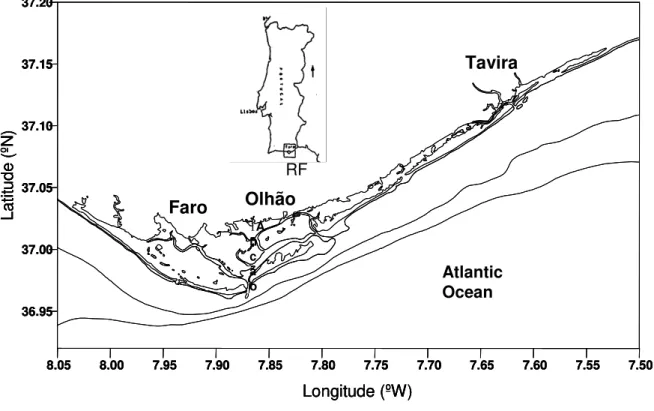
Ria Formosa is a shallow meso-tidal lagoon located at the south of Portugal (Algarve coast) with a wet area of 10 500 ha (Fig. 1-1). The lagoon has several channels and an extensive inter-tidal area, around 50% of the total area; mostly constituted by sand, muddy sand-flats and salt marshes. Due to its gentle slopes, inter-tidal areas are exposed to the atmosphere for several hours over each semi-diurnal tidal period. Tidal amplitude varies from 1 to 3.5 meters and mean water depth is 3.5 m (Falcão et al., 2003).
The main urban centres of Ria Formosa are Faro, Olhão and Tavira. Since 1981, resident population has been growing up (Table 1-1). The city with the highest number of inhabitants is Faro, whereas the municipality of Tavira has the minor resident population.
In summer, there is a three fold population increase due to tourism (Mudge & Bebbiano, 1997). It is remarkable that the population centres located along the barrier island system, separating the lagoon from the open sea also have an extremely variable annual population depending on their main economic activities: tourism, fishing, commerce and shellfish. These population shifts present a complex problem in terms of waste water treatment facilities (WTP). There are plans to reduce the number of WTP and increasing their individual capacity.
Dredging operations have been carried out to permit the access to the Faro-Olhão harbour. These operations tend to concentrate along the main navigation channels and inlets. They are expected to produce hydrodynamic and biogeochemical impacts. There are also economic interests involved due to the value of sand for the building industry.
tons year-1, which represents 90% of the regional production, while oyster production is approximately 2000 tons year-1 (POOC, 1997).
Atlantic Ocean 1A n c ã o RF
8.05 8.00 7.95 7.90 7.85 7.80 7.75 7.70 7.65 7.60 7.55 7.50
Longitude (ºW) 36.95 37.00 37.05 37.10 37.15 37.20 L a ti tu d e (º N )
8.05 8.00 7.95 7.90 7.85 7.80 7.75 7.70 7.65 7.60 7.55 7.50
Longitude (ºW) 36.95 37.00 37.05 37.10 37.15 37.20 L a ti tu d e (º N )
8.05 8.00 7.95 7.90 7.85 7.80 7.75 7.70 7.65 7.60 7.55 7.50
Longitude (ºW) 36.95 37.00 37.05 37.10 37.15 37.20 L a ti tu d e (º N ) Olhão Tavira Faro
Figure 1-1- Geographic location of Ria Formosa.
Table 1-1 - Evolution of Ria Formosa resident population. Resident population (nr. of inhabitants) Municipality
1981 1991 2001
Faro 45 109 50 000 58 800
Olhão 34 573 37 500 41 000
Tavira 24 615 25 000 25 000
Source: http://www.ine.pt
1.2 Identification of environmental concerns and management
options
Following the environmental and socio-economic contexts referred above (for more details refer Falcão et al. (2003)) and after extensive debates between all Portuguese DITTY partners, some environmental concerns and management options were selected for analysis within the project framework. Concerns have to do mostly with potential changes in water quality and bivalve production resulting from different management options. These are mostly related to decisions about dredging some channels, increasing bivalve cultivation areas, changing the number and location of WTPs and increasing/decreasing salt-marsh areas. In order to synthesise these concerns and management options the DPSIR framework was used across all DITTY partners. Its implementation for Ria Formosa is described in the Methodology section (cf. – 2.1).
1.3 Objectives
This work represents the first approach to the scenario analysis of Ria Formosa and its objectives are to analyse management options suggested by the end-users, such as:
(i) Changes in bivalve cultivation densities; (ii) Improvements in WTP performance;
(iii) Changes in lagoon bathymetry resulting from dredging operations.
2 Methodology
In the next paragraphs, a brief description of the methodology followed to define scenarios and proceed with their analysis will be given. This will start with the description of the DPSIR framework application, followed by a reference to the model and variables used, the temporal and spatial scales considered and the specific scenarios analysed in the present report.
2.1 DPSIR
Table 2-1 - DPSIR scheme at the coastal lagoon level.
Driver Pressure State Impact Response
Bivalve farming
Sand addition to tidal flats
Changes in the areas of bivalve farming
Changes in bivalve density Sediment level Sediment area Bivalve quality, quantity and mortality
Changes in the bathymetry
Water quality
Bivalve production
Sustainable bivalve farming (special attention to the addition of sand to tidal flats and the carrying capacity of sediment)
Use of salt marshes
Building of: tourist structures (hotels, tourist villages, and facilities) Navigation facilities (fishing harbours and marinas)
Recovery of salt marsh areas (from: deactivated salt ponds, fishponds and degraded areas)
Changes of salt marsh areas
Changes of lagoon water quality
Water quality
Changes in the biogeochemical cycles Changes in ecosystem productivity Sustainable tourism and navigation (preservation of salt marsh areas)
Improve the management of salt marshes area (recovery of degraded areas)
Population (resident and non resident-tourism)
Increase of resident population
Changes of non-resident population
Wastewater discharges
Water quality – (loads of nitrogen, phosphorus and faecal coliforms) Pollution Eutrophication Bivalve contamination Technical improvement of Waste Water Treatment Plants and interdiction of bivalve farming in areas under the influence of the waste water plumes
Water circulation Changes in water
quality
Bathymetry
Water residence time
Tidal currents
Changes in the environmental conditions
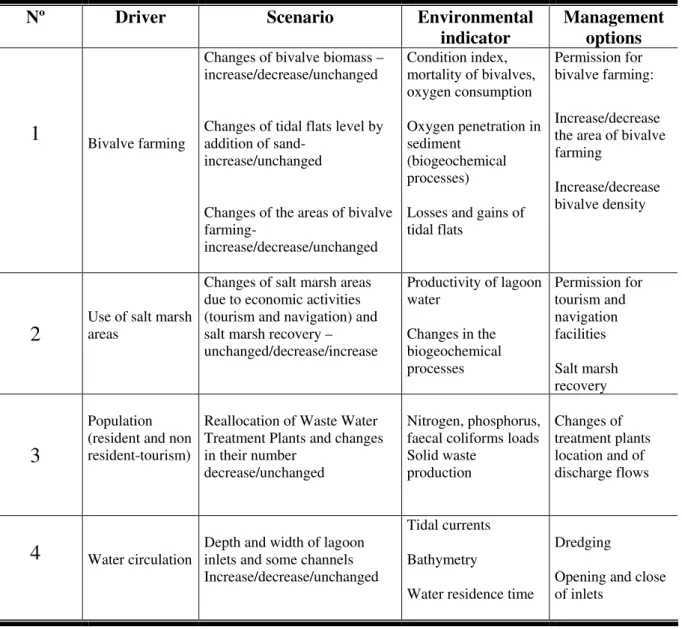
Table 2-2 - Scenarios and management options defined by the end-users.
Nº Driver Scenario Environmental
indicator
Management options
1
Bivalve farmingChanges of bivalve biomass – increase/decrease/unchanged
Changes of tidal flats level by addition of sand-
increase/unchanged
Changes of the areas of bivalve farming-
increase/decrease/unchanged
Condition index, mortality of bivalves, oxygen consumption
Oxygen penetration in sediment
(biogeochemical processes)
Losses and gains of tidal flats
Permission for bivalve farming:
Increase/decrease the area of bivalve farming
Increase/decrease bivalve density
2
Use of salt marsh areasChanges of salt marsh areas due to economic activities (tourism and navigation) and salt marsh recovery – unchanged/decrease/increase
Productivity of lagoon water
Changes in the biogeochemical processes Permission for tourism and navigation facilities Salt marsh recovery
3
Population (resident and non resident-tourism)Reallocation of Waste Water Treatment Plants and changes in their number
decrease/unchanged
Nitrogen, phosphorus, faecal coliforms loads Solid waste
production
Changes of treatment plants location and of discharge flows
4
Water circulation Depth and width of lagoon inlets and some channelsIncrease/decrease/unchanged
Tidal currents
Bathymetry
Water residence time
Dredging
Opening and close of inlets
2.2 Models, processes and variables
The model used for scenario analysis was implemented with EcoDynamo (Pereira & Duarte, 2005). It is a coupled hydrodynamic-biogeochemical model. Implementation, calibration and validation of the hydrodynamic sub-model were described elsewhere (Duarte et al., 2005).
oxygen. Processes such as mineralization of organic matter, nitrification and denitrification were considered for nitrogen. Total and organic particulate matter concentrations (TPM and POM, respectively) are simulated following Duarte et al. (2003). Particulate organic matter (POM) is mineralized to ammonium nitrogen as described in Chapelle (1995). Oxygen is consumed in mineralization and nitrification and exchanged across the air-water interface. For more details on the ecological model and a complete listing of equations and parameters refer to Chapelle et al. (2005a and b). For macroalgae, the work of Serpa (2004) was used and for the sea grass Zostera noltii, the work of Plus et al. (2003) was followed.
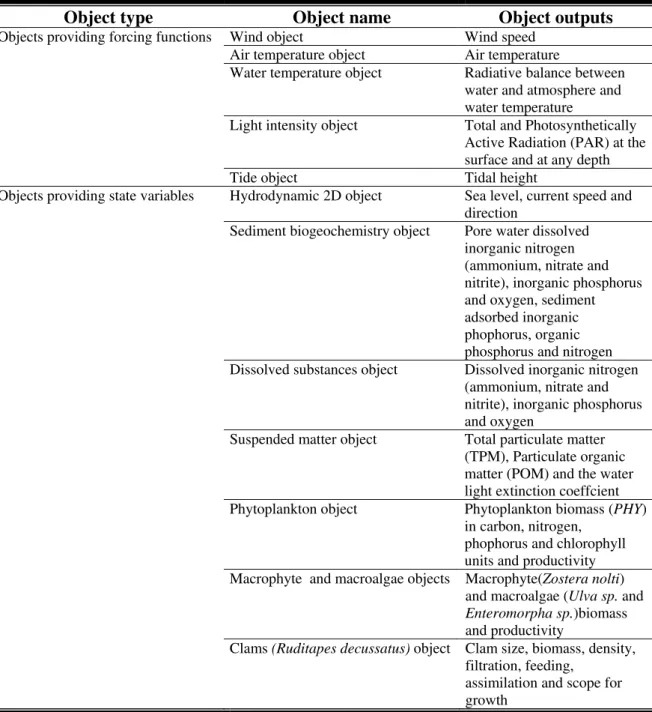
Table 2-3 – EcoDynamo objects implemented for Ria Formosa (see text).
Object type Object name Object outputs
Wind object Wind speed
Air temperature object Air temperature
Water temperature object Radiative balance between
water and atmosphere and water temperature
Light intensity object Total and Photosynthetically
Active Radiation (PAR) at the surface and at any depth Objects providing forcing functions
Tide object Tidal height
Hydrodynamic 2D object Sea level, current speed and
direction
Sediment biogeochemistry object Pore water dissolved
inorganic nitrogen (ammonium, nitrate and nitrite), inorganic phosphorus and oxygen, sediment adsorbed inorganic phophorus, organic phosphorus and nitrogen
Dissolved substances object Dissolved inorganic nitrogen
(ammonium, nitrate and nitrite), inorganic phosphorus and oxygen
Suspended matter object Total particulate matter
(TPM), Particulate organic matter (POM) and the water light extinction coeffcient Objects providing state variables
Phytoplankton object Phytoplankton biomass (PHY)
in carbon, nitrogen, phophorus and chlorophyll units and productivity
Macrophyte and macroalgae objects Macrophyte(Zostera nolti)
and macroalgae (Ulva sp. and
Enteromorpha sp.)biomass
and productivity
Clams (Ruditapes decussatus) object Clam size, biomass, density,
The model is forced by tidal height at the sea boundaries and river discharges. These were calculated from meteorological and watershed data with the SWAT model (for details see Guerreiro & Martins, 2005).
EcoDynamo was implemented using the object oriented programming paradigm as described in Pereira & Duarte (2005). Implemented objects and corresponding simulated biogeochemical processes and variables are synthesized in Table 2-3.
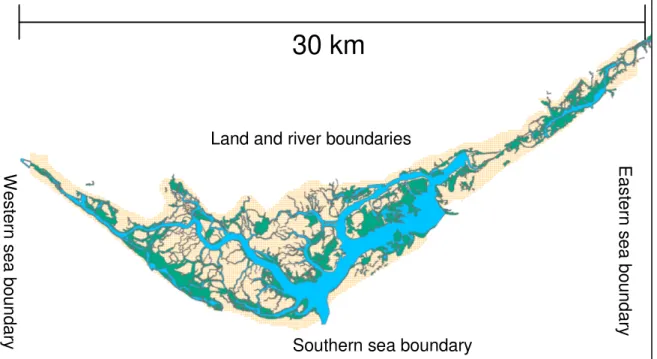
2.3 Spatial and temporal scales
W e s te rn s e a b o u n d a ry E a s te rn s e a b o u n d a ry
Southern sea boundary Land and river boundaries
30 km
Fig. 2-1 – Model domain covering a total area of 546 km2 (whole rectangle) and 98 km2 (only the area of covered by the lagoon), for the hydrodynamic and biogeochemical simulations,
respectively. Spatial resolution is 100 mm. Time step is 3 and 30 seconds for the hydrodynamic and the biogeochemical simulations, respectively (see text).
2.4 Description of scenarios analysed
The scenario analysis presented in this report includes the four scenario sets (1 – 4) depicted in Table 2-2, without a complete analysis of all possible scenarios within each set. In fact, the large computing time required for the model simulations, prevented a more detailed analysis. However, scenarios analysed so far were chosen for their larger importance and represent a significant part of all possible management options suggested by end-users.
2.4.1 Scenario set 1 – Bivalve farming
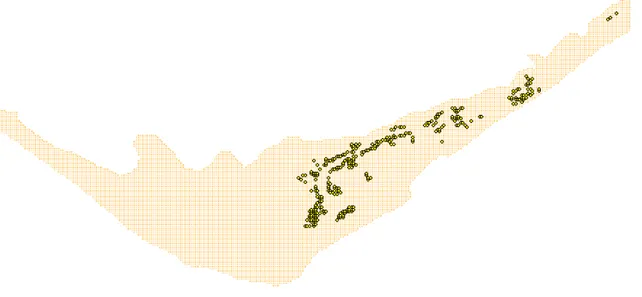
Scenarios analysed are related to changes in clam (Ruditapes decussatus) density (cf. Table 2-2). Current cultivation densities correspond to 400 bivalves per square meter over the cultivation areas (Fig. 2-2). Simulations were carried by increasing it two and three fold. Obtained results were compared with a standard simulation (with the “normal” density) in terms of bivalve growth and water quality parameters – ammonium, oxygen, particulate matter and phytoplankton concentrations.
Fig. 2-2 – Spatial distribution of bivalve (Ruditapes desussatus) rearing areas in Ria Formosa.
2.4.2 Scenario set 2 – Use of salt-marsh areas
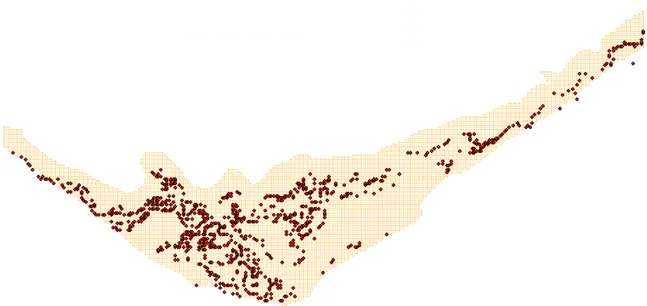
Fig. 2-3 – Spatial distribution of salt-marshes in Ria Formosa.
2.4.3 Scenario set 3 – Population / Waste water treatment
The present simulation set was not carried out with full model complexity. Only the “Wind”, “Air temperature”, “Water temperature”, “Tide”, Hydrodynamic 2D”, “Dissolved substances” and “Suspended matter” objects were considered (cf. – Table 2-3).
ammonium and phosphate. When “Dissolved substances” is treated as conservative, ammonium may increase due to POM mineralization, but nitrification and denitrification do not occur. In all simulations, the model was initialized with values well within the range of those observed in Ria Formosa and obtained from a data base created within the DITTY project (http://www.dittyproject.org/). Both simulation sets were run to simulate a period of one month.
Furthermore, WTP location was analysed in the light of water residence times calculated with the model for different areas of the lagoon to access their dilution capacity. Water residence times were calculated with the hydrodynamic model as described previously (Duarte et al., 2005). Table 2-4 synthesis simulations used for this scenario set.
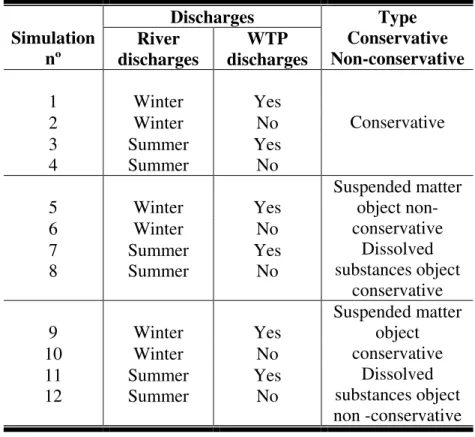
Table 2-4 – Synthesis of some simulations analysed in the present work with simplified biogeochemistry, designed to evaluate the relative importance of river discharges and WTP loads in some water quality variables. For conservative simulations a zero value was assumed
for all biogeochemical rate constants regarding mineralization, nitrification and denitrification. For non-conservative simulations the values reported in Chapelle (1995) were
used with oxygen and temperature limitation (cf. – Methodology – Simulations).
2.4.4 Scenario set 4 – Water circulation
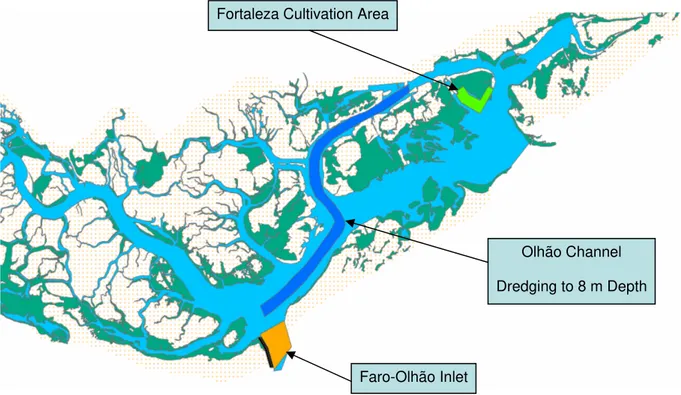
These scenarios reproduce changes in lagoon bathymetry and/or inlet width resulting from hypothetical dredging and sediment accretion operations within some areas (Fig. 2-5). The details on each scenario are shown in Figs. 2-5 – 2-8, including the locations of the dredging operations and depth to which channels were “virtually” dredged. Ramalhete and Fuzeta channels (Figs 2-6, 2-7 and 2-8) have depths between c.a. 0 and 3 m. After the virtual dredging their depth would be 2 m and a new inlet is created in Fuzeta. In the Olhão channel, dredging to 8 m (Figs. 2-5 and 2-7) would correspond to more than a two fold increase in original depth for most of the channel area. In the case of “Fortaleza cultivation area scenario” (Figs. 2-5 and 2-7), the change corresponds to sediment accretion until a level above the hydrographic zero. This is to simulate a current practice among bivalve producers of adding
Discharges Simulation nº River discharges WTP discharges Type Conservative Non-conservative
1 Winter Yes
2 Winter No
3
4 Summer Summer Yes No
Conservative
5 Winter Yes
6 Winter No
7 8 Summer Summer Yes No Suspended matter object non-conservative Dissolved substances object conservative
9 Winter Yes
10 Winter No
sand to their rearing areas, in order to improve sediment quality for bivalve growth. Regarding “Faro-Olhão inlet scenario” (Figs. 2-5 and 2-7), the change corresponds only to an increase in inlet width by c.a. 100 m.
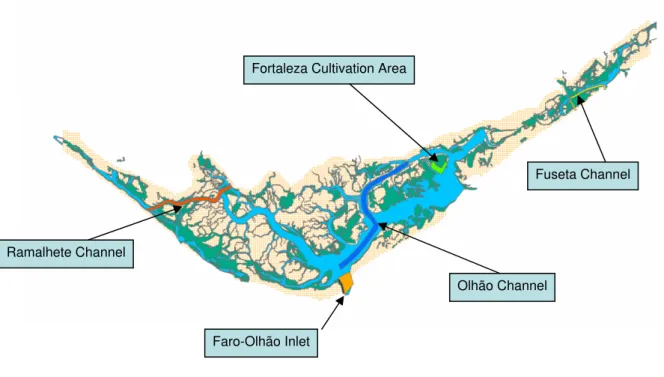
Fig. 2-5 – Location of the considered scenarios.
Fig. 2-6 – Ramalhete Channel dredging scenario.
Ramalhete Channel
Faro-Olhão Inlet
Olhão Channel Fortaleza Cultivation Area
Fuseta Channel
Ramalhete Channel
Fig. 2-7 – Olhão channel, Faro-Olhão inlet and Fortaleza cultivation area scenarios.
Fig. 2-8 – Fuseta channel dredging scenario.
Results obtained for each scenario, with the hydrodynamic and the biogeochemical model (offline simulation mode – cf. – 2.3), were compared with model validation regarding current velocity and tidal height at current meter and tidal gauge stations, depicted in Fig. 2-9, and
Faro-Olhão Inlet
Olhão Channel
Dredging to 8 m Depth Fortaleza Cultivation Area
Fuseta Channel
water quality and sediment variables. Furthermore, monthly integrated residual input and output flows were obtained for all simulations.
Fig. 2-9 – GIS image showing the location of current meter and tide-gauge stations surveyed by the Portuguese Hydrographic Institute in 2001 (IH, 2001) and used for model calibration
(see text).
3 Results and discussion
3.1.1 Scenario set 1 – Bivalve farming
Table 3-1 summarizes results obtained with simulations carried out with different R. decussatus densities - ranging from a biomass of 1 till 3 kg (fresh weight) m-2 – regarding ammonium, oxygen, particulate organic and total matter concentrations and clam biomass, averaged over a period of one month, for bivalve rearing areas (Fig. 2-2). Obtained results suggest that increasing bivalve biomass leads to an increase in ammonium and a decrease in all remaining water quality variables, over bivalve rearing areas.
simulations, suggests that a three fold increase in initial biomass leads to a c.a. two fold increase in average biomass (used here as a surrogate for production). Therefore, increasing bivalve biomasses within the limits tested so far implies reducing significantly bivalve growth, due to food limitation, and worsening water quality. This reduction in bivalve growth is in accordance with farmer’s experience, suggesting that increasing cultivation density over 1 kg (fresh weight) m-2 leads to increased mortality. This increased mortality may be, partly, explained by the predicted decreases in water quality and food availability.
The relative reduction in particulate organic matter (POM), with the increase in clam biomass, is larger than the corresponding reduction in chlorophyll. In fact, chlorophyll represents a small fraction of suspended organics (c.a. 10%), suggesting that bivalves depend mostly on suspended detritus for food in Ria Formosa.
Table 3-1 – Concentrations of several water quality variables (POM – Particulate organic matter; TPM – Total particulate matter) and R. decussatus biomass averaged over one month,
for bivalve rearing areas (cf. – Fig. 2-2). Initial biomass densities were 1, 2 and 3 kg (fresh weight) m-2 for normal, double and triple densities, respectively.
Ammonium
µµµµmol L-1
Oxygen mg L-1
POM mg L-1
TPM mg L-1
Phytoplankton
µµµµg Chl L-1
R. decussatus
kg (FW) m-2
Normal
density 11.4 8.2 1.7 7.6 0.33 1.4
Double
density 17.7 8.1 1.2 6.8 0.29 2.2
Triple
density 24.7 7.9 1.0 6.2 0.27 3.0
3.1.2 Scenario set 2 – Use of salt-marsh areas
sink-source processes were considered. Furthermore, without considering these processes, lagoon nitrate and ammonium concentrations were much higher than observed (up to ten fold higher). In order to analyse properly this scenario set it will be necessary to gather more data to quantify the functional role of salt marshes in Ria Formosa.
3.1.3 Scenario set 2 –Population / Waste water treatment
Table 3-2 summarizes the results of the simulations described in 2.4.3. The results obtained suggest that average values for all variables included are reduced under summer river flows. This reduction is nearly 100% for nitrate with a poor influence of water column biogeochemical processes. The largest effect on nitrate is explained by its high concentrations in river water (values in excess of 500 µmol N L-1). These high nitrate loads may probably be explained by intensive use of fertilizers at the extensive agricultural areas drained by the river network. However, the model predicts a rapid decline in nitrate concentrations with distance from river mouths (Fig. 3-2). It is noteworthy that ammonium concentrations practically double when TPM or nutrients are treated as non-conservative (Table 2-4, simulations 5 - 12), as a result of POM mineralization or denitrification, respectively. This doubling is much larger than the combined effect of river and WTP discharges. It is also relevant to see that WTP discharges seem to contribute more than river discharges for ammonium concentrations.
The results presented here are not in full accordance with the classification of Ria Formosa as “Coastal waters” by INAG (2005). The classification as “Transitional waters”, implying a substantial influence by freshwater flows (EU, 2000), seem to apply when river discharges are relevant, namely, in winter months and in the case of nitrate.
(2000), whereas nitrogen and phosphorus contents were taken from Valiela (1995). A similar approach was followed for phytoplankton, from primary production estimates reported in Duarte et al. (2003).
Results obtained are summarized in Table 3-3, together with daily river nitrogen and phosphorus discharges. It is noteworthy that the values presented are only approximate, since they do not take into account subtidal biomasses of benthic species, however, they seem to show that the contribution of river nutrient discharges to primary production, corresponds roughly to macroalgae nitrogen and phosphorus consumption. They also suggest that primary producers may be ordered by decreasing production rates and nutrient consumptions as phytoplankton, Zostera noltii, Spartina maritima and macroalgae. This contradicts results obtained by other authors in shallow coastal lagoons and bays, where macroalgae production dominates over phytoplankton (Sfriso et al., 1992; Valiela et al., 1992; McGlathery et al., 2001). The lower phytoplankton production has been attributed to nutrient competition between macroalgae and phytoplankton (Fong et al., 1993; Thybo-Christensen & Blackburn, 1993; McGlathery et al., 1997) and to water residence times shorter than phytoplankton duplication ratio (Valiela et al., 1997). This contradiction may be tentatively explained by:
(i) Benthic production does not seem to be macroalgae dominated in Ria Formosa, with rooted macrophytes playing an important role (Table 3-3). In fact, macroalgae tend to dominate as lagoons become eutrophic (Harlin, 1995), which is not the case of Ria Formosa.
Table 3-2 – Summary of simulations described in Table 2-4. All results are in µmol L-1 for nutrients and mg L-1 for TPM and POM (see text).
Ammonium Nitrate Nitrite Phosphate TPM POM
Simulation
Average Max Average Max Average Max Average Max Average Max Average Max
1 0.50 4.23 4.24 674.69 0.12 3.01 0.43 17.05 6.06 40.00 0.26 5.53
2 0.36 4.23 4.23 674.69 0.12 3.01 0.41 17.05 6.06 40.00 0.25 5.53
3 0.49 4.23 2.76 674.69 0.12 3.01 0.40 17.05 6.04 40.00 0.25 5.53
4 0.36 4.23 2.74 674.69 0.12 3.01 0.38 17.05 6.04 40.00 0.25 5.53
5 0.95 4.23 4.24 674.69 0.12 3.01 0.44 17.05 6.04 40.00 0.23 5.53
6 0.81 4.23 4.23 674.69 0.12 3.01 0.42 17.05 6.03 40.00 0.23 5.53
7 0.97 4.23 2.76 674.69 0.12 3.01 0.41 17.05 6.02 40.00 0.22 5.53
8 0.82 4.23 2.74 674.69 0.12 3.01 0.39 17.05 6.01 40.00 0.22 5.53
9 0.83 13.49 3.88 674.69 0.12 3.01 0.43 17.05 6.06 40.00 0.26 5.53
10 0.75 13.01 3.8 674.69 0.12 3.01 0.41 17.05 6.06 40.00 0.25 5.53
11 0.62 14.12 2.58 674.69 0.12 3.01 0.40 17.05 6.04 40.00 0.25 5.53
Fig. 3-2 – Nitrate concentration isolines predicted by the model after simulating a period of 15 days with river and WTP inflows (upper) and without inflows (lower). The plot inserted in the upper figure shows the decrease in nitrate concentration as a function of distance from river mouth, for one of the rivers. Numbers at both axes of the isoline plots refer to model grid line
Table 3-3 – Estimates of nitrogen and phosphorus daily consumptions by main primary producers in Ria Formosa, from production figures and known Redfield ratios, and river
discharges (see text).
3.1.4 Scenario set 4 – Water circulation
The integration of flows across the inlets made possible to estimate their average input-output values for a period of a month. In Fig. 3-1, a synthesis of obtained results over the whole Ria shows that the Faro-Olhão inlet is by far the most important, followed by Armona, “new” and Fuzeta inlets. It is also apparent that the Faro-Olhão has a larger contribution as an inflow pathway, whereas the remaining ones contribute more as outflow pathways. The small difference between inflow and outflow total values do not imply any violation of volume conservation, but solely that during the period considered there was a net exchange of volume between the Ria and the sea. The results obtained suggest that part of the water that enters the Ria though the Faro-Olhão inlet is distributed west and eastwards, probably reducing the flood period in other areas. The results presented in Table 3-4 suggest that ebb period is larger than the flood period. This may result from ebb water taking more time to reach the ocean by outflowing only thought nearby inlets, whereas during the flood, there seems to be some volume redistribution among different inlets. Water residence time (considering a 90% washout) ranges from less than one day, near the inlets, to more than two weeks, at the inner areas, with an average value of 11 days.
The effects of several changes in lagoon bathymetry on current velocities at chosen points, water residence times and time integrated flows across the inlets are summarised in Tables 3-4 and 3-5. Obtained results show that channel deepening tends to increase water residence time, presumably due to the corresponding increase in lagoon volume, whereas sand accretion
Nitrogen (kg d-1) Phosphorus (kg d-1)
Spartina maritima 289 - 552 19 – 37
Zostera noltii 473 - 647 31 - 43
Macroalgae 189 27
Phytoplankton 546 76
at the “Fortaleza Growing Area” has the opposite effect. There are some exceptions, but these correspond to less than 1% changes in water residence times. The “Fuseta Channel” scenario (Fig. 2-5) exhibits the largest outflow reduction across the “New” and the “Fuzeta” inlets. This may be viewed as a negative impact, since outflow reduction may increase sand accumulation within the lagoon. These trends suggest that bathymetric changes in one side of the lagoon may have impacts tens of km away.
“new” inlet “new”
inlet
Faro -Olhão Faro -Olhão
Armona Fuzeta 226 142 1768 2033 1082 1133 141 157
“new” inlet
Faro - Olhão
Armona
Fuzeta
336 292 1952 2096 1234 1259 144 210Fig. 3-1– Averaged inflows and outflows (m3 s-1) through Ria Formosa inlets (see text).
Table 3-4 – Predicted average ebb and flood current velocities and periods at the current meter stations depicted in Fig. 1 for the “Western” Ria Formosa (see text).
Ebb Flood
Station Average current velocity (cm s-1)
Period (h) Average current velocity (cm s-1)
Period (h)
Ancão 17.90 7.16 24.57 5.20
Faro-Harbour 50.69 6.10 39.49 6.06
Olhão-Canal de Marim
32.30 6.72 31.07 5.47
Table 3-5 – Summary of 50, 90 and 99% water residence time, inflow and outflow changes in relation to the standard scenario (see text).
Variations (%)
Residence Times Flows
Scenarios
50% RT 90% RT 99% RT Inlets Inflows Outflows
"New Inlet" 64.0 -5.3 Faro-Olhão 8.6 19.5 Armona 12.4 10.2 Ramalhete Channel 1.6 10.0 6.0
Fuseta -12.4 20.4 "New Inlet" 64.0 -8.5 Faro-Olhão -1.9 11.6 Armona 2.8 7.5 Faro-Olhão Inlet 24.4 28.7 13.9
Fuseta -18.0 13.1 "New Inlet" 75.8 -3.5 Faro-Olhão 9.7 18.2 Armona 7.3 7.6 Olhão Channel -0.3 0.6 0.1
Fuseta -8.7 17.0 "New Inlet" 72.8 -3.2 Faro-Olhão 8.3 16.4 Armona 12.1 10.5 Fuseta Channel 44.2 75.1 26.4
Fuseta -46.9 -22.6 "New Inlet" 77.5 -5.9
Faro-Olhão 8.1 15.9 Armona 10.7 8.4 Fortaleza Growing
Area -1.5 -1.4 -2.0
Fuseta -10.6 19.3
As mentioned before, both scenarios lead to a slight increase in water residence residence time. Therefore, the decrease in nutrient concentrations probably results from an increase in exchanges with the sea over the dredged areas. The ammonium reduction may be viewed as an improvement in water quality, according to the IFREMER classification scheme (Austoni et al., 2004).
Table 3-6 – Average values for eight water columns variables integrated over a period of one year for the three Standard simulation, the Olhão Channel simulation and the Ramalhete
Channel simulation (cf. – Methodology – Scenario analysis).
Variables Standard
simulation
Olhão Channel
Ramalhete Channel
Ammonium 8.58 7.44 5.08
Nitrate µmol L-1 8.18 4.23 3.58
Nitrite 0.03 0.01 0.07
Phosphate 0.90 0.76 0.53
Oxygen 8.28 8.29 8.33
POM mg L-1 2.70 2.67 3.80
TPM 13.34 12.76 13.08
Phytoplankton µg Chl L-1 0.40 0.40 0.43
Table 3-7 – Average values for eight sediment and pore water variables integrate over a period of one year for the three Standard simulation, the Olhão Channel simulation and the
Ramalhete Channel (cf. – Methodology – Scenario analysis).
Variables Standard
simulation
Olhão Channel
Ramalhete Channel
C Organic 4105.89 4108.78 4156.31
N Organic µg g-1 215.59 215.16 199.14
P Organic 51.62 51.16 46.74
P Adsorbed 5.63 5.47 4.43
NH4 In Pore Water 22.34 21.02 21.20
NO3 In Pore Water µmol L
-1
7.74 4.01 2.63
PO4 In Pore Water 2.86 2.78 2.31
4 Conclusions
The results presented and discussed regarding the various management scenarios analysed so far suggest that increasing bivalve densities in rearing areas may lead to a relatively important decline in water quality and bivalve growth. Apparently, WTP contribution is mainly though ammonium discharges, although riverine nitrate-nitrogen inputs are much larger. Although bacterial contamination was not yet analysed in the present work, it should be included in future scenario analysis. A bacterial object will be included in EcoDynamo to allow such analysis. The results presented are not in full accordance with the classification of Ria Formosa as “Coastal waters” by INAG (2005). The classification as “Transitional waters”, (EU, 2000), seem to apply here, considering the influence of river discharges, namely, in winter months and in the case of nitrate. The suggested changes in lagoon bathymetry, tend to increase water residence time and may produce hydrodynamic effects (e.g. changes in inlet residual flows) at tens of km away. Dredging operations is two of the main navigation channels (Olhão and Ramalhete) may have a positive impact on water and sediment quality by inducing reductions in water column and sediment pore water nutrients, as well as on sediment organic contents.
5 References
Aníbal, J., 1998. Impacte da macroepifauna sobre as macroalgas Ulvales (Chlorophyta) na Ria Formosa. MSc Thesis. Coimbra University, 73 pp.
Austoni, M., Viaroli, P., Giodani, G. & J.M. Zaldíval, 2004. Intercomparison among the test sites of the DITTY project using the IFREMER classification scheme for coastal lagoons. Institute for Environment and Sustainability, Island and Waters Unit. Available at
http://www.dittyproject.org/Reports.asp.
Brock, T.D., 1981. Calculating solar radiation for ecological studies. Ecological Modelling 14: 1-9.
Cachola, R., 1996. Viveiros de ameijoa boa (Ruditapes decussata) da região Algarvia. INIP, 134 pp.
Chapelle, A., 1995. A preliminary model of nutrient cycling in sediments of a Mediterranean lagoon. Ecological Modelling 80: 131-147.
Chapelle, A., C. Bacher, P. Duarte, A. Fiandrino, L. Galbiati, D. Marinov, J. Martinez, A. Norro, A. Pereira, M. Plus, S. Rodriguez, G. Tsirtsis & J.M. Zaldívar, 2005a. Modelling report. Coastal lagoon modelling: An integrated approach. Available at
http://www.dittyproject.org/Reports.asp.
Chapelle, A., Duarte, P., Fiandrino, A., Galbiati, L., Marinov, D., Martinez, J., Norro, A., Somma, F., Tsirtis, G., Zaldívar, J.-M., et al., 2005b. D15. Comparison between different modelling approaches. EVK3-CT-20022-00084 (DITTY Project).
Duarte, P., R. Meneses, A.J.S. Hawkins, M. Zhu, J. Fang & J. Grant, 2003. Mathematical modelling to assess the carrying capacity for multi-species culture within coastal water. Ecological Modelling 168: 109-143.
Duarte, P. et al., in prep. Biogeochemical Modelling of Ria Formosa (South Coast of Portugal) with EcoDynamo. Part 1. Model description.
European Union (EU), 2000. Directive 2000/60/EC of the European Parliament and of the Council establishing a framework for the Community action in the field of water policy. Official Journal of the European Communities, 22/12/2000.
Falcão, M., 1997. Dinâmica de nutrientes na Ria Formosa: efeitos da interacção da laguna com as suas interfaces na reciclagem do azoto, fósforo e sílica. PhD Thesis, Universidade do Algarve, 223 pp.
Falcão, M. & C. Vale, 1990. Study of the Ria Formosa ecosystem: benthic nutrient remineralization and tidal variability of nutriens in the water. Hydrobiologia 207: 137-146.
Falcão, M. & C. Vale, 1995. Tidal flushing of ammonium from intertidal sediments of Ria Formosa, Portugal. Netherlands Journal of Aquatic Ecology, 29 (3-4): 239-244.
Falcão, M. & C. Vale, 1998. Sediment-water exchanges of ammonium and phosphate in intertidal and subtidal areas of a mesotidal coastal laggon (Ria Formosa). Hydrobiologia 373/374: 193-201.
Falcão, M. & C. Vale, 2003. Nutrient dynamics in a coastal lagoon (Ria Formosa, Portugal): The importance of lagoon-sea water exchanges on the biologic productivity. Ciencias Marinas, 29 (3): 425-433.
Falcão, M, Fonseca, L., Serpa, D., Matias, D., Joaquim, S., Duarte, P., pereira, A., Martins, C. & M.J. Guerreiro, 2003. Synthesis report. EVK3-CT-20022-00084 (DITTY Project).
Guerreiro, M.J. & C. Martins, 2005. Calibration of SWAT Model: Ria Formosa Basin (South Coast of Portugal). DITTY report. Available at http://www.dittyproject.org/Reports.asp.
Instituto Hidrográfico (IH), 2001. Proj. OC4102/01, Maria Formosa, Relatório Técnico Final, Rel. TF. OC 04/2001, Monitorização Ambiental. Instituto Hidrográfico, Divisão de Oceanografia.
Harlin, M.M., 1995. Changes in major plant groups following nutrient enrichment. In: McComb, A.J. (eds.), Eutrophic shallow estuaries and lagoons. CRC Press: 173 – 187.
Instituto da Água (INAG), 2005. Relatório síntese sobre a caracterização das regiões hidrográficas prevista na Directiva-Quadro da água. Instituto da Água, Ministério do Ambiente, do Ordenamento do Território e do Desenvolvimento Regional.
MAOT (Ministério do Ambiente e do Ordenamento do Território), 2000. Plano de Bacia Hidrográfica das Ribeiras do Algarve – Caracterização Geral da Bacia Hidrográfica, 1ª Fase – Análise e Diagnóstico da Situação de Referência, Vol. III.
McGlathery, K.J., I.C.Anderson & A.C.Tyler, 2001. Magnitude and variability of benthic and pelagic metabolism in a temperate coastal lagoon. Marine Ecology Progress Series 216: 1-15.
McGlathery KJ, Krause-Jensen D, Rysgaard S, Christensen PB (1997) Patterns of ammonium uptake within dense mats of the filamentous macroalgae Chaetomorpha linum. Aquatic Botany 59: 99–115.
Mudge & Bebianno, 1997. Sewage Contamination Following an Accidental Spillage in the Ria Formosa, Portugal. Marine Pollution Bulletin, vol. 34, n.º 3: 163-170.
Newton, A., J. Icely, M. Falcão, A. Nobre, J. Nunes, J. Ferreira & C. Vale, 2004. Evaluation of eutrophication in Ria Formosa coastal lagoon, Portugal. Continental Shelf Research, 23: 1945-1961
Plus, M., A. Chapelle, A. Ménesguen, J.M. Deslous-Paoli & I. Auby, 2003. Modelling seasonal dynamics of biomasses and nitrogen contents in a seagrass meadow (Zostera noltii Hornem.): application to the Thau lagoon (French Mediterranean coast). Ecological Modelling 161: 213-238.
POOC (Plano de Ordenamento da Orla Costeira entre Vilamoura e Vila Real de Santo António) 1997. Estudos de base - Caracterização da zona de intervenção. Instituto de Conservação da Natureza.
Portela, L.I. & R. Neves, 1994. Modelling temperature distribution in the shallow Tejo estuary. In: Tsakiris and Santos (eds), Advances in Water Resources Technology and Management, Balkema, Rotterdam: 457-463.
Santos, R., M. Sprung, R. Machás, J. Aníbal, N. Dias, L. Mata, V. Vieira, F. Piedade, L. Pérez-Lloréns, I. Hernández, J. Vergara & G. Peralta, 2000. Produção bentónica e fluxos de matéria orgânica na Ria Formosa, Algarve, Portugal. Final report of the INTERREG II Project (contract nº 12/REG/6196).
Serpa, D., 2004. Macroalgal (Enteromorpha spp. and Ulva spp.) Primary Productivity in the Ria Formosa Lagoon. MSc thesis, Universidade Nova de Liaboa.
Sfriso, A., B. Pavoni, A. Marcomini & A.A. Orio, 1992. Macroalgae, nutrient cycles, and pollutants in the Lagoon of Venice. Estuaries 15: 517 – 528.
Thybo-Christesen M & T.H. Blackburn, 1993. Internal N-cycling, measured by 15NH4+ dilution, in Cladophora sericea in a shallow Danish bay. Marine Ecology Progress Series 100: 283–286.
Vale, C., J. Hussenot, M. Falcão & J. Martin, 1992. Dawn-dusk chemical variations near the sediment-water interface of a clam-growth bank of Ria Formosa. Boletim INIP, 71-71h.