CARRYING CAPACITY EVALUATION
FOR BIVALVE SUSPENSION-FEEDERS
João Baltazar
Undergraduate students of Environmental Engineering (FCT-UFP)
José Lamas
Undergraduate students of Environmental Engineering (FCT-UFP)
Nuno Vale
Undergraduate students of Environmental Engineering (FCT-UFP)
Rui Bandeira
Environmental Engineer (UFP)
Pedro Duarte
Titular Professor (FCT-UFP)Abstract
1. INTRODUCTION
Aquaculture is a rapidly growing activity, being respon-sible for nearly half of the world production of aquatic organisms (Rheault and Rice, 1995; FAO, 2001; Watson et al., 2001). Western countries, especially China, have a large contribution to this rapid growth (Watson e Pauly, 2001). In this context, the cultivation of bivalve suspen-sion-feeders, such as mussels and oysters, gained relati-ve importance orelati-ver time.
In opposition to inish culture that demands large inputs of artiicial food, with negative impacts on environmen-tal quality, suspension-feeders capture organic particles such as detritus, bacteria and phytoplankton, though their iltering activities and depend entirely on natural food items. Over the last decades, bivalve densities and cultivation areas increased rapidly. This may have nega-tive environmental impacts though the accumulation of metabolites and faecal material, oxygen consumption and intensive bivalve iltering activities, leading to water and sediment quality degradation and negative efects over biodiversity. Ultimately, these impacts may lead to an increase on bivalve mortality (Zhang and Yang, 1999a, b) and a decrease on growth and production (Yang et al., 1998a,b, 1999; Zhang et al., 2001).
The success of bivalve cultivation depends mostly on water renewal and food input that should be fas-ter than iltration, excretion and oxygen consumption rates of cultivated organisms. Therefore, bivalve density should be kept below environmental carrying capacity (CC) (Dame and Prins, 1998). CC may be deined as the bivalve biomass or abundance that may be kept within a particular ecosystem without afecting negatively
their production and ecosystem health (Duarte, 2003). Ecosystem health may be understood as ecosystem structural and functional integrity, i.e., its biodiversity and functioning in terms of nutrient recycling, primary and secondary production (Rapport et al., 1998).
CC evaluation may be viewed as a dimensioning pro-cess. Its complexity stems from the need to integrate hydrodynamic phenomena, responsible for water and food renewal, with biogeochemical processes, respon-sible for local food production and the recycling of bivalve metabolites and faeces. Furthermore, bivalve physiological processes such as food iltration, inges-tion, absorption and metabolic losses, must also be considered namely (Dame, 1993). This complexity justi-ies the usage of mathematical models (Duarte, 2003).
The spatial resolution used to represent cultivation sys-tems is a critical issue in CC models (Duarte et al. 2005). These authors advanced the hypothesis that when bivalve abundance is integrated over areas larger than the cultivation zones, models tend to underestimate local food depletion efects, overestimating CC. The-refore, it is important that model spatial resolution is higher than the spatial scale of cultivation areas.
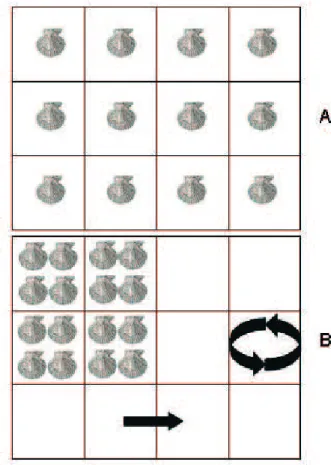
Some of these ideas are synthesized in Figure 2, with two examples of CC model grids, applied to an ideally simple rectangular domain. In one of the grids (A), bival-ves are uniformly distributed over all cells. Although, in principle, such a distribution may occur, most fre-quently, cultivation zones are concentrated in part or parts of the domain. Therefore, the bivalve distribution
presented in grid B is a more realistic example – the same total number of bivalves as in A, but concentrated in part of the domain. Models assume that properties in each cell are homogeneous i.e., cell dimensions (length) correspond to their spatial resolution. In the grid A case, it is less likely that bivalves become food limited than in grid B case, as a result of their higher local density in the latter (one bivalve per cell against four per cell, respectively), everything else being equal. Sometimes, due to the low spatial resolution of CC models, bival-ve distribution is “homogenized” obival-ver large areas. In an extreme case, all cells of Figure 2 grids could be lumped together in one large cell that could be part of a low resolution grid, covering a larger domain than the one represented in Figure 2. In such a situation, details on bivalve spatial distribution would be lost.
6
The loss of these details corresponds to a dilution of local bivalve density. When this happens, it is more likely that local food regeneration processes, computed by models, are faster than bivalve consumption, leading to a CC overestimation. Considering these arguments, one might ask why not simply using the proper spatial resolution in CC models?There are several possible answers to this question: (i) Increasing spatial resolution implies more computing time; (ii) Limited knowledge on bivalve spatial distri-bution and abundance; (iii) Lack of knowledge of the efects of “diluting” bivalve abundance on CC estimates. Model grids shown in Figure 1 are examples of spatial resolutions that do not allow distinguishing between cultivated and non-cultivated areas. For example, in case b, cultivation areas are mainly located along the margins, in the intertidal zone, not resolved by the grid. In case c, cultivation areas occupy only a very small part of cells 2 and 3. Therefore, bivalve density integrated over the whole area for each of these cells leads to an important dilution efect.
The objective of this work was to test empirically the hypothesis mentioned earlier: CC is overestimated
when model spatial resolution is inadequate to repre-sent the spatial details of bivalve abundance.
This study is part of a larger work including a similar analysis for several ecosystems, to test the mentioned hypothesis. Obtained results may be relevant for future CC evaluations, in order to avoid methodological bias.
2. METHODS
2.1 STUDY AREA
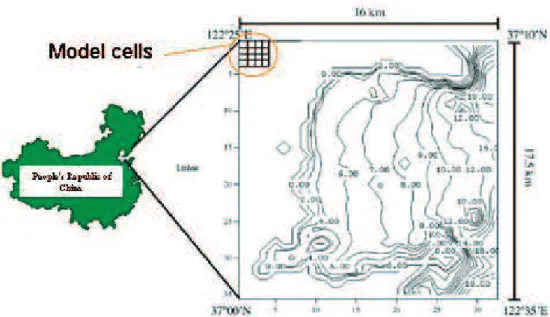
This work is based on a previous case study described by Duarte et al. (2003) about Sungo bay, located in the Shandong province, in the People’s Republic of China (37º 00’– 37º 10’ N, 122º 25’–122º 35’ E) (Figure 3). The bay has an area of c.a. 180 km2 and a depth range from zero till nearly 20 m at the sea boundary. This bay has been used for mariculture for more than 20 years (Guo et al., 1999). Main cultivated species are kelps (Laminaria japo-nica), oysters (Crassostrea gigas) and scallops (Chlamys farreri) with yearly productions of c.a. 40,000, 60,000 and 13,000 tons, respectively. Figure 4 synthesizes bivalve dis-tributions and respective densities at cultivation sites.
7
Figure 4. Sungo bay aquaculture with the location of kelp, oyster and scallops cultures and respective densities. Numbers indicating“columns” and “lines” correspond to the coordinates of the 1120 calculation cells (32 X 35).
2.2. MODEL IMPLEMENTATION
The model used in this study was described by Duarte et al. (2003), including details on state variables, equations, parameter values, calibration and validation. The present model version has some (small) diferences that will be discussed below. It is a two dimensional vertically inte-grated model (spatial variability is considered as a func-tion of longitude and latitude and vertical homogeneity is assumed), with sea and land boundaries. The irst ver-sion of this model was implemented with EcoWin (Fer-reira, 1995). The current version was implemented with EcoDynamo – a modelling software developed at Fer-nando Pessoa University (Pereira and Duarte, 2005).
Regarding calculations, the only diference between the current version and the one described by Duarte et al. (2003), is in the way phytoplankton nutrient limitation is computed. In the original version, calculations were based on inorganic nitrogen availability in the water. In the present version, calculations are made according to Jørgensen and Bendoricchio (2001), following a three sta-ge process: (i) Nutrient uptake is computed as a function of nitrogen concentration in the water and assuming a
Michaelis-Menten kinetic; (ii) Internal phytoplankton cell nutrient concentrations are updated; (iii) Photosynthesis is limited by internal nutrient concentrations, assuming a Michaelis-Menten type limitation. Necessary parame-ters were taken from the literature or estimated by model calibration. For a detailed description on equations and parameters see Duarte et al. (2006) and Duarte et al. (in press). After these changes were introduced in the model, calibration and validation were conirmed to gua-rantee that model performance remained similar to the original version.
2.3. MODEL SIMULATIONS
chan-8
ging bivalve abundance every new simulation. The expected result is a parabolic response of production, with a maximum, after which any further increase in bivalve abundance reduces production. This pattern was explained in Bacher et al. (1998). The initial increa-se in production is explained by the larger abundance of bivalves. When abundance increases over a certain level, individual bivalve growth becomes food limited and overall production decreases. At this stage, food regeneration rate is lower that food consumption by the bivalves.In this work, several simulation sets were undertaken, using the following bivalve abundances relative to refe-rence values (Figure 3): 0.5X, 1X (referefe-rence values), 2X and 3X. This procedure was performed for both bivalve species: oysters and scallops. Diferent spatial resolutions were used to represent bivalve distribution and abun-dance in each simulation set: 500X500 m (reference reso-lution), 1000X1000 m, 1500X1500 m and the whole bay. Hereafter, these sets will be referred as simulations 1, 2, 3 and 4. The larger the spatial scale, the larger the area over which bivalves are distributed, in order to simulate the efects of spatial resolution on CC evaluation. Ano-ther simulation set was carried out with the reference resolution but distributing scallops over the areas already occupied by them and over the areas occupied by kelps (Figure 3), keeping everything else equal. For this simula-tion set the following abundances were tested relative to the reference values: 1X, 2X e 3X. Hereafter, this simula-tion set will be referred as simulasimula-tion 5. In all simulasimula-tions, bivalve “seeding” and harvest timings are in accordance with current farmer practices (Duarte et al., 2003).
3. RESULTS AND DISCUSSION
Expected and model predicted oyster and scallop pro-duction per cultivation cycle are presented in Table 1 for the reference abundance (cf. – Figure 4) and a spa-tial resolution of 500X500 m. As it may be seen, predic-ted values are well within expecpredic-ted ranges - 37636 and 10735 tons of fresh weight (meat + shell) for the oysters and the scallops, respectively.
Table 1. Oyster and scallop production predicted by the model for the reference scenario (simulations 1 with a normal bivalve density (cf. – Figure 4)) and expected values (Tones of fresh weight), described in Duarte et al. (2006).
Oysters Scallops Expected values 34000 - 46000 10000 – 19000 Predicted values 37636 10735
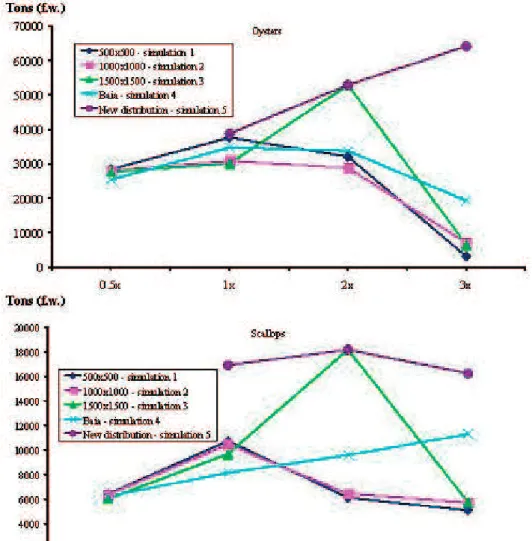
Figure 5 synthesizes bivalve production results of all simulations as a function of bivalve abundance and for the simulation sets described above (cf. – 2.3, Bacher et al., 1998; Ferreira et al., 1998). Obtained results exhi-bit the usual parabolic pattern. The exceptions to this behavior are simulations 5 results, for the oysters, and simulations 4 results, for the scallops, meaning that lar-ger abundances could be tested. In the former case, results suggest that when scallops are distributed over a larger area there is more food available for the oysters, allowing a more intense cultivation. In the latter case, obtained results suggest that when model spatial reso-lution is lowered, distributing bivalve abundance over the entire bay, production may increase until abundan-ces 3X the normal values, due to a reduction on local food depletion. This result raises the following ques-tion: Why then, under lower abundances, higher pro-ductions are obtained for simulations 1, 2 and 3? The answer may be on bay habitat qualities, i.e., food distri-bution and quality is not homogeneous, reason why a linear increase in production with bivalve “dilution” over larger areas may not occur, although this pattern may be observed for certain bivalve abundance ranges. In fact, considering simulations 1 to 4, larger productions for both species were obtained when bivalve abundan-ce is doubled and spatial resolution is 1500X1500 m (simulations 3). Another interesting result is that under abundances 3X than normal ones, predicted produc-tion increases with the reducproduc-tion in spatial resoluproduc-tion in the sequence 500X500, 1000X1000, 1500X1500 and the whole bay. This suggests that the hypothesis being tes-ted in the present work is correct, especially under large bivalve abundances, when local food depletion efects are more likely to occur and being underestimated if spatial resolution is not adequate.
fur-9
ther empirical evidence for the hypothesis being tested. Nunes et al. (2003), implemented a zero dimensional ecological model for the Sungo bay (the same ecosys-tem analysed in the present study), i.e., a model whe-re the bay is viewed as a homogeneous water body, without any type of spatial resolution. They estimated that the bay CC is 2X and 15X the actual rearing density for scallops and oysters, respectively. Duarte et al. (2003), using a two dimensional model with a 500X500m reso-lution (similar to the one used in the present work with the diferences listed above (cf. – 2.2)), concluded that Sungo bay is already being exploited at its CC for
scal-lops, whereas for the oysters, cultivation density might be increased c.a. 2X, assuming that cultivation areas remain unchanged. In the present study, as a result of the minor modiications introduced in the model implemented by Duarte et al. (2003) (cf. – 2.2), it is sug-gested that, at normal cultivation densities, oysters are also being exploited close to bay CC. These compari-sons, in spite of the diferences between the models employed, provide some additional evidence for the hypothesis being tested, suggesting that massive CC estimates may be erroneously obtained with low reso-lution models.
10
4. CONCLUSIONS
From the results obtained, the hypothesis that CC is ove-restimated when model spatial resolution is inadequate to represent the spatial details of bivalve abundance is empirically conirmed. However, results are not always consistent. In fact, CC overestimates are apparent mostly under high bivalve abundances, when food limitation is more important. Furthermore, there is not always a monotonous relationship between the mentioned ove-restimate and the reduction in spatial resolution, except under higher abundances. These “irregularities” may be explained by the fact that when bivalves are distributed over larger areas, part of them may be conined to low food concentration zones, leading to a local reduction on predicted production that may be not compensa-ted by the decrease in local food depletion. Obtained results demonstrate the importance of representing in detail cultivation areas and suggest that part of the models described in the literature may overestimate CC. This is quite relevant, since overestimating CC may be environmentally more damaging than its underes-timation.
REFERENCES
BacheR, c., DuaRte, P., FeRReiRa, J.G., héRaL, M. e RaiLLaRD., O. (1998). Assessment and Compari-son of the Marennes-Oléron Bay (France) and Carling-ford Lough (Ireland) Carrying Capacity with Ecosystem Models. In: Aquatic Ecology, Volume 31, pp. 379 – 394.
DaMe, R.F. (1993). Bivalve Filter Feeders in Estuarine and Coastal Ecosystem Processes. In: Springer-Verlag, 1993, Berlin, pp. 579.
DaMe, R.F. e PRiNs, t.c. (1998). Bivalve Carrying Capa-city in Coastal Ecosystems. In: Aquat. Ecol. Volume 31, pp. 409–421.
DuaRte, P. (2003). A Review of Current Methods in the Estimation of Environmental Carrying Capacity for Bival-ve Culture in Europe. In: Yu, Y. e Bermas, N. (eds.). Deter-mining Environmental Carrying Capacity of Coastal and Marine Areas: Progress, Constraints and Future Options, pp. 37-51. PEMSEA Workshop Proceedings Nº. 11, 156 pp.
DuaRte, P., MeNeses, R., hawkiNs, a. J. s., Zhu, M., FaNG, J. e GRaNt, J. (2003). Mathematical Modelling to Assess the Carrying Capacity for Multi-Species Culture
within Coastal Waters. In: Ecological Modelling, Volume 168, pp. 109-143.
DuaRte, P., hawkiNs, a.J.s e PeReiRa, a. (2005). How Does Estimation of Environmental Carrying Capacity for Bivalve Culture Depend upon Spatial and Temporal Sca-les? In: Dame, R. and Olenin, S. (eds.). The Comparative Role of Suspension Feeders in Aquatic Systems (NATO ARW in Nida, Lithuania, 3-9 October, 2003, pp. 121-135. Kluwer Scientiic Publishers, Dordrecht, The Netherlands.
DuaRte, P., PeReiRa, a., FaLcãO, M., seRPa, D., RiBei-RO, c., BaNDeiRa, R. e aZeVeDO, B. (2006). Biogeoche-mical Modelling of Ria Formosa (South Coast of Portugal)
with EcoDynamo. Model Description. Fernando Pessoa
University. (private communication).
DuaRte, P., aZeVeDO, B., RiBeiRO, c., PeReiRa, FaL-cãO, M., seRPa, D., BaNDeiRa, R. e Reia, J. (2007). Management Oriented Mathematical Modelling of Ria Formosa (South Portugal). In: Transitional Waters Mono-graph, Volume1, pp. 13-51.
FaO, (2001). The State of World Fisheries and Aquaculture
(SOFIA). Rome, FAO - Food and Agriculture Organization
of the United Nations.
FeRReiRa, J.G. (1995). EcoWin – An Object-Oriented Ecological Model for Aquatic Ecosystems. In: Ecological
Modelling, Volume 79, pp. 21-34.
FeRReiRa, J.G., DuaRte, P., e BaLL, B. (1998). Tro-phic Capacity of Carlingford Lough for Oyster Culture – Analysis by Ecological Modelling. In: Aquatic Ecology,
Volume 31, pp. 361–378.
GuO, X., FORD, s. e ZhaNG, F. (1999). Molluscan Aqua-culture in China. In: Journal of Shellish Research, Volume 18, pp. 19-32.
JøRGeNseN, s.e. e BeNDORicchiO, G. (2001). Funda-mentals of Ecological Modelling. In: Developments in Ecological Modelling, 21. Elsevier, Amsterdam, 530 pp.
NuNes, J. P., FeRReiRa, J. G., GaZeau, F., LeNcaRt-siLVa, J., ZhaNG, X. L., Zhu, M. Y. e FaNG, J. G. (2003). A Model for Sustainable Management of Shellish Poly-culture in Coastal Bays. In: Aquaculture, Volume 219, pp. 257-277.
PeReiRa, a. e DuaRte, P. (2005). EcoDynamo Ecologi-cal Dynamics Model Application. Fernando Pessoa Uni-versity, (private communication).
RaPPORt, D., cOstaNZa, R e ePsteiN, P.R. (eds.) (1998). Ecosystem Health. Blackwell Science.
11
VaN DeR tOL, M.w.M. e schOLteN, h. (1998). A ModelAnalysis on the Efect of Decreasing Nutrient Loads on the Biomass of Benthic Suspension Feeders in the Oos-terschelde Ecosystem (SW Netherlands). In: Aquatic Eco-logy, Volume31, pp. 395-408.
watsON, R., PaNG, L. e PauLY, D. (2001). The Marine Fisheries of China: Development and Reported Catches.
In: Fisheries Centre Research Report, Volume 9, Nº. 2. Univ. British Colombia, Canada.
watsON, R. e PauLY, D. (2001). Systematic Distortions in World Fisheries Catch Trends. In: Nature, Volume 414, pp. 534– 536.
YaNG, h. s., ZhaNG, t., waNG, P., he, Y. c. e ZhaNG, F. s. (1998a). Efects of Temperature on Oxygen Con-sumption and Ammonia-N Excretion of Chlamys farreri.
In: Chin. J. Oceanol. Limnol. Volume 16, pp. 167–172.
YaNG, h. s., ZhaNG, t., waNG, J., waNG, P., he, Y. c. e ZhaNG, F. s. (1998b). Efects of Temperature on Oxy-gen Consumption and Ammonia- N Excretion of the Southern Bay Scallop Argopecten Irradians Concentri-cus. In: Acta Oceanol. Sin. Volume 20, pp. 91–96 (in Chi-nese, with English abstract).
YaNG, h. s., ZhaNG, t., waNG, J., waNG, P., he, Y. e ZhaNG, F. (1999). Growth Characteristics of Chlamys farreri and its Relation with Environmental Factors in Intensive Raft-Culture Areas of Sishiliwan Bay, Yantai. J.
In: Shellish Res., Volume 18, pp. 71–83.
ZhaNG, F. s. e YaNG, h. s. (1999a). Analysis of the Cau-se of Mass Mortality of Farming Chlamys farreri in Sum-mer in Coastal Areas of Shandong, Chin. Mar. In: Sci. Volume 1, pp. 44–47 (in Chinese, with English abstract).
ZhaNG, F. s. e YaNG, h. s. (1999b). Strategic and Counter Measures to Resolve Mass Mortality Problems of Chlamys farreri. Mar. In: Sci., Volume 2, pp. 38–42 (in Chinese, with English abstract).