RESUMO: “Constituintes químicos de Astragalus annularis Forssk. and A. trimestris L., Fabaceae.” A investigação química das partes aéreas de Astragalus annularis Forssk. e A. trimestris L., Fabaceae, do Egito, resultou no isolamento de oito compostos, pela primeira vez nestas duas espécies. Estes compostos foram identificados por métodos químicos, espectroscopia de RMN, espectroscopia UV, bem como análise de EM. A atividade antimicrobiana dos compostos isolados foi testada contra Staphylococcus aureus, Escherichia coli e Candida albicans.
Unitermos: Fabaceae, Astragalus, saponinas, lavonoids, atividade antimicrobiana.
ABSTRACT: The phytochemical investigation of the aerial parts of Astragalus annularis
Forssk. and A. trimestris L., Fabaceae, growing in Egypt, resulted in the isolation of eight compounds, for the first time from these two species. These compounds were identified by chemical methods, NMR spectroscopy, UV spectroscopy as well as MS analysis. The antimicrobial activity of the isolated compounds were tested against Staphylococcus aureus, Esherichia coli and Candida albicans.
Keywords: Fabaceae, Astragalus, oleanane saponins, flavonoids, antimicrobial activity. Brazilian Journal of Pharmacognosy
20(6): 860-865, Dez. 2010
Article
Received 27 Oct 2009; Accepted 29 Apr 2010; Available online 26 Nov 2010.
Chemical constituents from
Astragalus annularis
Forssk. and
A. trimestris
L., Fabaceae
Amr M. El-Hawiet,
*Soad M. Toaima, Aya M. Asaad, Mohamed M. Radwan,
Nadia A. El-Sebakhy
Department of Pharmacognosy, Faculty of Pharmacy, University of Alexandria, P.O. Box 21521, 1st El Khartoum Square, Azarita, Elmesalla Alexandria, Egypt.
INTRODUCTION
Astragalus species represent very old and well known remedy in the traditional medicine of China, Bulgaria and Russia. They are used mainly as superior tonics, for shortness of breath, general weakness, lack of appetite and to invigorate vital energy (Ionkova, 1995). Some Astragalus species are also used as diuretics and for treatment of stomach ulcers, diabetes, nephritis, chronic bronchitis, postpartum urine retention and leprosy (Foster, 1998). In the course of our phytochemical investigation of the secondary metabolites from Astragalus species endemic to Egypt, a number of cycloartane saponins,
oleanane saponins, lavonoids, isolavans and
spinocoumarins were isolated (El-Sebakhy et al., 2000; Gabriboldi et al., 1995; Orsini et al., 1994; Radwan et al., 2007; Verotta et al., 2001).
The present paper deals with the phytochemical investigation and the antimicrobial activity screening of the aerial parts of two Egyptian Astragalus species namely A. annularis Forssk. and A. trimestris L. Thus,
eight compounds were isolated and identiied. From
A. annularis , soyasaponin III (1), isorhamnetin-3-O
-glucoside (2), isorhamnetin-3-O-rutinoside (3) and sorbifolin (4) were isolated. Whereas from A.trimestris, soyasaponin I (5), apigenin-7-O-β-D
-glucopyranose-(1'"-3")β-D-glucopyranoside (6), sorbifolin (4),
8-methoxyvestitol (7) and stigmasterol (8) were isolated. None of the mentioned compounds have been previously isolated from these two species of Astragalus. It is
worth mentioning that this is the irst phytochemical
investigation of A. annularis Forssk.
MATERIAL AND METHODS
Melting points were determined by saturat SMP heating stage microscope. UV spectra were obtained on Perkin-Elmer®, Lambada 3B UV/VIS spectrophotometer.
1D and 2D NMR spectra were measured at 400 MHz and 100 MHz on Varian® and Burker® Spectrometers. The
HR-FAB-MS were recorded on Bruker Biopex instrument. Silica gel (70-230 mesh, Merck®) was used for column
861 Rev. Bras. Farmacogn.
Braz. J. Pharmacogn. 20(6): Dez. 2010
Plant material
The aerial parts of Astragalus annularis Forssk. and A. trimestris L., Fabaceae, were collected from Rosetta East of Alexandria, Egypt, in March 2003. The identity of the plant was kindly identified by Prof. Dr. Rafeek Mohamed (Faculty of Science, Alexandria University). Voucher specimens are deposited in the herbarium of Faculty of Science, University of Alexandria, Egypt.
Antimicrobial testing
One ml of 24 h broth culture of each of the tested organisms was separately inoculated into 100 mL of sterile molten nutrient agar maintained at 45 ºC. Stock solutions of the isolates in DMSO were diluted to give serial dilutions resulting in concentrations ranging from 1000 to 8 µg/mL. After the tested compounds have been diluted, a volume of the standardized inoculum equal to the volume of the diluted tested isolate is added to each dilution vessel. The inoculated, serially diluted isolates were incubated at 37 ºC for 24 h. Ampecillin and clotrimazole were used as positive controls. Minimal inhibitory concentration (MIC) is expressed as the lowest concentration which inhibited growth judged by lack of turbidity in the tube (Jian & Kar, 1971).
Extraction and isolation
The dried aerial parts of A. annularis (5 kg) and A. trimestris (2.5 kg) were separately extracted with 90% EtOH. The alcoholic extracts were concentrated in vacuo and dissolved in H2O and then partitioned with light peteroleum ether, CHCl3, EtOAc and n-BuOH. The different extracts were concentrated and screened using TLC.
The n-butanol soluble extract of A. annularis (16.3 g) was chromatographed on silica gel column using EtOAc and the polarity was increased with MeOH. The fractions eluted with 40% MeOH in EtOAc afforded 40 mg of (1). The ethyl acetate soluble extract (6.5 g) was chromatographed on silica gel column using CHCl3, and the polarity was increased with MeOH. The fractions eluted with 15% MeOH in CHCl3 yielded 25 mg of (2), while those fractions eluted with 22% MeOH in CHCl3 were subjected to pTLC using CHCL3-MeOH (9:1) as a mobile phase, to afford 8 mg of (3). The chloroform soluble extract (8.5 g) was chromatographed on silica gel column using CHCl3, and the polarity was increased with MeOH. The fractions eluted with 5% MeOH in CHCl3 yielded 12 mg of (4).
Soyasaponin III (1): White amorphous powder, [α]D +20○ (MeOH; c 0.42). FAB-MS m/z 819 [M + Na], 797 [M+H],
796 [M], m.p. 216-217 ○C (MeOH). 1H-NMR (CD
3OD)
δ 0.87, 1.04, 1.06 , 1.15, 1.25, 1.28, 1.49 (each 3H, s,
tert-Me x 7), δ 4.88 (1H, d, J=8.0 Hz, glu A H-1), 5.15
(1H, d, J=7.6 Hz, gal H-1) , δ 5.38 (1H, br s, H-12) .The
13C-NMR: Table 1.
Isorhamnetin-3-O-glucoside (2): yellow crystals, m.p.
180-181 ºC. UV λmax nm (abs.) MeOH: 355, 255, MeOH
/NaOMe 413, 273, MeOH/AlCl3 402, 265, MeOH/AlCl3/ HCl 399, 267 , MeOH/NaOAc, 400,274. EI-MS (rel. abund %) 316(100), 315(27), 288(5.5), 287(22), 273(4), 222(20), 153(10). 1H-NMR: Table 2 and 13C- NMR: Table
3.
Isorhamnetin-3-O-rutinoside (3): yellow crystals, m.p.
214-216 ºC. UV λmax nm (abs.) MeOH: 357, 255, MeOH
/NaOMe 416, 272, MeOH/AlCl3 407, 267, MeOH/AlCl3/ HCl 404, 265 , MeOH/NaOAc, 418,275. EI-MS (rel. abund %) 316(100), 315(25), 288(5), 287(22), 273(4), 222(21), 153(12). 1H-NMR: Table 2 and 13C- NMR:
Table 3.
Sorbifolin (4): yellow crystals, m.p. 246-248 ºC. UV
λmax nm (abs.) MeOH: 334, 275, MeOH/NaOMe 370,
276, MeOH/AlCl3 365, 302, MeOH/AlCl3/HCl 354, 301, MeOH/NaOAc, 388, 276. EI-MS (rel. abund %) 301(16), 300(33), 285(18), 257(22), 182(3), 167(5), 118(15). 1
H-NMR: Table 2 and 13C- NMR: Table 3.
The n-butanol soluble extract of A. trimestris (18 g) was chromatographed on silica gel column using EtOAc followed by EtOAc-MeOH mixtures with gradual increase of MeOH contents. The fractions eluted with
15% MeOH in EtOAc were further puriied on silica gel
CC to give 12 mg of (6), while those fractions eluted with 50% MeOH in EtOAc afforded 24 mg of (5). The chloroform soluble extract (7 g) was chromatographed on silica gel column using CHCl3-MeOH mixtures. The fractions eluted with 100% CHCl3 yielded 28 mg of (8)
which was identiied as stigmasterol by direct comparison with authentic sample [m.p., m.m.p. and TLC]. Whereas
the fractions eluted with 2% and 5% MeOH in CHCl3 yielded 8 mg and 40 mg of (4) and (7), respectively.
Soyasaponin I (5): White amorphous powder, [α]D
-5.9○ (MeOH; c 0.51). FAB-MS m/z: 965 [M + Na], 943
[M +H], 942 [M], m.p. 255-257 ○C (MeOH). 1H-NMR
(CD3OD) δ 0.78, 0.82, 0.91, 0.99, 1.08, 1.16 (each 3H,
s, tert-Me x 7), 1.76 (3H, d , J=5.9 Hz, Rha H-6), δ 4.78 (1H, d, J=8.0 Hz, glu A H-1), 5.15 (1H, d, J=7.6 Hz, gal
H-1), δ 5.22 (1H, br s, H-12) and 5.76 (1H, b s, Rha H-1).
13C-NMR: Table 1.
Apigenin-7-O-β-D -glucopyranose-(1'"-3")β-D-glucopyranoside (6): yellow crystals, m.p. 214-216 ºC.
UV λmax nm (abs.) MeOH: 348, 267, MeOH/NaOMe 400,
, MeOH/NaOAc, 400, 270. 1H-NMR: Table 2 and 13C-
NMR: Table 3.
8-Methoxyvestitol (7): yellow lakes, m.p. 135-136 ºC.
UV λmax nm (abs.) MeOH 212, 279, NaOH 214, 290,
AlCl3 214, 279. 1H-NMR 3.84 (1H, s, H-2eq ), 4.25 (1H, d, J=10.3 Hz, H-2ax), 3.44 (1H, m, H-3ax), 2.76 (1H, dd, J=5.4, 15.1 Hz, H-4eq), 2.90 (1H, dd, J=10.2,
15.1 Hz, H-4ax), 6.82 (1H, d, J=8.2 Hz, H-5), 6.66 (1H, d, J=8.2 Hz, H-6), 6.24 (1H, d, J=1.9 Hz, H-3'), 6.30 (1H, d, J=1.9, 7.9 Hz, H-5'), 6.34 (1H, d, J=7.9 Hz, H-6'), 3.75 (3H, s, 8- OCH3), 3.84 (3H, s, 4'- OCH3).
RESULTS AND DISCUSSION
Compound 1 showed a characteristic molecular ion peak at m/z 819.4387 [M + Na]+ in the positive FAB
mass spectrum, corresponding to the molecular formula C42H68O14. The occurence of seven tertiary methyl signals
and an oleinic proton signal in the 1H-NMR spectrum
suggested 1 to be an oleanane derivative. The sapogenol obtained by acid hydrolysis of 1 was identiied as
soyasapogenol B by TLC comparison with a reference sample. The 13C-NMR spectrum (Table 1) showed the
presence of two sugar moieties, and also showed the
presence of a hydroxymethyl group at C-24 and a hydroxyl group at C-22. The 13C-NMR signals of the sugar part of 1
were identical to those reported for β-D-galactopyranosyl-(1''-2')-β-glucuronopyranosyl (Agrawal, 1992; Shujiro
et al., 1978), while the signals due to the aglycone part (Table 1) were in a good agreement with those reported for soyasapogenol B except for C-3, which was shifted
downield indicating glycosylation (Fukunaga et al.,
1987). Therefore, the structure of compound 1 was elucidated to be 3-O-[β-D-galactopyranosyl-(1''-2')-β-D
-glucuronopyranosyl]-soyasapogenol B, which is known
as soyasaponin III (Kitagawa et al., 1985; Kitagawa et al., 1988).
Compound 5 gave a molecular ion peak at m/z
965.5167 [M + Na]+ on positive FAB mass spectral
analysis. Thus the molecular formula of 5 was suggested to be C48H78O18. The 1H-NMR and 13C-NMR spectra of
5 (Table 1), after acid hydrolysis pointed to the same aglycone, soyasapogenol B, as in 1, and established the presence of three sugars. The FAB mass spectrum, 1
H-NMR and 13C-NMR spectral data of 5 were in a good
agreement to those reported for soyasaponin I (Kitagawa et al., 1983; Wang et al., 1990), so the structure of 5
was suggested to be soyasaponin I which is 3-O-[α-L
-rhamnopyranosyl-(1'''-2'')-β-D
-galactopyranosyl-(1''-2')-glucuronopyranosyl] soyasapogenol B.
CH2OH
OH
O HO2C
HO HO
O O HOH2C
HO HO OR 3 23 24 10 25 11 12 26 27 13 18 20 30 29 22 26 16 1' 6' 6" 1" 21
1 R=H
5 R= Rhamnose
O OH O OH HO 2 2' 3' 4' 5' 6' 3 4 1 5 6 7 8 1' OCH3
OHO O OH
OH CH2OR
H 1' 2' 3' 4' 5' 6' 2 R=H
3 R= Rhamnose
O OH O OH O O HO H O HO O OH OH HO HO H 2 2' 3' 4' 5' 6' 3 4 1 5 6 7 8 1" 5" 6" 4" 3" 2" 1'" 5'" 6'" 4'" 3'" 2'" 1' OH O OH O OH 2 2' 3' 4' 5' 6' 3 4 1 5 6 7 8 1' H3CO
863 Rev. Bras. Farmacogn.
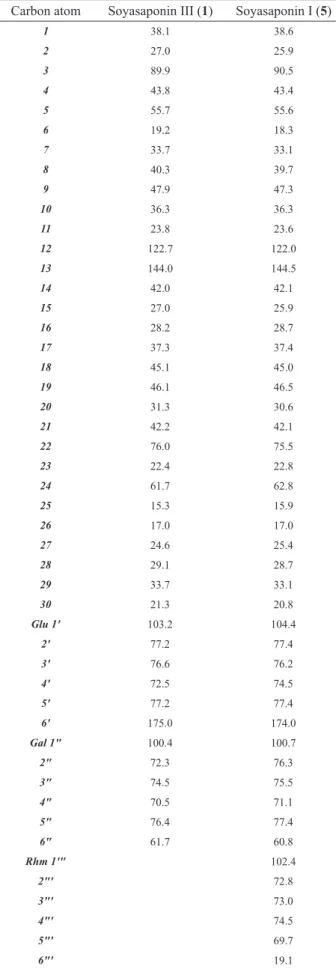
Braz. J. Pharmacogn. 20(6): Dez. 2010 Table 1.13C-NMR spectral data of (1), (5) at 100 MHz in
CD3OD.
Carbon atom Soyasaponin III (1) Soyasaponin I (5)
1 38.1 38.6
2 27.0 25.9
3 89.9 90.5
4 43.8 43.4
5 55.7 55.6
6 19.2 18.3
7 33.7 33.1
8 40.3 39.7
9 47.9 47.3
10 36.3 36.3
11 23.8 23.6
12 122.7 122.0
13 144.0 144.5
14 42.0 42.1
15 27.0 25.9
16 28.2 28.7
17 37.3 37.4
18 45.1 45.0
19 46.1 46.5
20 31.3 30.6
21 42.2 42.1
22 76.0 75.5
23 22.4 22.8
24 61.7 62.8
25 15.3 15.9
26 17.0 17.0
27 24.6 25.4
28 29.1 28.7
29 33.7 33.1
30 21.3 20.8
Glu 1' 103.2 104.4
2' 77.2 77.4
3' 76.6 76.2
4' 72.5 74.5
5' 77.2 77.4
6' 175.0 174.0
Gal 1" 100.4 100.7
2" 72.3 76.3
3" 74.5 75.5
4" 70.5 71.1
5" 76.4 77.4
6" 61.7 60.8
Rhm 1'" 102.4
2"' 72.8
3"' 73.0
4"' 74.5
5"' 69.7
6"' 19.1
Different qualitative chemical tests and spectral analyses indicated that compounds (2), (3) and (6) were
lavonoidal glycosides (Mabry et al., 1970). UV spectrum
of 2 in MeOH and different shift reagents revealed the presence of free OH at positions 5, 7 and 4' (Mabry et al., 1970), while UV spectrum in methanol, after acid hydrolysis, suggested 3-O-glycosylation. 1H-NMR data of
2 (Table 2) showed two meta coupled aromatic protons at
δH 5.58 and δH 5.73 (1H, d, J=2.0 Hz, 1H each) assigned for
H-6 and H-8, respectively, conirming a 5,7-disubstituted ring A. An ABX system was observed at δH 6.43 (1H, d,
J=8.8 Hz), δH 7.40 (1H, dd, J=8.8, 2.0 Hz) and δH 7.74(1 H,
d, J=2.0 Hz) in accordance to 3',4' disubstituted ring B. The
site of glycosylation was further conirmed by 13C-NMR
spectrum of 2 (Table 3), which showed upield shift of C-3 (δ 135.1) and downield shift of C-2 (δ 157.9), compared
with the aglycone (Shujiro et al., 1978). Moreover, NMR spectra indicated the presence of one methoxyl group as
concluded from the signals observed at δH 3.70 (3 H, s) and
δc 55.3 ppm. The UV spectra of 2 in AlCl3 and AlCl3/HCl
shift reagents suggested the location of the methoxyl group to be at C-3' (Mabry et al., 1970). Furthermore the sugar
moiety was conirmed to be glucose by co-chromatography,
after acid hydrolysis, with reference sample. The EI-MS showed a diagnostic ion peak at m/z 316 characteristics to the aglycone isorhamnetin. Therefore, the structure of compound 2 was concluded to be isorhamnetin-3-O-β-D -glucopyranoside (Ceska & Derek, 1984).
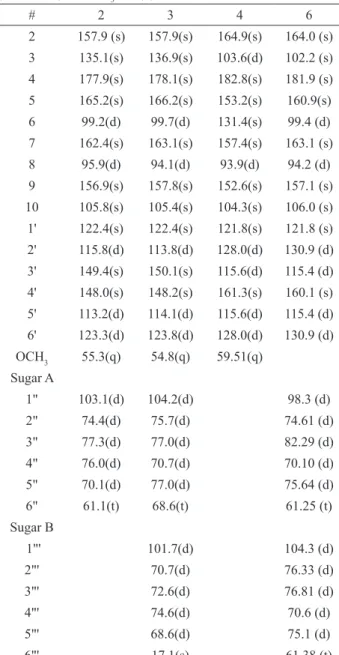
Table 2.1H-NMR spectral data of 2, 3, 4 and 6 at 400 MHz in
DMSO (2, 3 and 4) and CD3OD (6).
# 6 4 3 2
3 6.53 (1H, s) 6.15 (1H, S)
6 5.58(1H, d, J
=2.0 Hz)
5.91 (1H, d,
J =2.0 Hz)
6.86 (1H, d, J
=2.0 Hz)
8 5.73 (1H, d, J
=2.0 Hz)
6.06 (1H, d,
J =2.0 Hz)
6.58 (1H, s) 7.51 (1H, d, J
=2.0 Hz)
2' 7.74(1 H, d, J
=2.0 Hz)
7.92 (1 H, d, J =2.0
Hz)
7.85 (1 H, d, J =7.2
Hz)
8.02 (1 H, d, J
=8.5 Hz)
3' 6.92 (1 H,
d, J =7.2 Hz)
6.86 (1H, d, J
= 9 Hz)
5' 6.43(1H, d, J
= 8.8 Hz)
6.62 (1H, d,
J = 8.4 Hz)
6.92 (1 H, d, J =7.2
Hz)
6.86 (1H, d, J
= 9 Hz)
6' 7.40(1H, dd,
J=8.8,2.0 Hz)
7.63 (1H, dd, J=8.4, 2.0 Hz)
7.85 (1 H, d, J =7.2
Hz)
8.02 (1 H, d, J
=8.5 Hz)
1'' 5.25(1H, d, J
= 6.5 Hz)
4.98 (1H, d,
J = 7.2 Hz)
5.51 (1H, d, J
= 8 Hz)
1'" 4.65 (1H, d,
J = 1.6 Hz)
4.92 (1H, d, J
= 8 Hz)
6"' 1.21 (3H, d,
J = 5.6 Hz)
Table 3:13C-NMR spectral data of 2, 3, 4 and 6 in DMSO
(2, 3 and 4) and CD3OD (6).
# 2 3 4 6
2 157.9 (s) 157.9(s) 164.9(s) 164.0 (s) 3 135.1(s) 136.9(s) 103.6(d) 102.2 (s) 4 177.9(s) 178.1(s) 182.8(s) 181.9 (s) 5 165.2(s) 166.2(s) 153.2(s) 160.9(s) 6 99.2(d) 99.7(d) 131.4(s) 99.4 (d) 7 162.4(s) 163.1(s) 157.4(s) 163.1 (s) 8 95.9(d) 94.1(d) 93.9(d) 94.2 (d) 9 156.9(s) 157.8(s) 152.6(s) 157.1 (s) 10 105.8(s) 105.4(s) 104.3(s) 106.0 (s) 1' 122.4(s) 122.4(s) 121.8(s) 121.8 (s) 2' 115.8(d) 113.8(d) 128.0(d) 130.9 (d) 3' 149.4(s) 150.1(s) 115.6(d) 115.4 (d) 4' 148.0(s) 148.2(s) 161.3(s) 160.1 (s) 5' 113.2(d) 114.1(d) 115.6(d) 115.4 (d) 6' 123.3(d) 123.8(d) 128.0(d) 130.9 (d) OCH3 55.3(q) 54.8(q) 59.51(q)
Sugar A
1" 103.1(d) 104.2(d) 98.3 (d)
2" 74.4(d) 75.7(d) 74.61 (d)
3" 77.3(d) 77.0(d) 82.29 (d)
4" 76.0(d) 70.7(d) 70.10 (d)
5" 70.1(d) 77.0(d) 75.64 (d)
6" 61.1(t) 68.6(t) 61.25 (t)
Sugar B
1"' 101.7(d) 104.3 (d)
2"' 70.7(d) 76.33 (d)
3"' 72.6(d) 76.81 (d)
4"' 74.6(d) 70.6 (d)
5"' 68.6(d) 75.1 (d)
6"' 17.1(s) 61.38 (t)
Compound 3 showed spectroscopic data similar to those of compound 2 except in the presence of an additional sugar moiety. The presence of two sugar units was further supported by the appearance of two anomeric protons in 1H-NMR (Table 2) at δ
H 4.98 (
1H, d, J=7.2
Hz) and 4.65 (1H, d, J=1.6 Hz) with their corresponding
carbon signals at δC 104.2, and δC 101.7, respectively in
the HMQC spectrum, assignable for H-1'' and H-1"' of
glucose and rhamnose. The presence of a doublet at δ 1.21
integrated for three protons in 1H-NMR and a quartet at 17.1 in 13C-NMR were typical for the rhamnose methyl
group. The interglycosidic linkage was conirmed as
glucose (6''-1"') rhamnose by the HMBC spectrum and the
downield shift of C-6" of glucose (δ 66.8) characterisrtic
for rutinoside (Markham et al.,1978; Markham & Terani,
1976). The identity of the sugars were further conirmed
by acid hydrolysis and co-chromatography with authentic
samples. Accordingly, compound 3 was proved to be isorhamnetin-3-O-rutinoside (Sen et al., 1992).
The UV spectra of compound 6 in different shift reagents indicated the presence of free 5 and 4' dihydroxyl groups. On the other hand, the UV spectra of its aglycone
indicated that it is 5,7 and 4' trihydroxy lavones (Mabry
et al., 1970) suggesting 7-O-glycosylation. The 1H-NMR
(Table 2) and 13C- NMR data of compound 6 (Table 3)
were in complete agreement with this suggestion as they showed the characteristic pattern of 5,7-disubstituted ring A and 4'-monosubstituted ring B. The diglucosidic nature of compound 6 was revealed by the appearance of two
anomeric protons at δH 5.51 (1H, d, J=8 Hz) and δH 4.92
(1H, d, J=8 Hz) in 1H-NMR, with their corresponding
carbon signals at δ 98.3, 104.3, respectively. The 7-O
-glycosylation of compound 6 was conirmed by the long range correlation between the carbon at δ 163.1 (C-7) and the proton at δ 5.51 (H-1'') in the HMBC spectrum (Figure 1). In addition, the correlation between the carbon at δ 82.29 (C-3'') and the proton at δ 4.92 (H-1''') veriied the interglycosidic linkage to be (1'''→3'') thus the structure
of compound 6 was suggested to be apigenin-7-O-β-D
-glucopyranose-(1'"-3") β-D-glucopyranoside (Veitch et
al., 1998) which is the irst report for its isolation from
genus Astragalus.
O
OH
O OH O O HO
H O
HO O OH
OH
HO HO
H
2 2'
3' 4'
5'
6'
3 4 1 5 6
7 8 1" 5" 6" 4"
3" 2"
1'" 5'" 6'" 4'"
3'" 2'"
1'
OH
Figure 1. Key HMBC correlations of apigenin-7-O-β-D -glucopyranose-(1'"-3")β-D-glucopyranoside (6).
Different colour reactions indicated the
lavonoidal nature of compound 4 (Mabry et al., 1970).
Both EI-MS and 13C-NMR (Table 3) suggested the
molecular formula C16H12O6 indicating a lavone with one methoxyl and three hydroxyl groups. The two 1
H-NMR singlets (Table 2) at δ 6.53, 6.58 assigned for
H-3 and H-8 (Feranandez et al., 1989; Gonzalez et al., 1985), respectively, the UV spectra of 4 with different shift reagents (Mears & Mabry, 1972), as well as the MS fragment at m\z 182 indicated free hydroxyl groups at C-5 and C-6 and a methoxyl group at C-7. The UV spectra indicated a free hydroxyl group at C-4' (Mabry et al., 1970; Asaad, 2002) which was further supported
by the presence of two doublets at δH 6.92 and δH 7.85
(J=7.2 Hz, 2H each). The 13C-NMR data supported the
above substitution patterns (Agrawal, 1989). The data of compound 4 were in a good agreement with those reported for sorbifolin (Amer et al., 2001). It is worth
mentioning that this is the irst report for its isolation
865
The 1H-NMR, UV spectral data as well as m.p.
of compound 7 were in full agreement with those reported for 8-methoxyvestitol (Assad, 2002).
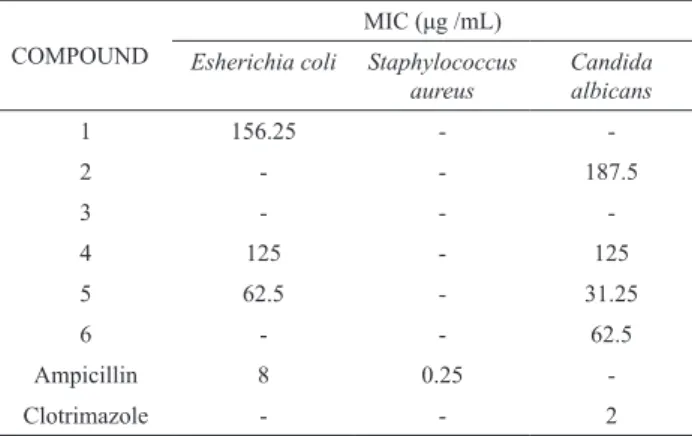
Antibacterial and antifungal assays for some of the isolated compounds were carried out against a Gram-positive bacterium, Staphylococcus aureus, Gram-negative bacteria, Esherichia coli and the fungus Candida albicans. The results were shown in Table 4, where compound 5 showed a moderate activity against E. coli and compounds 5 & 6 showed a moderate activity against C. albicans, and none of the tested compounds showed any activity against the S .aureus.
Table 4. Minimum inhibitory concentration (MIC) of some isolated compounds from Astragalus species.
COMPOUND
MIC (μg /mL) Esherichia coli Staphylococcus
aureus
Candida albicans
1 156.25 -
-2 - - 187.5
3 - -
-4 125 - 125
5 62.5 - 31.25
6 - - 62.5
Ampicillin 8 0.25
-Clotrimazole - - 2
REFERENCES
Agrawal P, Bansal M 1989. Carbon 13 NMR of Flavonoid Glycosides, Elsevier, Amsterdam, Oxford, New York, Tokyo.
Agrawal P 1992. NMR spectroscopy in the structural elucidation of the oligosaccharides and glycosides. Phytochemistry 31: 3307-3330.
Amer M, Kassem F, Abdel-Kader M 2001. Flavonoids from
Ononis serrata growing in Egypt. Alex J Pharm Sci 15: 99-102.
Asaad A 2002. Astragalus tomentosus Lam.: Macro- and micro-morphology of the lower and Phytochemical study of the Roots. Alex J Pharm Sci 16: 6-9.
Ceska O, Derek Styles E 1984. Flavonoids from Zea mays pollen. Phytochemistry 23: 1822-1825
Gabriboldi P, Pelizzoni F, Tato M, Verotta L, El-Sebakhy N, Assad A, Abdallah R, Toaima S 1995. Cycloartane triterpene glycosides from Astragalus trigonus. Phytochemistry 40: 1755-1758.
Gonzalez C, Macias F, Massanet G, Rodriguez L 1985. Structure and chemistry of secondary metabolites from Compositae. Part 5. Flavonoids from Centaurea clementei. J Nat Prod 48: 819-22.
El-Sebakhy N, Asaad A, Abdallah R, Toaima S, Verotta L, Orsini, F 2000. Constituents of Egyptian Astragalus tribuloides Del. Nat Prod Sci 6: 11-15.
Feranandez I, Garcia B, Grancha F, Pedro J 1989. Sesquiterpene lactones, lavonoids and coumarins from Centaurea collina. Phytochemistry 28: 2405-2408.
Foster S 1998. 101 medicinal herbs 1st. ed., Loveland, USA:
Interweave press p.135-138.
Fukunaga T, Nishiya K, Takeya K, Itokawa H 1987. Studies on the constituents of Goat`s rue (Galega oficinalis).
Chem Pharm Bull 35: 1610-1614.
Ionkova I 1995. In Biotechnology in Agriculture and Forestry Bajaj Y.P.S., Berlin Ed. Springer -Verlag p.97-138. Jian S, Kar A 1971. The antibacterial activity of some essential
oils and their combination. Planta Med 20: 118-122. Kitagawa I, Wang K, Saito M, Yoshikawa M 1983. Chemical
constituents of Astragalus membranaceus Bunge. (3) Astragalosides III ,V and VI . Chem Pharm Bull 31: 709-715.
Kitagawa I, Masayuki S, Tanyiyama T, Yoshikawa M 1985. Saponin and sapogenol. XXXVIII. Structure of soyasapogenol A2, a bisdesmoside of soyasapogenol A, from soybean, the seeds of Glycine max Merrill. Chem Pharm Bull 33: 598-608.
Kitagawa I, Tanyiyama T, Nagahama Y, Okubo K, Yamauchi F, Yoshikawa M 1988. Saponin and sapogenol. XLIL. Structures of soyasapogenol A1, A2, and A3, sstringent partially acetylated bisdesmoside of soyasapogenol A, from american soybean, the seeds of Glycine max
Merrill. Chem Pharm Bull 36: 2819-28.
Mabry T, Markham K, Thomas M 1970. The systematic identiication of lavonoids, Berlin, Heidelberg, New York: Springer-Velag p. 230-270.
Markham K, Terani B 1976. Carbon-13 NMR of lavonoids. II. Flavonoids other than lavone and lavonol aglycons. Tetrahedron 32: 2607-12.
Markham K, Terani B, Stanley R, Geiger H, Mabry TJ 1978. Carbon-13 NMR studies of lavonoids. III. Naturally occurring lavonoid glycosides and their acylated derivatives. Tetrahedron 34: 1389-1394.
Mears J, Mabry T 1972. Procedure for the uv detection of hydroxyl and methoxyl groups at C-6 in lavones and 3-O-substituted lavonols. Phytochemistry 11: 411-435. Orsini F, Verotta L, Barboni L, El-Sebakhy N, Asaad A, Abdallah
R, Toaima S 1994. Cycloartane triterpene glycoside from Astragalus alexandrinus. Phytochemistry 35: 745-749.
Radwan M, El-Sebakhy N, Asaad A, Toaima S, Kingston G 2007. Spinocoumarin I, a new coumarin Derivative from Astragalus spinosus Forssk. Natural product communications 9: 919-922.
Sen S, Sahu N, Mahato S 1992. Flavonol glycosides from
Calotropis gigantea. Phytochemistry 31: 2919-2921. Shujiro S, yutaka T, Kazuo T, Yohko Y 1978. Determination
of the absolute coniguration of a secondary hydroxyl group in a chiral secondary alcohol using glycosylation shifts in Carbon-13 Nuclear Magnetic Resonance Spectroscopy. J Am Chem Soc 100: 3331-3339. Veitch N, Grayer R, Lnwin J 1998. Flavonoid cellobiosides
from Salvia uliginosa. Phytochemistry 48: 389-393. Verotta L, Guerrini M, El-Sebakhy N, Asaad A, Toaima S,
Abou-shoer M, Luo Y, Pezzuto J 2001. Cycloartane saponins from Astragalus peregrinus as modulators of lymphocyte proliferation. Fitoterapia 72: 894-905. Wang H, He K, Xu H, Zhang Z, Wang Y, Kikuchi T, Tezuka Y
1990. The structure of astrachrysosid A and the study of 2D-NMR on astrasieversianin XV and 7,2'-dihydroxy-3',4'-dimethoxy-isolavane-7-O-β-D-glycoside. Yaoxue Xuebao 25: 445-450.