Article
0103 - 5053 $6.00+0.00*e-mail: [email protected]
Other Chemical Constituents Isolated from
Solanum crinitum
Lam. (Solanaceae)
Marli T. F. Cornelius,a Mário G. de Carvalho,*,a Tania M. S. da Silva,a
Cassia C. F. Alves,a Ana P. N. Siston,a Kelly Z. Alves,a Carlos M. R. Sant’Anna,a
Mario B. Neto,b Marcos N. Eberlinb andRaimundo Braz-Filhoc
aDepartamento de Química, ICE, Universidade Federal Rural do Janeiro, BR 465 km 07,
23890-000 Seropédica-RJ, Brazil
bInstituto de Química, Universidade Estadual de Campinas, 13084-862 Campinas-SP, Brazil
cSetor de Química de Produtos Naturais, LCQUI, CCT, Universidade Estadual do Norte Fluminense
Darcy Ribeiro, 28013-602 Campos dos Goytacazes-RJ, Brazil
O estudo itoquímico de Solanum crinitum Lam forneceu quatro lavonóides: tilirosídeo (1), astragalina (2), kaempferol (3) e biochanina A-7-O-β-D-apiofuranosil-(1→5)-β -D-apiofuranosil-(1→6)-β-D-glucopiranosideo (7), ácido 4-hidroxibenzoico (12), e quatro derivados do ácido cinâmico: cis- e trans- cumárico (10 e 11), cis- e trans-cumarato de etila (8 e 9), isolados de tricomas do fruto. Do extrato metanólico de frutos verdes foram isolados três alcalóides esteroidais glicosilados: solamargina (13), 20-epi-solamargina (14) e solasonina (16). Os derivados 3,5,7,4’-tetra-O-metil-kaempferol (4), 3,7,4’-tri-O-metil-kaempferol (5), 3,7,4’-tri-O-metil-5-O -acetil-kaempferol (6), peracetil-epi-solamargina (15) e peracetil-solasonina (17) foram sintetizados e estão sendo registrados pela primeira vez na literatura. As estruturas foram deinidas através de análise de dados espectrométricos.
The phytochemical investigation of Solanum crinitum Lam led to the isolation from the fruit trichomes of four lavonoids, tiliroside (1), astragalin (2), kaempferol (3), biochanin
A-7-O-β-D-apiofuranosyl-(1→5)-β-D-apiofuranosyl-(1→6)-β-D-glucopyranoside (7), along with 4-hydroxybenzoic acid (12), and four cinnamic acid derivatives, cis- and trans-coumaric acids (10 and 11) and cis- and trans- ethyl coumarate (8 and 9). Three tri-glycosyl-steroidal alkaloids, solamargine (13), 20-epi-solamargine (14) and solasonine (16) were isolated from the methanolic extract of the green fruits. The derivatives 3,5,7,4’-tretra-O-methyl-kaempferol (4),
3,7,4’-tri-O-methyl-kaempferol (5), 3,7,4’-tri-O-methyl-5-O-acetyl-kaempferol (6), the peracetyl-epi -solamargine (15) and peracetyl-solasonine (17) were prepared. The structures were established through the analysis of their spectral data. The complete 1H and 13C NMR data assignments of the
new peracetyl derivatives of the alkaloids were made.
Keywords:Solanum crinitum, Solanaceae, steroidal glycoalkaloids, lavonoids, cinnamic acids
Introduction
Solanum (L) is the most representative genus of Solanaceae, containing about 1,500 species, and 5,000 epithets. It is widespread in tropical and subtropical regions of all the world, but its highest diversity occurs in South America.1 Solanum species are a rich source of steroidal alkaloids, lavonoids and their glycosides which are known to possess a variety of biological activities. The glycoalkaloids are natural toxins with ecological and human health importance, such as the allelopathic effect
against herbivores, against pathogenic microorganism2,3 and molluscicidal activity,4 and are also of interest as starting material for anabolic, anti-fertility, anti-inlammatory, anti-allergic drugs.5 As the alkaloids, the lavonoids are a frequent group of compounds in Solanum species, and can be used as systematic markers for the family taxons.6-8
and also of a rich glycoalkaloids total fraction from the green fruits of Solanum crinitum Lam14 along with its allelopathic activity.3
This work describes the isolation and structural characterization of the flavonoids tiliroside (1), astragalin (2), kaempferol (3) and biochanin A-7-O-β -D-apiofuranosyl-(1→5)-β-D-apiofuranosyl-(1→6)-β-D -glucopyranoside (7), cis- (10) and trans- (11) cumaric acids and ethyl cis- (8) and trans- (9) cumarate and 4-hydroxybenzoic acid (12), which were isolated from the trichomes, and the glycoalkaloids solamargine (13),
Results and Discussion
From the trichomes isolated from green fruits of Solanum crinitum Lam were isolated the lavonoids: tiliroside (1), astragalin (2), kaempferol (3), and biochanin A-7-O-β -D-apiofuranosyl-(1→5)-β-D-apiofuranosyl-(1→6)-β-D -glucopyranoside (7), cis- (10) and trans- (11) cumaric acids and ethyl cis- (8) and trans- (9) cumarate esters and 4-hydroxybenzoic acid (12); from green fruits methanolic extracts were isolated three tri-glycosyl-steroidal alkaloids, solamargine (13), 20-epi-solamargine (14) and solasonine (16). The derivatives 3,5,7,4’-tetramethylkaempferol (4), 3,7,4’-trimethylkaempferol (5), 3,7,4’-trimethyl-5-acetylkaempferol (6), the peracetyl-20-epi-solamargine (15) and peracetyl-solasonine (17) were prepared. The structures were established on the basis of IR, NMR and MS data analysis of the natural compounds and of the derivatives 4-6, 15 and 17.
Compounds 1-3 were identiied by the analysis of 1H and 13C NMR spectra, including HMQC and HMBC
experiments, and comparison with literature data for tiliroside, kaempferol and astragalin.15-18 The irst report of 1 in Solanum species was made by Souza et al.14 Kaempferol and astragalin have been isolated from some Solanum species.8 The treatment of 3 with diazomethane yielded the methyl derivatives 4 and 5, described in the literature,19 and the derivative 6 was obtained by treating 5 with Ac2O/Pyridine. The 2D NMR spectra, including NOESY experiments, of these derivatives were used to conirm the proposed structure of 3 and to carry out the complete assignment of the 1H and 13C chemical shifts of 6 (see Experimental).
The 1H and 13C NMR spectra of compound 7 revealed characteristic resonances of the isolavonoid biochanin A besides additional signals for three sugars unities, one glucopyranoside and two apiofuranosides. Comparison of these data with those of glycosides isolated from Dalbergia nigra20 and Andira anthelmia,21 besides the analysis of mass spectrum obtained by FAB-MS in positive mode {m/z 733.20820 ([M+Na]+, C
32H38O18+Na +,
calc.: m/z 733.19558), m/z 601.12300 [M+Na-132]+, m/z 451.0600 (M+Na-282)+, m/z 449.27710 [M+Na-284]+, m/z 431.16210 [M+Na-302]+, m/z 317.1338 [M+Na-416]+, m/z 287.0865 [M+Na-446]+}, led us to identify the compound as biochanin A, 7-O-β-D-apiofuranosyl-(1→5)-β-D -apiofuranosyl-(1→6)-β-D-glucopyranoside (7). This is the irst report of this apiofuranosyl derivative in Solanum species.
Compounds 8-12 were identified by the 1H and 13C NMR spectral data analysis of the mixtures of 8+9,
10+11 and of 12 along with comparison with literature
data.21-25 The integration of the 1H NMR signals allowed us to calculate the approximate relative percentage of both compounds: 36.16% of 8 and 63.84% of 9.
The fractions containing compounds 13, 14 and 16
showed a positive test for alkaloids. The detailed analysis of the 1H and 13C NMR spectra of the isolated compounds allowed to identify characteristic signals corresponding to the same aglycone as that of the steroidal spirazolane-type alkaloid in the three glycoalkaloids: four quaternary carbon atoms, including one linked to oxygen and nitrogen atoms: (dC 98.7 to 98.5 and one sp
2 at d
C 141.2 to 140.4), nine methine groups (including two oxygenated at dC 78.5 to 78.0 and 81.1 to 78.6), ten methylene groups and four methyl groups = (C)3(O-C-NH)(CH)7 (HC-O)2(CH2)10(CH3)4 = C27H42NO3 = C27H42NO2 considering the presence of an ether function (Table 1) having a trisaccharide moiety (three anomeric carbon atoms: dC 100.6 to 100.3) attached to the oxygen atom of carbon CH-3, with dC 78.5 to 78.0 (Table 1 and 2), which is significantly higher when compared with the 13C chemical shift of the methyl carbon CH-3 sustaining free hydroxyl group (about dC 71). The 1H and 13C chemical shifts of the trisaccharide moieties of 13 and 14, had practically the same values (Table 2), indicating identical the partial structure O-[α -L-rhamnopyranosyl-(1→2)-O-[α-L -rhamnopyranosyl-(1→4)]-β-D-glucopyranoside = C18H32O13 (three degrees of unsaturation, C18H38O13 – C18H32O13 = H6). On the other hand, the 1H and 13C signals observed in NMR spectra of 16 allowed to characterize the trisaccharide as O-[α-L -rhamnopyranosyl-(1→2)-O-[β-glucopyranosyl-(1→ 3)]-β-D-galactopyranoside = C18H32O14 (three degrees of unsaturation, C18H38O14 – C18H32O14 = H6). All these NMR spectral data allowed to deduce the same molecular formulas C45H73NO15 to 13 and 14 and C45H73NO16 to 16, all with ten degrees of unsaturation corresponding to one double bond and six rings). In fact, the values of pseudomolecular peaks in the positive HRMS spectra at m/z 868.5239 (M + H•+, 100%) of 13 (C
45H74NO15 = m/z 868.5058) and at m/z 868.5305 (M + H•+, 100%) of 14 (C
45H74NO15 = m/z 868.5058), besides additional peaks compatible with loss of sugar moieties, were used to conirm the molecular formula of these isomeric compounds (13 and 14). The hydrogen and carbon atoms signals observed in the 1H and 13C NMR spectra of 13-17 (Tables 1 and 3) were also assigned with aid of the homonuclear 2D 1H-1H-COSY and heteronuclear 2D HMQC (1H-13C-COSY-1J
CH) and HMBC (1H-13C-COSY-nJ
CH, n = 2 and 3), allowing to identify the 1H
3H-19) and 1.28 (d, 3H-21) of 14, and 0.76 (d, 3H-27), 0.82 (s, 3H-18), 1.03 (s, 3H-19) and 1.17 (d, 3H-21) of 16; signals of the hydrogen H-6 linked to sp2 carbons of double bounds at dH: 5.32 (13), 5.33 (14), 5.30 (16), besides the signals of H-16 located in the spyrazolane ring (d, J 6 Hz) at dH 4.42 (13); 4.82 (14) and 4.21 (16). The additional doublets (J 6 Hz) corresponding to methyl groups were revealed at
d3H 1.64 and d3H 1.78 in the spectra of 13 and 14 suggested the presence of two rhamnose moieties in both compounds and only one rhamnose for 16 asindicated by signal at
dH 1.78. The differences observed in the
1H NMR spectra
of 13 and 14, recorded in same apparatus (1H: 500 MHz; 13C: 125 MHz) and solvent pyridine-d
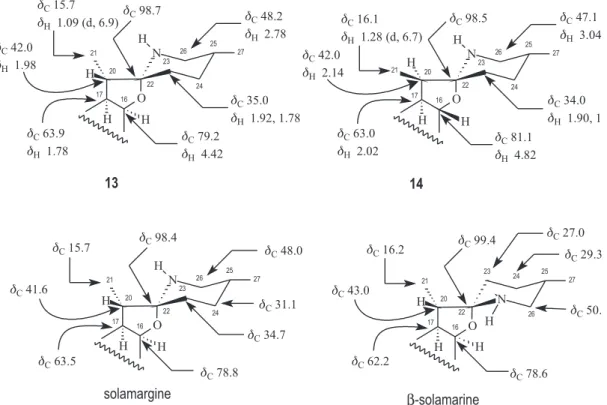
5, involving mainly the chemical shifts of the hydrogen atoms H-16 (dH 4.42 and 4.82), H-17 (dH 1.78 and 2.02), H-20 (dH 1.98 and 2.14), 2H-26 (dH 2.78 and 3.04/2.89) and 3H-21 (dH 1.09 and 1.28), which revealed correlation in the HMQC with the 13C signals of the corresponding carbon atoms: CH-16 (dC 79.2 and 81.1), CH-17 (dC 63.9 and 63.0), CH-20 (dC 42.0 and 42.0), CH2-26 (dC 48.2 and 47.1) and 3H-21 (dC 16.1 and 15.7), as summarized in Figure 1. Comparative analysis of these data was used to suggest the two stereoisomers H-20β (13) and H-20α (14), since the 22αN and 22βN possibilities were eliminated considering the absence of 13C signal corresponding to a methylene carbon CH
2-23 at about dC 27 which is consistent with the
13C NMR chemical
shift of the 22βN stereoisomer (Figure 1). The β-position of the methyl Me-21 located at carbon atom 20 of 14 may be used to justify the 13C chemical shifts of the CH-16 (dC 81.1, absence of the γ-effect from Me-21) and CH2-23 (dC 34.0, presence of the γ-effect from Me-21).
26-30 In order
to compare the relative stabilities of the epimeric structures
13/14, a molecular modeling study was implemented using the Spartan 06 for Linux program (Wavefunction, Inc.), see Supplementary Information.31
The complete 1H and 13C chemical shift assignments of the signals of CH3, CH2, CH and C observed in the 1H (including 1H-1H-COSY) and 13C ({1H} and DEPT) NMR spectra (including 2D experiments HMQC and HMBC) (Tables 1, 2, 3 and 4) and comparison with values described in the literature for solamargine (13)26-29 and solasonine (16)28,31 led to the proposition of the structures (25R) (20S)(16S)-3β-{O-α-L-rhamnopyranosyl-(1→2)-O-[α-L -rhamnopyranosyl-(1→4)]-β-D-glucopyranosyl}-22α N-spirosol-5-en (solamargine, 13), the new glycoalkaloid (25R)(20R)(16S)-3β-{O-α-L-rhamnopyranosyl-(1→ 2)-O-[α-L-rhamnopyranosyl-(1→4)]-β-D -glucopyranosyl}-22αN-spirosol-5-en (16-epi-solamargine, 14), and (25R) (20S)(16S)-3β-{O-α-L-rhamnopyranosyl-(1→2)-O-[β -glucopyranosyl-(1→3)]-β-D-galactopyranosyl} -22α N-spirosol-5-en (solasonine, 16) for the three steroidal glycoalkaloids isolated from this plant (Figure 1).
Figure 1. Comparative analysis of the chemical shifts corresponding to the hydrogen (dH) and carbon (dC) atoms CH-16, CH-17, CH-20, CH3-21, C-22,
CH2-23 and CH2-26 of 13 and 14, including comparison of the dCthese carbon atoms and of the CH2-24 to reveal the structural distinction between
The natural alkaloids 14 and 16 were treated with Ac2O/pyridine to yield the peracetyl derivatives 15 and
17. The 1H and 13C NMR spectral data of these peracetyl derivatives (15 and 17), obtained through the analysis of extensive 1D and 2D NMR experiments (Tables 1-4), were also used to conirm the postulated structures to 14 and 16. The analysis of 1D and 2D NMR spectra was also used to make the complete hydrogen and carbon-13 chemical shift assignments for the alkaloid, the new 16-epi-solamargine (14) and for the two peracetyl derivatives 15 and 17.
Experimental
General procedure
Melting points have not been corrected. IR, NMR and mass spectra were recorded on the same equipments used in previous papers.21,32 Column chromatography was carried out with silica gel (Vetec and Aldrich 0.05-0.20 mm) and Sephadex LH-20 (Sigma, USA); silica gel F254 G (Vetec) was used for preparative TLC; aluminum backed (Sorbent) silica gel plates W/UV254 were used for analytical TLC, with visualization underUV (254 and 366 nm), withAlCl3 -ETOH (1%), Liebermann-Burchard and/or Godin reagents, or exposure to iodine vapor.
Plant material
The green fruits of Solanum crinitum Lam. were collected in September, 2001, in the campus of Universidade Federal Rural do Rio de Janeiro (UFRRJ), Seropédica-RJ, Brazil. They were collected by M.Sc. José Milton Alves (Agronomy Institute, UFRRJ). The identiication was made by Dr. Maria de Fátima Agra, Laboratório de Tecnologia Farmacêutica, Universidade Federal da Paraíba, João Pessoa-PB. A voucher specimen (No. JP-28000) was deposited at the Herbarium Prof. Lauro Pires Xavier, Universidade Federal da Paraíba, João Pessoa-PB, Brazil.
Extraction and isolation
The trichomes (9.7 g) were isolated by scraping the green fruits with a glass slide and were subsequently extracted with CHCl3 and MeOH in an ultrasound bath to furnish the CHCl3 extract (310.0 mg) and MeOH (3.0 g) residues. The CHCl3 residue was chromatographed on a sephadex CC, using MeOH as eluent, and 13 fractions were collected and analyzed by TLC and 1H NMR spectroscopy. Fractions 7-8 yielded astragaline (1, 10.0 mg) and fractions 9-10 yielded the tilirozide (2, 25.0 mg). The methanolic extract was chromatographed on a silica gel column (col A) and 20 fractions were collected and analyzed by TLC plate. Fractions 5-8 (2.0 g) were dissolved in methanol and addition of CH2Cl2 yielded a precipitate that was separated by iltration to afford a solid (1.6 g) that was identiied as kaempferol (3, mp 282-284 oC) and the mother liquor (AM-5-8). The reaction of kaempferol (65.0 mg) with diazomethane yielded 16.1 mg of 4 (mp 128-130 oC) and 36.6 mg of 5 (mp 140-142 °C) that were separated by preparative TLC. 20.3 mg of 5 were treated with Ac2O/ pyridine (1:1) to afford 6 (14.8 mg, mp 166-168 °C). The mother liquor (AM 5-8, 360.0 mg) was submitted to silica
Table 1.13C NMR spectral data for aglycone of 13, 14 and 16 in pyridine-d
5 (125 MHz: 13 and 14; 50 MHz: 16) and of peracetyl derivatives 15 and
17 in CDCl3 (125 MHz)*
C 13 14 15a 16 17a
1 (CH2) 37.9 37.5 37.3 37.6 37.1
2 (CH2) 30.5 30.2 29.7 30.2 29.5
3 (CH) 78.5 78.0 79.3 78.4 79.8
4 (CH2) 39.3 39.0 38.4 38.8 38.4
5 (C) 141.2 140.4 140.4 141.0 140.2
6 (CH) 122.2 121.9 122.2 121.8 121.9
7 (CH2) 32.1 32.3 31.8 32.3 31.6
8 (CH) 32.0 31.7 31.6 31.8 31.4
9 (CH) 50.7 50.3 50.3 50.3 50.0
10 (C) 37.5 37.2 36.9 37.2 36.7
11 (CH2) 21.5 21.1 21.0 21.2 20.6
12 (CH2) 40.5 39.7 40.0 39.9 39.8
13 (C) 41.0 40.8 42.9 40.8 42.7
14 (CH) 57.0 56.5 53.0 56.6 54.8
15 (CH2) 32.9 32.6 31.6 32.6 31.6
16 (CH) 79.2 81.1 75.9 78.6 75.6
17 (CH) 63.9 63.0 62.1 63.2 62.0
18 (CH3) 16.9 16.4 12.8 16.5 12.4
19 (CH3) 19.8 19.4 19.4 19.5 20.3
20 (CH) 42.0 42.0 40.0 41.9 39.7
21 (CH3) 16.1 15.7 21.1 15.8 21.4
22 (C) 98.7 98.5 99.7 98.5 99.2
23 (CH2) 35.0 34.0 35.2 34.3 35.0
24 (CH2) 31.4 30.0 30.1 30.5 30.8
25 (CH) 32.1 31.7 29.1 30.8 28.9
26 (CH2) 48.2 47.1 45.5 47.5 45.2
27 (CH3) 20.1 19.2 18.5 19.5 19.2
*Number of hydrogens bound to carbon atoms deduced by comparative analysis of {1H}- and DEPT-13C NMR spectra. 2D 1H-1H-COSY and 1H-13C-nJ
CH (n = 2 and 3) NMR spectra were also used in these assignments; a δ
gel CC and fractions 8-12 yielded a mixture of 8 and 9
(1.2 mg, gum). Fraction 10 (850 mg) from col A was chromatographed on a silica gel column and 130 fractions of 50 mL were collected. Fractions 32-40 yielded 35.5 mg of a material corresponding to the mixture of 10, 11 and 12. Fractions 94-114 (102.3 mg) were chromatographed on a silica gel column and fractions 3-5 yielded 7 (9.5 mg) after iltration on Sephadex LH20.
The green fruits (2.6 g) of Solanum crinitum Lam were powdered and extracted with ethanol + acetic acid (2%) and 900 mL of solution was obtained. 900 mL of acetic acid (10%) were added, and the solution was left to stand and chill overnight. The solution was iltered under vacuum using Hirsch funnel. NH4OH (pH 9-10) was added to the iltrate which was allowed to stand overnight in the fridge affording a precipitate (96.4 g) corresponding to the glycoalkaloids fraction was obtained. 90 g of the glycoalkaloids was adsorbed on silica gel and applied on a silica gel column, eluted with hexane, dichloromethane, ethyl acetate, acetone and methanol. 14 fractions of 500 mL were collected. Fraction 8 (1.0 g), collected with ethyl acetate, was chromatographed in a silica gel CC and fractions analyzed by silica gel TLC plate. Fraction 84 (52.6 mg) from this column was iltered on a Sephadex LH20 column, eluted with methanol, and the alkaloid solamargine 13 (268-270 °C) was obtained. Fraction
10(8.67 g) was extracted with methanol and the alkaloids were detected with Dragendorff and Libermann Burchard. This fraction was chromatographed on a silica gel column using CH2Cl2/MeOH (3:1) as initial eluent. 79 fractions were collected and were analyzed by TLC plate and reunited in group. Fractions 24-29(1.2 g) were iltered on a Sephadex LH-20 column and the epi-solamargine (14, 225.8 mg, 238-250 °C) was obtained. Acetic anhydride:pyridine (1:1) treatment of 14 (44.5 mg) yielded 44.5 mg of the peracetyl derivative 15 (mp 128-130 °C). Fractions 39-44 (1.3 g) were iltered on Sephadex LH20 to isolate solasonine (16, 93.5 mg, mp 244-246 °C). Treatment of 16 (79.1 mg) with acetic anhydride:pyridine (1:1) gave the peracetyl-solasonine (17, 27.6 mg, mp 148-150 °C).
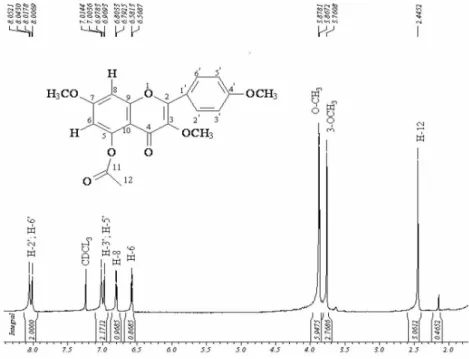
3,7,4’-trimethoxy-5-acethoxylavone (6)
Yellow powder, mp 166-168 °C; IR (KBr) νmax/cm-1: 1762, 1632, 1606, 1511; 1H NMR (CDCl
3, 500 MHz) d 6.60 (d, J 2.5 Hz), 6.82 (d, J 2.5 Hz), 8.02 (dd, J 9.0 Hz), 7.02 (d, J 9.0 Hz), 3.78, 3.90 (s), 3.89 (s), 2.47 (s), 13C NMR (CDCl3, 125 MHz) d154.8 (C-2), 140.8 (C-3), 173.2 (C-4), 150.5 (C-5), 108.0 (CH-6), 163.1 (C-7), 98.6 (CH-8), 157.8 (C-9), 111.4 (C-10), 122.9 (C-1’), 129.9 (CH-2’,6’), 114.0 (CH-3’,5’), 161.4 (C-4’), 59.9, 55.9, 55.3 (MeO-3,7,4’, respectively), 169.7/21.2 (COCH3-5).
Table 2.13C NMR spectral data for glycoside moieties of 13, 14 and 16 in pyridine-d
5 (125 MHz: 13 and 14; 50 MHz: 16) and of peracetyl derivatives
15 and 17 in CDCl3 (125 MHz)*
C trisaccharide of 13 trisaccharide of 14 trisaccharide of 15a trisaccharide of 16 trisaccharide of 17a
1’ (CH) 100.6 100.3 99.8 100.4 99.6
2’ (CH) 78.2 77.8 76.5 76.6 73.1
3’ (CH) 78.3 78.1 75.5 84.9 78.3
4’ (CH) 79.0 78.8 77.9 70.5 69.5
5’ (CH) 77.3 76.9 72.5 77.5 70.9
6’ (CH2) 61.7 61.3 62.1 62.6 62.0
1” (CH) 103.3 102.9 99.7 105.9 99.2
2” (CH) 72.9 72.5 70.5 72.6 71.8
3” (CH) 73.1 72.8 68.8 80.2 72.3
4” (CH) 74.3 73.9 70.8 75.2 68.2
5” (CH) 70.8 70.5 68.1 77.5 72.0
6” (CH3) 18.9 18.5 17.4 62.6 60.9
1’’’ (CH) 102.4 102.1 97.5 102.3 97.0
2’’’ (CH) 72.9 72.6 70.2 72.9 68.9
3’’’ (CH) 73.1 72.9 68.8 74.2 69.1
4’’’ (CH) 74.5 74.2 71.5 75.0 70.9
5’’’ (CH) 69.9 69.5 66.7 69.5 66.5
6’’’ (CH3) 19.0 18.7 17.5 18.7 17.1
*Number of hydrogens bound to carbon atoms deduced by comparative analysis of {1H}- and DEPT-13C NMR spectra. 2D 1H-1H-COSY and 1H-13C-nJ CH
(n = 2 and 3) NMR spectra were also used in these assignments; a δ
Epi-solamargine (14)
Colorless crystals, mp 238-250 °C; [α]25
D – 98 (c 0.1, MeOH); IR (KBr) νmax/cm-1: 3417, 2927, 1453, 1384, 1044 cm-1. HR-FABMS positive ions at m/z 868.5239 [M+H]+ (calc. for C
45H74NO15: m/z 868.505846), 722.4643 (calc. for C39H64NO11: 722.447937) [M+H-rhamnose]+, m/z 576.4037 (calc. for C33H54NO7: 576.390028) [M+H-rhamnose-rhamnose]+, m/z 445.7553 (calc. for C
21H33O10: 445.207372) [M-423]+, m/z 414.3467 (calc. for C
27H44NO2: 414.337204) [M+H-rhamnose-rhamnose-glucose]+, m/z 413.2782 (calc. for C27H43NO2: 413.329379) [M-rhamnose-rhamnose-glucose]+. 13C RMN: Tables 1 and 2. 1H RMN: Tables 3 and 4.
Peracetyl-epi-solamargine (15) Crystal, mp 128-130 °C, [α]25
D – 165 (c 0.1, MeOH); IR (KBr) νmax/cm-1: 2943. 2728, 1751, 1438, 1374, 1045; Positive ion FABMS m/z 1246.5522 [M+H]+ (calc. for
C63H92NO24: 1246.600928), m/z 1204.5278 (calc. for C61H90NO23: 1204.590364) [M+H-42]+, m/z 974.5256 (calc. for C51H76NO17: 974.511325) [M+H-rhamnose]+, m/z 932.5163 (calc. for C49H74NO16: 932.500760) [M-314]+, m/z 634.7963 (calc. for C39H56NO6: 634.410763) [M+H-612]+, m/z 413.2715 (calc. for C27H43NO2: 413.329379) [M-acetate-rhamnose-rhamnose-glucose]+. 13C RMN: Tables 1 and 2. 1H RMN: Tables 3 and 4.
Peracetyl-solasonine (17)
Crystal, mp 148-150 °C; 13C RMN: Tables 1 and 2; 1H RMN: Tables 3 and 4.
Supplementary Information
Supplementary data associated with this paper are available free of charge at http://jbcs.sbq.org.br, as a PDF ile including a molecular modeling study in order to
Table 3.1H NMR spectral data for aglycone of 13, 14 and 16 in pyridine-d
5 (500 MHz: 13 and 14; 200 MHz: 16) and of peracetyl derivatives 15 and 17 in CDCl3 (500 MHz). Chemical shifts in d (ppm) and coupling constants (J in parentheses) in Hz*
H 13 14 15a 16 17a
1 1.73/1.00 1.75/1.02 1.85/1.08 1.85/1.08
2 2.10/1.87 2.08/1.85 1.93/1.58 1.95/1.25
3 3.89 (m) 3.89 (m) 3.60 3.93 (m) 3.58 (m)
4 2.82/2.75 2.81 (dd, J 11.6; 3.1)
2.73 (t, J 11.6 )
2.40/2.25 2.87/2.76 2.45/2.28
6 5.32 (br s) 5.33 (br s) 5.36 (m) 5.30 (br s) 5.38 (m)
7 1.90 1.85 1.94 2.30/1.68
8 1.48 1.58 1.56 1.53
9 0.90 0.89(m) 0.95 0.95
11 1.45 1.42 1.55-1.45 1.55-1.45
12 1.63/1.05 1.68/1.09 2.08/1.25 2.08/1.25
14 1.10 1.09 (m) 0.98 0.98
15 2.08/1.45 2.08/1.48 2.20/1.70 1.95/1.85
16 4.42 4.82 5.06 4.21 5.08
17 1.78 2.02 1.53 1.53
18 0.88 (s) 0.85 (s) 0.87 (s) 0.82 (s) 0.91 (s)
19 1.07 (s) 1.06 (s) 1.01 (s) 1.03 (s) 1.04 (s)
20 1.98 2.14 2.10 2.08
21 1.09 (d, J 6.9) 1.28 (d, J 6.7) 1.26 (d, J 6.9) 1.17 (d) 1.26 (d, J 7.0)
23 1.90/1.65 1.92/1.78 2.36/1.04 2.35/1.03
24 1.52 1.65 2.28/1.68 1.70/1.65
25 1.65 1.58 2.02 2.02
26 2.78 3.04 (m)/2.89 (t, J 11.5) 3.20 2.83 3.16(m)
27 0.83 (d, J 4.8) 0.79 (d, J 6.5) 0.92 (d, J 6.6) 0.76(d) 0.93 (d, J 7.5)
*Number of hydrogens bound to carbon atoms deduced by comparative analysis of {1H}- and DEPT-13C NMR spectra. Chemical shifts and coupling
constants (J, in parentheses) obtained from 1D 1H NMR spectra. 2D 1H-1H-COSY and 1H-13C-nJ
CH (n = 2 and 3) NMR spectra were also used in these
assignments; a δ
Table 4.1H NMR spectral data for glycoside moieties of 13, 14 and 16 in pyridine-d
5 (500 MHz: 13 and 14; 200 MHz: 16) and of peracetyl derivatives
15 and 17 in CDCl3 (500 MHz). Chemical shifts in d (ppm) and coupling constants (J in parentheses) in Hz*
H Glycoside unit of 13 Glycoside unit of 14 Glycoside unit of 15a Glycoside unit of 16 Glycoside unit of 17a
1’ 4.95 4.96 4.56 (d, J 7.7) 4.95 4.46 (d, J 8.0)
2’ 4.24 4.22 3.56 3.98 3.84 (dd, J 8.0; 9.5)
3’ 4.23 (t) 4.23 5.28 (t, J 9.4) 4.33 (m) 3.91 (dd, J 9.5; 3.0)
4’ 4.42 (t) 4.40 3.73 (t, J 9.4) 4.82 5.26 (br s)
5’ 3.65 (br d, J 9.2) 3.66 (td, J 9.2) 3.59 (m) 3.79 (m)
6’ 4.22(br d, J 12.0) 4.10 (br d, J 12.0)
4.23 (dd, J 12.1; 3.2)n 4.10 (dd, J 12.1; 3.2)
4.44 (d, J 12.3) 4.28 (dd, J 12.3; 3.6)
4.12 (m) 4.06 (m)
1” 5.86 (s) 5.87 (s) 4.79 (d, J 1.5) 5.17(d) 4.71 (d, J 8.0)
2” 4.69 (sl) 4.69(d, J 1.4) 5.02 (m) 4.68 (sl) 4.85 (dd)
3” 4.55 (dd, J 9.1; 2.9) 4.55 (dd, J 9.2; 3.2) 5.16 (dd, J 10.2; 3.1) 5.22 (t)
4” 4.38 4.34 (t, J 9.2) 5.03 (t, J 10.2) 5.08
5” 4.92 4.93 (m) 3.85 (m) 3.69 (m)
6” 1.64 (d, J 5.9) 1.64 (d, J 6.1) 1.14 (d, J 6.1) 4.38 (br d, J 10.5)/4.10
1’’’ 6.41 (s) 6.41 (s) 4.90 (d, J 1.5) 6.28 (s) 5.02 (sl)
2’’’ 4.84 (br s) 4.84 (d, J 1.8) 5.00 (m) 4.90 (d) 5.22
3’’’ 4.64 (dd, J 9.1; 2.9 4.64 (dd, J 9.2; 3.3) 5.23 (dd, J 10.1 Hz; 3.1) 4.61 5.22
4’’’ 4.34 4.32 (t, J 9.2) 5.05 (t, J 10.1) 5.02(m)
5’’’ 4.96 4.98 (m) 4.36 (m) 4.88 (br s) 4.43 (m)
6’’’ 1.78 (d, J 6.0) 1.78 (d, J 6.2) 1.17 (d, J 6.2) 1.78 (d) 1.19 (d, J 6.0 )
*Number of hydrogen bound to carbon atoms deduced by comparative analysis of {1H}- and DEPT-13C NMR spectra. Chemical shifts and coupling
constants (J, in parentheses) obtained from 1D 1H NMR spectra. 2D 1H-1H-COSY and 1H-13C-nJ
CH (n = 2 and 3) NMR spectra were also used in these
assignments; a δ
COCH3: 1.98-2.15 (8×CH3).
compare the relative stabilities of the epimeric structures
13 and 14.
Acknowledgments
The authors are grateful to CNPq, FAPERJ and CAPES for research fellowships and inancial support. They also thank CENAUREMN for the 500 MHz NMR spectra, Laboratório Plataforma de Métodos Analíticos de Farmanguinhos/FIOCRUZ for the 400 MHz NMR spectra. They thank MSc J.M. Alves and Dr. M. de F. Agra for the collection and classiication of plant material.
References
1. Agra, M. F.; Novon1999, 9, 292.
2. Fukuhara, K.; Shimizu, K.; Kubo, I.; Phytochemistry2004, 65, 1283.
3. Alves, C. C. F.; Alves, J. M.; Silva, T. M. S.; Carvalho, M. G. de; Neto, J. J.; Floresta e Ambiente2003, 10, 93.
4. Silva, T. M. S.; Câmara, C. A.; Agra, M. F.; Carvalho, M. G. de; Frana, M. T.; Brandoline, S. V. P. B.; Paschoal, L. S.; Braz-Filho, R.; Fitoterapia 2006, 77, 449.
5. Mola, J. L.; Araujo, E. R.; Magalhães, G. C.; Quim. Nova1997, 20, 460.
6. D’arcy, W. G.In The Biology and Taxonomy of the Solanaceae; Hawkes, J. G.; Lester, R. N.; Skelding, A., eds., Academic Press: London, 1979, pp. 3-49.
7. Steinharter, T. P.; Cooper-Driver, G. A.; Anderson, G. J.; Biochem.Syst. Ecol.1986, 14, 299.
8. Silva, T. M. S.; Carvalho, M. G. de; Braz-Filho, R.; Agra, M. F.; Quim. Nova2003, 26, 517.
9. Agra, M. F.; PhD Thesis, Universidade de São Paulo, Brazil,2000. 10. Dias-Filho,M. B.; Pesq. Agropec. Bras. 1997, 32, 789. 11. Silva, T. M. S.; Nascimento, R. J. B.; Câmara, C. A.; Castro, R.
N.; Braz-Filho, R.; Agra, M. de F.; Carvalho, M. G. de; Biochem. Syst. Ecol.2004, 32, 513.
12. Silva, T. M. S. da; Braz-Filho, R.; Carvalho, M. G. de; Agra, M. de F.; Biochem. Syst. Ecol. 2002, 30, 1083.
13. Silva, T. M. S. da; Silva, C. de C.; Braz-Filho, R.; Carvalho, M. G. de; Agra, M. de F.; Rev. Bras. Farmacogn. 2002, 12, 85. 14. Souza, A. E.; Silva, T. M. S. da; Alves, C. C. F.; Carvalho, M.
G. de; Braz-Filho, R.; Echevarria, A.; J. Braz. Chem. Soc. 2002, 13, 838.
16. Kaouadji, M.; Phytochemistry1990,29, 2295.
17. Agrawal, P. K.; Bansal, M. C. In Carbon-13 NMR of Flavonoids, Studies in Organic Chemistry; Elsevier: Amsterdam, 1989, p. 362. 18. Markham, K. R.; Geiger, H. In The Flavonoids Advances in Research Since 1986; Harborne, J. B., ed., Chapman & Hall: London, 1994, pp. 441.
19. Dong, H. Y.; Gou, L.; Cao, S. G.; Chen, S. X.; Sim, K. Y.; Goh, S. H.; Kini, R. M.; Phytochemistry 1999, 50, 899.
20. Mathias, L.; Vieira, I. J. C.; Braz-Filho, R.; Rodrigues-Filho, E. A.; J. Nat. Prod. 1998, 61, 1158.
21. Silva, V. C. da; Carvalho, M. G. de; Silva, S. L. da C. e; Rev. Latinoam. Quim. 2007, 35, 13.
22. Marin, J. C.; Torres, F.; Rev. Lationoam. Quim. 2001, 29, 100. 23. Rasmussen, S.; Wolff, C.; Rudolph, H.; Phytochemistry1996,
42, 81.
24. Silva, A. M. S.; Alkorta, I.; Elguero, J.; Silva, V. L. M.; J. Mol. Struct.2001, 595, 1.
25. Scott, K. N.; J. Am. Chem. Soc. 1972, 94, 8564. 26. Ripperger, H.; Phytochemistry1995, 39, 1475.
27. Lorey, S.; Porzel, A.; Ripperger, H.; Phytochemistry 1996, 41, 1633.
28. Wanyonyi, A. W.; Chiabra, S. C.; Mkoji, G.; Eilert, U.; Njue, W. M.; Phytochemistry2002, 59, 79.
29. Weissenberg, M.; Phytochemistry2001, 58, 501.
30. Usubillaga, A.; Aziz, I.; Tettamanzi, M. C.; Waibel, R.; Phytochemistry1997, 44, 537.
31. Lee, C.; Yang, W.; Parr, R. G.; Phys. Rev. B: Condens. Matter Mater. Phys. 1988, 37, 785.
32. Carvalho, M. G. de; Silva, V. C. da; Silva, T. M. S. da; Câmara, C. A.; Braz-Filho, R.; An. Acad. Bras. Cienc. 2009, 81, 21.
Submitted: March 23, 2009
Published online: August 12, 2010
Supplementary Information
Printed in Brazil - ©2010 Sociedade Brasileira de Química0103 - 5053 $6.00+0.00
*e-mail: [email protected]
Other Chemical Constituents Isolated from
Solanum crinitum
Lam. (Solanaceae)
Marli T. F. Cornelius,a Mário G. de Carvalho,*,a Tania M. S. da Silva,a
Cassia C. F. Alves,a Ana P. N. Siston,a Kelly Z. Alves,a Carlos M. R. Sant’Anna,a
Mario B. Neto,b Marcos N. Eberlinb andRaimundo Braz-Filhoc
aDepartamento de Química, ICE, Universidade Federal Rural do Janeiro, BR 465 km 07,
23890-000 Seropédica-RJ, Brazil
bInstituto de Química, Universidade Estadual de Campinas, 13084-862 Campinas-SP, Brazil
cSetor de Química de Produtos Naturais, LCQUI, CCT, Universidade Estadual do Norte Fluminense
Darcy Ribeiro, 28013-602 Campos dos Goytacazes-RJ, Brazil
Figure S2.1H NMR spectrum of compound 2.
Figure S4. 13C NMR spectrum of compound 4.
Figure S6. 1H NMR spectrum ofcompound 6.
Figure S8.1H NMR spectrum(500 MHz) of compounds 8+9.
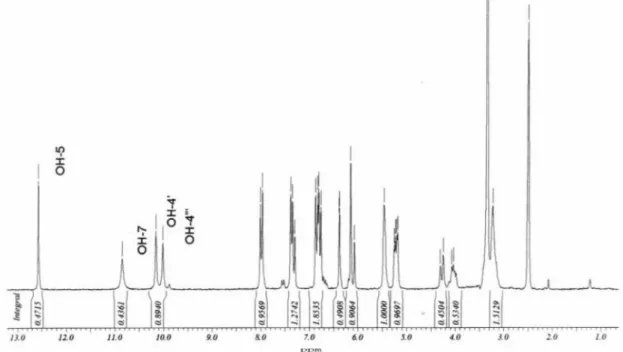
Figure S10.1H NMR spectrum (500 MHz, Pyridine-d
5) of the compound 13.
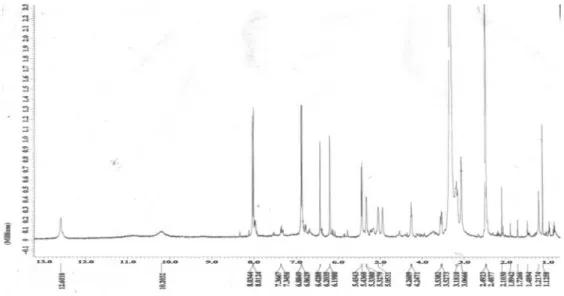
Figure S12.13C NMR spectrum (125 MHz) of compound 15.
Molecular Modeling
In order to compare the relative stabilities of the epimeric structures 13/14, a molecular modeling study
was implemented using the Spartan 06 for Linux program (Wavefunction, Inc.). Because the long chain attached to C-3 should only have a small inluence on the relative stabilities, it was replaced by a methoxy group to reduce the computational cost for the calculations. The conformer distribution of the resulting alpha and beta epimer models (13a and 14a) was determined with the Monte Carlo
approach using the MMFF molecular mechanics force ield. The most stable conformers of 13a and 14a were
submitted to a previous energy minimization with the PM3 semi empirical method.31 The PM3 optimized structures
were then submitted to a complete energy minimization with the B3LYP/6-31G* DFT method. The B3LYP method was chosen because it usually yields results for many properties in close agreement with those obtained from
MP calculations, and is more eficient than conventional ab initio correlated methods for larger-scale calculations. The possibility of existence of this epimer as a stable species was veriied by a molecular modeling study at the DFT B3LYP/6-31G* level with models of both epimers. Theβ-epimer model at C-20 (14a) is less stable than the
α-epimer one (13a), but the energy difference between
both structures is only 4.85 kcal mol-1 (20.30 kJ mol-1), as
calculated with the B3LYP/6-31G* DFT method. Because of this small energy difference, the β-epimer is expected to exist in appreciable amount in an equilibrium mixture with the more stable α-epimer. The main reason for the lower stability of the β-epimer should be the proximity between the C-21 methyl group and carbons C-23 and C-18. The corresponding C-C distances, which are equal to 4.22 Å and 3.47 Å, respectively, in 13a, are considerably shorter in 14a, 3.43 Å and 2.98 Å, respectively. This closer proximity
would raise more unfavorable steric interactions in 14a than
in 13a (FigureS15).