ABSTRACT:Objective: To evaluate the changes in beverage consumption among adolescents between 2003
and 2008. Methods: Two school‑based cross‑sectional studies were carried out with public school students (12 to 19 years‑old) from Niterói, Rio de Janeiro, Brazil. Data from three food records were used to estimate daily, weekdays and weekend average consumption (volume and percent contribution for total daily energy intake) of milk and milk‑based beverages, sugar sweetened beverages, fresh squeezed fruit juices, cafeinated and alcoholic beverages. Beverage consumption age‑adjusted means for weekdays and weekends were compared using linear regression (Generalized Linear Models – GLM). Results: A total of 433 adolescents were examined in 2003, and 510 in 2008. The prevalence of overweight was 17% in 2003 and 22% in 2008 (p > 0.05). Milk was the most consumed beverage, being reported by 89% of adolescents, followed by sodas (75%). In general, in the ive‑year period, there was an increase in the prevalence of consumption of alcoholic drinks, guarana syrup refreshment, and processed fruit drinks, especially on weekdays. The soft drink was the largest contributor to the total energy consumption, corresponding on average to 4% of daily energy intake. Conclusion: The main changes in the beverage consumption among adolescents from Niterói, in the irst decade of the XXI century, were the tendency to reduce the consumption of milk and the increase in the consumption of processed and alcoholic beverages.
Keywords: Adolescent. Nutritional Status. Food consumption. Food habits. Beverages. Serial cross‑sectional studies.
Changes in beverage consumption among
adolescents from public schools in
the irst decade of the century XXI
Modiicações no consumo de bebidas de adolescentes de
escolas públicas na primeira década do século XXI
Luana Silva MonteiroI, Thaís Meirelles de VasconcelosI,
Gloria Valéria da VeigaI, Rosângela Alves PereiraI
ORIGINAL ARTICLE / ARTIGO ORIGINAL
IDepartment of Social and Applied Nutrition, Universidade Federal do Rio de Janeiro – Rio de Janeiro (RJ), Brazil.
Corresponding author: Rosangela Alves Pereira. Departamento de Nutrição Social e Aplicada, Instituto de Nutrição Josué de
Castro, Universidade Federal do Rio de Janeiro. Avenida Carlos Chagas Filho, 373, Centro de Ciências da Saúde, bloco J, 2º andar, CEP: 21941‑902, Rio de Janeiro, RJ, Brasil. E‑mail: [email protected]
Conlict of interests: nothing to declare – Financial support:: Support of the National Scientiic and Technological Development
Council (Conselho Nacional de Desenvolvimento Cientíico e Tecnológico – CNPq) process No. 283/02 (research 2003) and the
INTRODUCTION
In many parts of the world, important changes in the eating habits of adolescents have been observed, whose consumption is characterized by reduced amounts of vege‑ table, fruit, calcium, iron, protein sources, and high intake of processed foods with high energy density and rich in fat, sugar, and sodium1. Such habits contribute to the exces‑
sive weight gain and early development of metabolic disorders, which until recently were more common among middle‑aged individuals, such as dyslipidemia2, alterations
in the metabolism of insulin and glucose3, and blood pressure elevation4. In this sce‑
nario, beverages, especially those added with sugar, have been highlighted owing to their probable role in the development of obesity and in the control of satiety. The cal‑ ories from the consumption of beverages have been listed as an important source for increased consumption of energy, and the contribution of beverages with added sugar for the epidemic of overweight and obesity5 and diabetes6 has been evidenced. Moreover,
the consumption of this kind of beverage has been associated with worse quality in diet and reduction of milk consumption7. The excessive consumption of beverages with
added sugar has been related to the inappropriate intake of calcium, fibers, proteins and vitamin D8, excess of weight, increased waist circumference, increased cholesterol,
serum triglycerides, and blood pressure9,10.
The intake of namely unhealthy foods, such as beverages with added sugar, among Brazilian adolescents has been observed in nationwide researches. For example, results
RESUMO:Objetivo: Avaliar mudanças no consumo de bebidas em adolescentes entre 2003 e 2008. Métodos: Foram realizados dois estudos transversais de base escolar com estudantes de 12 a 19 anos de idade de escolas públicas de Niterói, Rio de Janeiro. Dados de três registros alimentares foram utilizados para estimar o consumo médio diário, de dias de semana e de inal de semana (volume e a contribuição para a ingestão diária de energia) de leite, bebidas à base de leite, bebidas com adição de açúcar, suco de frutas frescas, bebidas cafeinadas e bebidas alcoólicas. Foram utilizados Modelos Lineares Generalizados (GLM) para estimar médias ajustadas por idade e as diferenças nos estimadores segundo os dias de semana. Resultados: Foram investigados 433 adolescentes em 2003 e 510 foram investigados em 2008. A prevalência de excesso de peso foi de 17% em 2003 e de 22% em 2008 (p > 0,05). O leite foi a bebida mais consumida, sendo relatada por 89% dos adolescentes, seguido dos refrigerantes (75%). De maneira geral, no período de cinco anos, veriicou‑se aumento da prevalência de consumo de bebidas alcoólicas, bebidas à base de xarope de guaraná e sucos processados, especialmente nos dias de semana. O refrigerante foi a bebida que mais contribuiu para o consumo energético total, correspondendo, em média, a 4% da ingestão energética diária. Conclusão: As principais mudanças no peril de consumo de bebidas entre os adolescentes de Niterói na primeira década do século XXI foram a tendência para redução do consumo de leite e o aumento no consumo das bebidas processadas e das bebidas alcoólicas.
from the National Student Health Survey (NSHS) of 2012 revealed that 33.2% of the adolescents consume soft drinks in 5 or more days of the week, considering this is one of the markers for unhealthy diet more often mentioned by students11. Besides, data
from the National Food Survey (2008 – 2009) showed that the adolescents had increased consumption of beverages with added sugar, such as juice, soft drinks, and refreshments, with a mean consumption of those beverages in this age range (122 mL daily) higher than the double of the mean for adults and elderly persons12. Analyzing the data from
those nationwide surveys, Pereira et al.13 verified that the mean global contribution of
beverages in the intake of energy by Brazilians was 17.1%, considering that, among ado‑ lescents, this contribution was more significant than among adults and elderly persons. Several studies showed an increased consumption of beverages with added sugar in different contexts. In Brazil, an analysis developed by Levy et al.14 with data of house‑
hold availability of food in the country showed that, between the 1970s and the 2000s, the consumption of soft drinks increased 400%. In Mexico, Barquera et al.15 analyzed
the changes in the consumption of beverages between the years of 1999 and 2006 from the data of researches with national representativeness, observed that, in this period, the consumption of high calorie beverages, such as beverages with added sugar, increased more than twice among adolescents from 10 to 18 years of age. In the United States, Nielsen and Popkin16 showed that, between 1977 and 2001, the changes in the consump‑
tion of beverages were marked by the increased consumption of beverages with added sugar and reduction of milk intake.
Despite these evidences, there are few studies that specifically examine the con‑ sumption of beverages among Brazilian adolescents, especially focusing on changes in their intake. This way, this study analyzes data from two cross‑sectional studies, with identical methodological design, with the objective of evaluating the changes in bev‑ erage consumption among adolescents in urban areas in Brazil in the first decade of the 21st century.
METHODS
The data of beverage consumption were obtained from two cross‑sectional school‑ based studies developed in 2003 and 2008, with adolescents between 12 and 19 years of age, students in 13 public schools in the city of Niterói, located in the metropolitan region of Rio de Janeiro, Brazil.
600 students, adding up 30% owing to possible no‑answers, estimating a final sample size of 780 adolescents17. Pregnant adolescents and those with physical disabilities, which
would prevent an anthropometric evaluation, were not considered eligible.
Both projects were approved by the Ethics Committees (CEP) of the institutions involved: CEP of the School Hospital Clementino Fraga Filho, on June 11, 2002, and by the CEP of the Pediatrics and Childcare Institute Martagão Gesteira, on April 11, 2008. Only the adolescents who presented their Informed Consent signed by their legal guardians or by themselves, when older than 18 years of age, took part in the studies.
The data were collected in the school by trained examiners and after the standardiza‑ tion process to take anthropometric measures18. The status of the weight was classified
based in the z scores of the body mass index (BMI = weight/height2) considering excess
of weight for the z scores above + 1, as proposed by the WHO19. In order to take the
anthropometric measures, the examinee stood barefoot and with light clothes. For the measurement of weight, in both studies, a digital portable scale by Kratos (PPS plat‑ form) was used, with a capacity of 150 kg and variation of 50 g. In 2003, the height was measured with a portable estadiometer by Leicester, and the Alturaexata was used in 2008; both instruments had variation of 0.1 cm. The measures of height were taken twice, and the mean of both measures were considered as long as their variation did not exceed 0.5 cm. In case the variation would exceed this value, the measures would be repeated. Owing to the high precision of the digital scale, the body weight was mea‑ sured only once.
MEASUREMENT AND ANALYSIS OF THE INFORMATION OF BEVERAGE CONSUMPTION
The adolescents completed 3‑day food records within a week, with 2 days during the week and 1 day on the weekend. Nutritionists trained for this activity guided the participants to describe all foods and preparations they ate on the specified days, the quantities in household measures, and the time and place of the meal. At the time of collecting the food records, the nutritionists would review, along with the students, the information recorded. At this moment, the evaluator probed whether there was any omission of items, refined the information about the quantities consumed, and eluci‑ dated situation that could rise confusion, such as preparations or nonrecognized foods, long period without any entries, or very few entries for 1 day. Besides, the interviewers also asked about the items usually omitted in food diaries, such as butter, coffee, candy, sweets, and small snacks, among others.
Table of Household Measures22, preferably in that order. The composition of processed
foods was obtained from the nutritional information available on food labels. In order to evaluate the implausible food intake, we adopted the proposal by Andrade et al.23 as
a criterion, which considers as being acceptable the energy intake of over 500 kcal and less than 6,000 kcal. However, in this study, we did not observe adolescents with infor‑ mation about daily intake of energy outside these limits.
We analyzed the consumption of milk and dairy products (milk, chocolate flavored milk), yogurt/milky beverage (beverages resulting from a mix of milk and buttermilk, added of food products), beverages with added sugar (guarana syrup‑based beverages, soda, and processed juices), fresh fruit juice, caffeinated beverages (coffee, tea, and mate), and alcoholic beverages (beer, liquor, wine, vodka, and whiskey). Water intake was not evaluated.
In order to standardize the calculation of the quantities of mixed preparation bev‑ erages, such as, for example, latte, it was estimated the combination of the respective foods in equal parts, based on the rules proposed by the Brazilian Institute of Geography and Statistics12, which were also adopted in order to standardize the amounts of sugar
added to the drinks in 10% (10 g of sugar for each 100 mL of beverage). In relation to artificial powdered juice and the chocolate powder, the specification from the manu‑ facturer was used, respectively, 35 g of powder for each 1000 mL of water and 20 g of powder for each 160 mL of milk.
ANALYSIS OF THE DATA
For the analysis, the design effect of the sample and the expansion based on sam‑ ple weight were considered. The prevalence, the means and 95% confidence intervals (95%CI) of the weekly beverage consumption were estimated, as well as the consump‑ tion in days of the week and on weekends for 2003 and 2008. The consumption of beverages was measured in volume (mL) and in energy provided by the beverages (kcal), evaluating the contribution of beverages for the total daily energy intake. The analy‑ sis regarding energy intake from beverages were estimated for the overall population and considering only the group of consumers of each specific beverage. In order to estimate the overall mean, it was estimated the mean of the 3 days of consumption for each beverage for each adolescent. In order to estimate the mean consumption of beverages during the days of the week, we considered the consumption reported for the 2 days of the week. In order to estimate the mean beverage consumption for the weekend, it was estimated its mean consumption during weekends.
The Kolmogorov‑Smirnov test was used in order to verify the symmetry of the dis‑ tributions. To compare the means for beverage consumption between the two studies and between weekdays and weekends, the Generalized Linear Models (GLM) were used. The frequencies were compared by the χ2‑test. The means and frequencies were adjusted
RESULTS
In 2003, 764 adolescents were considered eligible for the study; 610 (80%) were examined, and 433 (71%) presented complete data about food consumption. In 2008, 918 adolescents were eligible to take part in the study; 700 (76%) of them were examined, and 510 (73%) presented complete data on food consumption. There were no signifi‑ cant differences in the proportions of gender, age range, and weight status (p ≥ 0.05), when comparing the investigated groups in the overall samokes of the studies between 2003 and 2008 when analyzed in this study (2003: 610 versus 433; 2008: 700 versus 510).
The mean age of the 433 adolescents examined in 2003 (of which 69.3% were girls) was 16.9 years of age and standard deviation (SD) of 1.5 years of age. The mean age in the study in 2008 was 16.1 years of age (SD = 1.8 years of age), and from the 510 partici‑ pants, 64.3% of them were girls. It was verified an excess of weight in 16.9% adolescents in 2003 and 22% in 2008 (p ≥ 0.05). No statistically significant difference was observed for the prevalence of excess of weight according to gender in both periods analyzed.
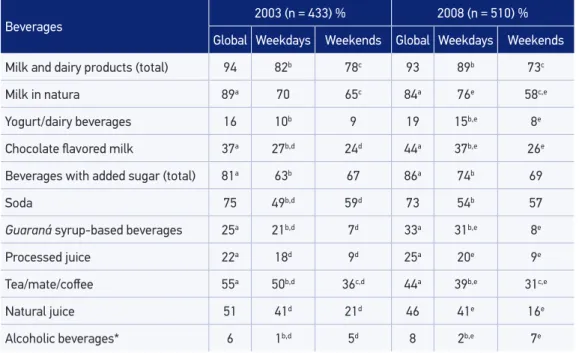
The consumption of some kind of beverage was reported by 99% of the adolescents studied in both studies. There were no significant differences in the consumption of bev‑ erage according to gender. Milk was the drink more often reported by adolescents: 89% of the adolescents reported consuming milk weekly in 2003 and 84% in 2008 (p = 0.02). Milk was consumed in greater proportion during weekdays when compared with week‑ ends, with a reduction in the consumption frequency of milk on weekends between 2003 and 2008: in 2003, 70% of adolescents reported consuming milk on weekdays and 65% on weekends (p = 0.05); in 2008, these proportions were 76 and 58% (p < 0.01), respectively. On the other hand, the consumption of chocolate flavored milk increased between 2003 and 2008 (37 versus 44%; p = 0.04), considering this product was more conusmed on weekdays rather than on weekends (Table 1).
The group of beverages with added sugar was the second more often reported one by adolescents, with soda being mentioned by 75 and 73% of adolescents in 2003 and 2008, respectively (p = 0.5). In 2003, the reference fo soda consumption was lower on weekdays than on weekends (49 versus 59%; p < 0.01). However, in 2008, the difference in the prevalences of soda consumption between weekdays and weekends disappeared (54 versus 57%; p = 0.20), observing, therefore, a significant increase in the consump‑ tion of those drinks on weekdays (Table 1).
Over 5 years, in general, it was also verified an increase in the proportion of con‑ sumption of guarana syrup‑based beverages (25 versus 33%; p < 0.01). However, the proportion of adolescents who reported consuming these drinks during weekdays increased in, approximately, 50% (21 versus 31%; p < 0.01), considering that in both studies the consumption of those beverages was less frequent on weekends (2003: 7% and 2008: 8%) in comparison to weekdays (Table 1).
of tea/mate/coffee (55 versus 44%; p < 0.01), which was reduced by 22% on week‑ days (50 versus 39%; p < 0.01). Although modest, the consumption of alcohol during weekdays doubled (1 versus 2%; p = 0.04). In both studies, it was observed greater frequency of processed juice consumption, tea/mate/coffee on weekdays and of alcohol on weekends (Table 1).
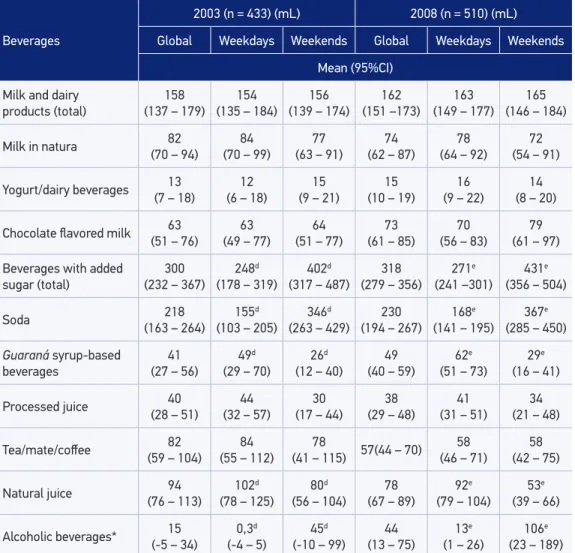
Considering the quantities consumed of those beverages, it was observed that, both in 2003 and in 2008, the mean consumption of the guaraná syrup‑based beverage was higher on weekdays in comparison with weekends (2003: 49 versus 26 mL; p = 0.02 and 2008: 62 versus 29 mL; p < 0.01). The same was observed for natural juice (2003: 102
versus 80 mL; p < 0.01 and 2008: 92 versus 53 mL; p < 0.01). On the other hand, other beverages were consumed in larger quantities during weekends, notably, soda (2003: 155 versus 346 mL; p < 0.01 and 2008: 168 versus 367 mL; p < 0.01), alcohol (2003: 0.3 versus 45 mL; p < 0.01 and 2008: 13 versus 106 mL; p < 0.01), and beverages with added sugar in general (2003: 248 versus 402 mL; p < 0.01 and 2008: 271 versus 431 mL; p < 0.01) (Table 2).
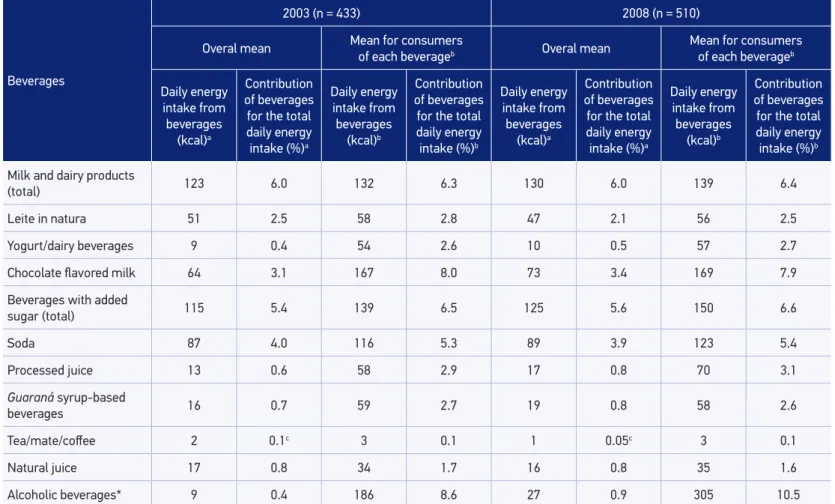
In relation to the calories provided by those drinks, it was veriied an increase in energy from the consumption of beverages in general, both when it was considered the daily
Table 1. Prevalence of beverage consumption on weekdays and on weekends. Adolescent students of public schools in Niterói, RJ, 2003 and 2008.
Beverages 2003 (n = 433) % 2008 (n = 510) %
Global Weekdays Weekends Global Weekdays Weekends
Milk and dairy products (total) 94 82b 78c 93 89b 73c
Milk in natura 89a 70 65c 84a 76e 58c,e
Yogurt/dairy beverages 16 10b 9 19 15b,e 8e
Chocolate lavored milk 37a 27b,d 24d 44a 37b,e 26e
Beverages with added sugar (total) 81a 63b 67 86a 74b 69
Soda 75 49b,d 59d 73 54b 57
Guaraná syrup-based beverages 25a 21b,d 7d 33a 31b,e 8e
Processed juice 22a 18d 9d 25a 20e 9e
Tea/mate/cofee 55a 50b,d 36c,d 44a 39b,e 31c,e
Natural juice 51 41d 21d 46 41e 16e
Alcoholic beverages* 6 1b,d 5d 8 2b,e 7e
Beverages
2003 (n = 433) (mL) 2008 (n = 510) (mL)
Global Weekdays Weekends Global Weekdays Weekends
Mean (95%CI)
Milk and dairy
products (total) (137 – 179)158 (135 – 184)154 (139 – 174)156 (151 –173)162 (149 – 177)163 (146 – 184)165
Milk in natura (70 – 94)82 (70 – 99)84 (63 – 91)77 (62 – 87)74 (64 – 92)78 (54 – 91)72
Yogurt/dairy beverages (7 – 18)13 (6 – 18)12 (9 – 21)15 (10 – 19)15 (9 – 22)16 (8 – 20)14
Chocolate lavored milk (51 – 76)63 (49 – 77)63 (51 – 77)64 (61 – 85)73 (56 – 83)70 (61 – 97)79
Beverages with added
sugar (total) (232 – 367)300 248 d
(178 – 319) 402 d
(317 – 487) (279 – 356)318 271 e
(241 –301) 431 e (356 – 504)
Soda (163 – 264)218 155
d
(103 – 205) 346 d
(263 – 429) (194 – 267)230 168 e
(141 – 195) 367 e (285 – 450)
Guaraná syrup-based beverages
41
(27 – 56) 49 d
(29 – 70) 26 d
(12 – 40) (40 – 59)49 62 e
(51 – 73) 29 e (16 – 41)
Processed juice 40
(28 – 51) (32 – 57)44 (17 – 44)30 (29 – 48)38 (31 – 51)41 (21 – 48)34
Tea/mate/cofee (59 – 104)82 (55 – 112)84 (41 – 115)78 57(44 – 70) (46 – 71)58 (42 – 75)58
Natural juice (76 – 113)94 (78 – 125)102d (56 – 104)80d (67 – 89)78 (79 – 104)92e (39 – 66)53e
Alcoholic beverages* 15
(-5 – 34) 0,3 d
(-4 – 5) 45 d
(-10 – 99) (13 – 75)44 13 e
(1 – 26) 106 e (23 – 189)
In order to compare these quantities, the Student’s t-test for independent samples was used: aglobal comparison of 2003 with 2008 (p < 0.05); bcomparison of weekdays of 2003 with 2008 (p < 0.05); ccomparison of weekends of 2003 with 2008 (p < 0.05); dcomparison of weekdays and weekends of 2003 (p < 0.05); ecomparison of weekdays and weekends of 2008 (p < 0.05); *beer, liquor, wine, vodka, and whiskey.
Table 2. Means and conidence intervals of 95% of the daily consumption of beverages on weekdays and on weekends. Adolescent students of public schools in Niterói, RJ, 2003 and 2008.
Beverages
2003 (n = 433) 2008 (n = 510)
Overal mean Mean for consumers of each beverageb Overal mean Mean for consumers of each beverageb
Daily energy intake from beverages
(kcal)a
Contribution of beverages for the total daily energy intake (%)a
Daily energy intake from beverages
(kcal)b
Contribution of beverages for the total daily energy intake (%)b
Daily energy intake from beverages
(kcal)a
Contribution of beverages for the total daily energy intake (%)a
Daily energy intake from beverages
(kcal)b
Contribution of beverages for the total daily energy intake (%)b
Milk and dairy products
(total) 123 6.0 132 6.3 130 6.0 139 6.4
Leite in natura 51 2.5 58 2.8 47 2.1 56 2.5
Yogurt/dairy beverages 9 0.4 54 2.6 10 0.5 57 2.7
Chocolate lavored milk 64 3.1 167 8.0 73 3.4 169 7.9
Beverages with added
sugar (total) 115 5.4 139 6.5 125 5.6 150 6.6
Soda 87 4.0 116 5.3 89 3.9 123 5.4
Processed juice 13 0.6 58 2.9 17 0.8 70 3.1
Guaraná syrup-based
beverages 16 0.7 59 2.7 19 0.8 58 2.6
Tea/mate/cofee 2 0.1c 3 0.1 1 0.05c 3 0.1
Natural juice 17 0.8 34 1.7 16 0.8 35 1.6
Alcoholic beverages* 9 0.4 186 8.6 27 0.9 305 10.5
aper capita mean, considering the whole population studies; bvalues regarding the individuals who speciically consumed each beverage; for comparison between the means of 2003 and 2008, the Student’s t-test was used for independent populations: ccomparison of the percentage contribution of beverages for the total energy consumption of 2003 with 2008 (p < 0.05); *beer, liquor, wine, vodka, and whiskey.
DISCUSSION
We analyzed the changes in beverage consumption among adolescents of public schools in the metropolitan area of Rio de Janeiro from the data obtained in two cross‑sectional school‑based studies in 2003 and in 2008. It was observed a reduction in the prevalence of milk consumption and beverages with added sugar, especially guaraná syrup‑based bever‑ ages. Individually, soda were beverages with the greatest contribution for the mean daily energy intake. It was notorious that the change of habits in the consumption of those bev‑ erages, which in 2003, were more frequently consumed on weekends, and, in 2008, they started being as common during weekdays and on weekends.
The prevalence of milk consumption (94%) in Niterói was higher than the frequency of 78.6% observed for adolescents in the Federal District evaluated in a cross‑sectional study for the application of the questionnaire of food consumption frequency14. The mean daily
milk intake observed for adolescents in Niterói (158 mL) was similar to the mean estimated for Brazilian adolescents in the National Food Survey 2008‑200912. The indings of this
study regarding milk consumption are comparable to the ones observed by Nielsen et al.24
for adolescents in elementary school and high school who showed reduction in their milk consumption over a period of 5 years. The reduction in milk consumption is concerning, once that, during adolescence, there is a peak in bone density, and the reduction of calcium intake may afect bone health in early life25.
The mean consumption of soda among adolescents in Niterói was comparable to the one observed by Carmo et al.26 among students of the city of Piracicaba, São Paulo (230 mL/day).
The National Student Health Survey, carried out in 2009, also showed that adolescents often consume soda, once that 37.2% of the students investigated reported having had soda in 5 or more days during the week prior to the investigation27. Similarly to what was observed
in this study, a study carried out with American adolescents showed that soda contributed with 67% of the calories from beverages with added sugar28.
In studies with American adolescents, the increased consumption of soda was associated with the reduction of milk and dairy products29. The same way, it is possible that, among
adolescents in Niterói, the increased consumption of beverages with added sugar may have contributed to for the reduction of milk consumption. The increased consumption of bev‑ erages with added sugar has been associated with an impairment in the quality of the diet of adolescents30, with the onset of overweight and obesity10 and with type 2 diabetes among
adults31. The association between the consumption of beverages with added sugar and the
increase in obesity has been attributed to lower satiety provided by liquid foods in relation to solid ones, owing to the activation of satiety mechanisms32, and to the incomplete poten‑
tial for energy intake, which may contribute to the increased caloric intake and weigh gain33.
These results are disturbing, once that, the sooner the contact with alcohol, the higher the chances of its excessive intake and of alcohol dependency throughout life36.
The use of food records data described according to the days of the week allowed the evaluation and variation of consumption habits of beverages according to this important source of variability of food consumption37.This kind of analysis allows us to raise hypoth‑
esis about the main inluences on the consumption habits. These analyses are built based on the premise the data of a day in the food entry diary provide reliable information for populational means38.
This study revealed that the prevalence of consumption of beverages with added sugar, in general, and speciically soft drinks and guaraná syrup‑based beverages increased for weekdays, but they do not change on weekends, which leads us to think that this change may be related to school routine. However, when evaluating the mean beverage intake volume, it was noticed that, on the weekend, the adolescents would have, on average, a volume 60% higher of beverages with added sugar in comparison to weekdays. This diference may represent an increase of 3,000 kcal over an year, which may result in a positive imbalance of energy and possible weight gain.
Studies that evaluated the food consumption on weekdays also have shown similar results to the ones in this study, once that they observe higher ingestion of soft drinks and other beverages with added sugar, alcohol and lower intake of whole grain foods and, as a consequence, more energy and sugar on weekends39,40. This pattern of diferentiated con‑
sumption between weekdays and weekends may be related to a more forgiving behavior during weekends, once there is less concern for schedules and daily routine obligations41.
The high proportion of nonresponse for the data of food consumption could be con‑ sidered as a possible limitation of this study; however, there were no signiicant diferences regarding gender, age range, and weight status among the participants of the overall studies and those included in the present analysis. Besides, since the sample of at least 433 adoles‑ cents in each group, it is possible to estimate diferences in the consumption of beverages of 8.3% points, with conidence interval of 95% and power of 80%42. Thus, it is assumed
that the nonresponse did not introduce bias to the results observed.
The limitations inherent to the method of food record, such as the need of intense cooperation by the participants, could lead to losses in the quality of the food consump‑ tion data. During the collection of the data, there were developed procedures in order to ensure the quality of the data, once that the food records are thoroughly reviewed by trained nutritionists who would clarify notes that could generate doubts, such as incomplete or incomprehensible data; additionally, there were criteria adopted for the critics of the data with the identiication of implausible energy intake23.
A strong point of this study is the representativeness of the samples investigated. Using the same sample design, in 2003 and in 2008, there were selected probability samples of ado‑ lescents enrolled between the ifth grade of Elementary School and the third year of High School in public schools in Niterói. It is considered, therefore, that the results presents may be generalized for this group of the population.
the changes of speciic aspects of the population43. Thus, this study has the merit of focus‑
ing changes in the consumption of beverages by adolescents over time, a little privileged area of research in the country.
This analysis had the merit of evaluating the variations of beverage consumption in the period from 2003 to 2008, which was characterized by important changes in the social and economic situations of the country, which afected mainly the most disadvantaged groups economically44,45 as is the case of the students of public schools evaluated, which experienced
increased power of purchase, which would explain, at least in parts, the increased consump‑ tion of processed beverages, especially, soft drinks and guaraná syrup‑based beverages.
The indings of this study are consistent with the typical characteristics of the process, which has been known as nutritional transition, reported in various parts of the world46,47
and which has also been observed in Brazil over the last decades14,48,49. This process is charac‑
terized by modiications in the diet and in the pattern of physical activity, which contribute for the increased rates of obesity and noncommunicable chronic diseases related with nutri‑ tion. Among these changes, we highlight the increase of beverages with added sugar, whose efect over health has been reported in diferent contexts6,33,31.
CONCLUSION
The main changes in the proile of beverage consumption among adolescents in Niterói in the irst decade of the 21st century were the trend for the reduction of milk consump‑
tion and the increase in the consumption of processed and alcoholic beverages. It has also highlighted the displacement of the consumption of soda to weekdays and the increased consumption of guaraná syrup‑based beverages.
This particular aspect of food consumption among adolescents, changes along time, have been little studies in Brazil, and the results presented contribute to support initiatives aimed at encouraging healthy food habits in this age group, which should include the con‑ sumption of beverages as one of the targets of attention.
1. Colucci ACA, Cesar CLG, Marchioni DML, Fisberg RM. Relação entre o consumo de açúcares de adição e a adequação da dieta de adolescentes residentes no município de São Paulo. Rev Nutr 2011; 24(2): 219‑31. 2. Alcântara Neto OD, Silva RC, Assis AM, Pinto EJ. Factors associated with dyslipidemia in children and adolescents enrolled in public schools of Salvador, Bahia. Rev Bras Epidemiol 2012; 15(2): 335‑45. 3. Cardoso Chaves O, Franceschini SC, Machado RRS,
Ferreira RSAL, Garçon FC, Priore SE. Anthropometric and biochemical parameters in adolescents and their
relationship with eating habits and household food availability. Nutr Hosp 2013; 28(4): 1352‑6.
4. Pinto SL, Silva RC, Priore SE, Assis AM, Pinto EJ. Prevalence of pre‑hypertension and arterial hypertension and evaluation of associated factors in children and adolescents in public schools in Salvador, Bahia State, Brazil. Cad Saúde Pública 2011; 27(6): 1065‑75.
5. Cassady BA, Considine RV, Mattes RD. Beverage consumption, appetite, and energy intake: what did you expect? Am J Clin Nutr 2012; 95(3): 587‑93.
6. Malik VS, Schulze MB, Hu FB. Intake of sugar‑sweetened beverages and weight gain: a systematic review. Am J Clin Nutr 2006; 84(2): 274‑88.
7. Frary CD, Johnson RK, Wang MQ. Children and adolescents’ choices of foods and beverages high in added sugars are associated with intakes of key nutrients and food groups. J Adolesc Health 2004; 34(1): 56‑63.
8. Fiorito LM, Marini M, Mitchell DC, Smiciklas‑Wright H, Birch LL. Girls’ early sweetened carbonated beverage intake predicts diferent patterns of beverage and nutrient intake across childhood and adolescence. J Am Diet Assoc 2010; 110(4): 543‑50.
9. Dufey KJ, Gordon‑Larsen P, Stefen LM, Jacobs Junior DR, Popkin BM. Drinking caloric beverages increases the risk of adverse cardiometabolic outcomes in the Coronary Artery Risk Development in Young Adults (CARDIA) Study. Am J Clin Nutr 2010; 92(4): 954‑9. 10. Jia M, Wang C, Zhang Y, Zheng Y, Zhang L, Huang Y,
et al. Sugary beverage intakes and obesity prevalence among junior high school students in Beijing: a cross‑sectional research on SSBs intake. Asia Pac J Clin Nutr 2012; 21(3): 425‑30.
11. Instituto Brasileiro de Geograia e Estatística. Pesquisa Nacional de Saúde do Escolar – PENSE 2012. Rio de Janeiro: IBGE; 2012. Disponível em: http://www.ibge. gov.br/home/estatistica/populacao/pense/2012/ (Acessado em 25 de setembro de 2015).
12. Instituto Brasileiro de Geograia e Estatística. Pesquisa de Orçamentos Familiares POF 2008‑2009. Análise do Consumo Alimentar Pessoal no Brasil. Rio de Janeiro: IBGE; 2011. Disponível em: http://www.ibge.gov. br/home/estatistica/populacao/condicaodevida/ pof/2008_2009_analise_consumo/ (Acessado em 25 de setembro de 2015).
13. Pereira RA, Dufey KJ, Sichieri R, Popkin BM. Sources of excessive saturated fat, trans fat and sugar consumption in Brazil: an analysis of the irst Brazilian nationwide individual dietary survey. Public Health Nutr 2014 ;17(1): 113‑21. 14. Levy RB, Castro IRR, Cardoso LO, Tavares LF, Sardinha
LMV, Gomes FS, et al. Consumo e comportamento alimentar entre adolescentes brasileiros: Pesquisa Nacional de Saúde do Escolar (PeNSE), 2009. Ciênc Saúde Colet 2010; 15(Suppl 2): S3085‑97.
15. Barquera S, Hernandez‑Barrera L, Tolentino ML, Espinosa J, Ng SW, Rivera JA, et al. Energy intake from beverages is increasing among Mexican adolescents and adults. J Nutr 2008; 138(12): 2454‑61.
16. Nielsen SJ, Popkin BM. Changes in beverage intake between 1977 and 2001. Am J Prev Med 2004; 27(3): 205‑10.
17. Alvarez MM, Vieira AC, Sichieri R, Veiga GV. Prevalence of metabolic syndrome and of its specifc components among adolescents from Niterói City, Rio de Janeiro State, Brazil. Arq Bras Endocrinol Metabol 2011; 55(2): 164‑70. 18. H a b i c h t J P. E s t a n d a r t i z a c i ó n d e m é t o d o s
epidemiológicos Ccuantitativos sobre el terreno. Bol Oicina Sanit Panam 1974; 76(5): 375‑84. 19. Onis M, Onyango AW, Borghi E, Syyan A, Nishida C,
Siekmann J. Development of a WHO growth reference for school‑aged children and adolescents. Bull World Health Organ 2007; 85(9): 660‑7.
20. Núcleo de Estudos e Pesquisas em Alimentação, Universidade de Campinas. Tabela Brasileira de Composição de Alimentos TACO. 4 ed. Campinas: NEPA/UNICAMP; 2011.
21. Philippi ST. Tabela de composição química de alimentos: suporte para decisão nutricional. Brasília: ANVISA; 2001. 22. Pinheiro ABV, Lacerda EMA, Benzecry EH, Gomes
MCS, Costa VM. Tabela para avaliação de consumo em medidas caseiras. 5 ed. São Paulo: Atheneu; 2004. 23. Andrade RG, Pereira RA, Sichieri R. Consumo alimentar de adolescentes com e sem sobrepeso do Município do Rio de Janeiro. Cad Saúde Pública 2003; 19(5): 1485‑95. 24. Nielsen MC, Neumark‑Sztainer D, Hannan PJ, Story M. Five‑year longitudinal and secular shifts in adolescent beverage intake: indings from project EAT (Eating Among Teens)‑II. J Am Diet Assoc 2009; 109(2): 308‑12. 25. Abreu S, Santos R, Moreira C, Santos PC, Vale S,
Soares‑Miranda L, et al. Relationship of milk intake and physical activity to abdominal obesity among adolescents. Pediatr Obes 2014; 9(1): 71‑80. 26. Carmo MB, Toral N, Silva MV, Slater B. Consumo de
doces, refrigerantes e bebidas com adição de açúcar entre adolescentes da rede pública de ensino de Piracicaba, São Paulo. Rev Bras Epidemiol 2006; 9(1): 121‑30. 27. Instituto Brasileiro de Geograia e Estatística. Pesquisa
Nacional de saúde do Escolar. Rio de Janeiro: IBGE; 2009. Disponível em: http://www.ibge.gov.br/home/ estatistica/populacao/pense/ (Acessado em 25 de setembro de 2015).
28. Wang YC, Bleich SN, Gortmaker SL. Increasing caloric contribution from sugar‑sweetened beverages and 100% fruit juices among US children and adolescents, 1988‑2004. Pediatrics 2008; 121(6): e1604‑14. 29. Cavadini C, Siega‑Riz AM, Popkin BM. US adolescent
food intake trends from 1965 to 1996. Arch Dis Child 2000; 83(18): 18‑24.
31. Wang ML, Lemon SC, Olendzki B, Rosal MC. Beverage‑consumption patterns and associations with metabolic risk factors among low‑income Latinos with uncontrolled type 2 diabetes. J Acad Nutr Diet 2013; 113(12): 1695‑703.
32. Di Meglio DP, Mattes RD. Liquid versus solid carbohydrate: effects on food intake and body weight. Int J Obes Relat Metab Disord 2000; 24(6): 794‑800.
33. Vartanian LR, Schwartz MB, Brownell KD. Efects of soft drink consumption on nutrition and health: a systematic review and meta‑analysis. Am J Public Health 2007; 97(4): 667‑75.
34. Carlini EA (supervisor). II Levantamento domiciliar sobre o uso de drogas psicotrópicas no Brasil: estudo envolvendo as 108 maiores cidades do país, 2005. Brasília: Secretaria Nacional Antidrogas; 2007. 35. World Health Organization. Global Status Report on
Alcohol 2004. Geneva: World Health Organization; 2004. 36. Caetano R, Babor TF. Diagnosis of alcohol dependence in epidemiological surveys: an epidemic of youthful alcohol dependence or a case of measurement error? Addiction 2006; 101(Suppl 1): S111‑4.
37. Beaton GH, Milner J, McGuire V, Feather TE, Little JA. Source of variance in 24‑hour dietary recall data: implications for nutrition study design and interpretation: carbohydrate sources, vitamins, and minerals. Am J Clin Nutr 1983; 37(6): 986‑95.
38. Dodd KW, Guenther PM, Freedman LS, Subar AF, Kipnis V, Midthune D, et al. Statistical methods for estimating usual intake of nutrients and foods: a review of the theory. J Am Diet Assoc 2006; 106(10): 1640‑50. 39. Haines PS, Hama MY, Guilkey DK, Popkin BM.
Weekend eating in the United States is linked with
greater energy, fat, and alcohol intake. Obes Res 2003; 11(8): 945‑9.
40. Rothausen BW, Matthiessen J, Hoppe C, Brockhof PB, Andersen LF, Tetens I. Differences in Danish children’s diet quality on weekdays v. weekend days. Public Health Nutr 2012; 15(9): 1653‑60.
41. Collaço JHL. Um olhar antropológico sobre o hábito de comer fora. Campos 2003; 4: 171‑94.
42. Lwanga SK, Lemeshow S. Sample size determination in health studies: a practical manual. Geneva: World Health Organization; 1991.
43. Bynner J. Panel study. In: Jupp J. The SAGE dictionary of social research methods. Londres: Sage Publications; 2006. p. 211‑12.
44. Brasil. Economia Brasileira em perspectiva. Brasília: Ministério da Fazenda; 2010.
45. Silva MOS. Pobreza, desigualdade e políticas públicas: caracterizando e problematizando a realidade brasileira. Rev Katál 2010; 13(2): 155‑63.
46. Popkin BM. The nutrition transition and obesity in the developing world. J Nutr 2001; 131(Suppl 3): 871S‑3S. 47. Wang Y, Monteiro C, Popkin BM. Trends of obesity
and underweight in older children and adolescents in the United States, Brazil, China, and Russia. Am J Clin Nutr 2002; 75(6): 971‑7.
48. Guimarães LV, Barros MBA. As diferenças de estado nutricional em pré‑escolares de rede pública e a transição nutricional. J Pediatr 2001; 77(5): 381‑6. 49. Kac G, Velásquez‑Meléndez G. A transição nutricional
e a epidemiologia da obesidade na América Latina. Cad Saúde Pública 2003; 19(Suppl 1): S4‑5.
Received on: 03/17/2015