Overall and Leisure-Time Physical Activity Among Brazilian
Adults: National Survey Based on the Global Physical
Activity Questionnaire
Inácio Crochemore M. da Silva, Grégore I. Mielke, Andréa D. Bertoldi, Paulo Sergio Dourado Arrais, Vera Lucia Luiza, Sotero Serrate Mengue, Pedro C. Hallal, and PNAUM Working Group
Background:To describe overall physical activity prevalence measured by the Global Physical Activity Questionnaire as well as inequalities in leisure-time physical activity among Brazilian adults (15 y and older).Methods:Data from the Brazilian Survey on Medicine Access, Utilization, and Rational Use of Medicines were analyzed. The study was carried out between September 2013 and February 2014. Physical activity was measured through Global Physical Activity Questionnaire and classified according to the recommendations of the World Health Organization. Additional analysis determined the contribution of each physical activity domain to the total amount of physical activity. Inequalities in terms of sex, age, and socioeconomic position were explored. Results: About one-third of the participants (37.1%; 95% confidence interval, 35.5–38.8) were physically inactive. Work-based activities were responsible for 75.7% of the overall physical activity. The prevalence of participants achieving physical activity guidelines considering only leisure-time activities was 17.8% (95% confidence interval, 16.7–19.2). Females and older participants were less active than their counterparts for both overall and leisure-time physical activity; socioeconomic status was positively associated to leisure-time physical activity.Conclusions:Major overall physical activity is attributed to work-related physical activity. Leisure-time physical activity, a key domain for public health, presents important gender and socioeconomic inequalities.
Keywords:GPAQ, national prevalence, inequalities
Over 5 million deaths per year are attributable to physical inactivity, which is responsible for 9% of all-cause mortality.1
Strategies to promote physical activity have been implemented in different settings, and there is currently a better understanding on the correlates of physical activity at individual and population levels. Although health benefits of physical activity are well established, few changes in physical activity have been identified at population level.2In this context, surveillance is an essential tool
to identify the magnitude and trends of physical inactivity within and among countries.
A survey in 2013 using a nonstandardized questionnaire found that 46.0% of the Brazilian adults were physically inactive.3,4
Furthermore, a phone surveillance system has been assessing physical activity prevalence in all the state capitals since 2006, and overall physical activity levels seem to be stable with preva-lence of about 30%, according to the current guidelines (at least 150 min of moderate to vigorous intensity physical activity per week).5 In terms of domains, although work-related physical
activity tends to be decreasing, leisure-time physical activity seems to be slightly increasing overtime.6
Despite the fact that Brazil has been improving the quality of its surveillance systems, it is quite difficult to compare Brazilian estimates with those from other countries. National surveys have used nonstandardized instruments other than the worldwide used International Physical Activity Questionnaire or Global Physical Activity Questionnaire (GPAQ).4–6 World Health Organization
(WHO) has adopted and recommended the use of the GPAQ,7,8
which is being used in the STEPwise approach (http://www.who. int/chp/steps) for physical activity surveillance.9 Although some
local surveys used International Physical Activity Questionnaire in Brazil,10–13there are no national studies describing the prevalence
of physical activity using GPAQ.
The aim of this study was to describe overall and leisure-time physical activity using GPAQ in a nationally representative sample of Brazilian adults. We also assessed the contribution from differ-ent domains of practice for overall levels of physical activity, as well as socioeconomic and gender inequalities in leisure-time physical activity.
Methods
The Brazilian Survey on Medicine Access, Utilization, and Ratio-nal Use of Medicines is a natioRatio-nal representative household-based study carried out in urban areas by a research group from 11 © 2018 The Authors. Published by Human Kinetics, Inc. This is an Open Access
article distributed under the terms of the Creative Commons Attribution License CC BY 4.0, which permits unrestricted noncommercial and commercial use, distribu-tion, and reproduction in any medium, provided the original work is properly cited, the new use includes a link to the license, and any changes are indicated. Seehttps:// creativecommons.org/licenses/by/4.0/. This license does not cover any third-party material that may appear with permission in the article.
da Silva, Mielke, Bertoldi, and Hallal are with the Postgraduate Program in Epidemiology, Federal University of Pelotas, Pelotas, Brazil. Mielke is also with the Centre for Research on Exercise, Physical Activity and Health, School of Human Movement and Nutrition Sciences, The University of Queensland, Brisbane, Australia. Arrais is with the Postgraduate Program in Pharmaceutical Science, Dept of Pharmacy, Federal University of Ceará, Fortaleza, Brazil. Luiza is with the National School of Public Health, Oswaldo Cruz Foundation, Rio de Janeiro, Brazil. Mengue is with the Postgraduate Program in Epidemiology, School of Medicine, Federal University of Rio Grande do Sul, Porto Alegre, Brazil. On behalf of PNAUM Working Group: Mareni Rocha Farias, Maria Auxiliadora Oliveira, Noemia Urruth Leão Tavares, Tatiane da Silva Dal Pizzol, and Luiz Roberto Ramos. da Silva ([email protected]) is corresponding author.
universities and funded by the Brazilian Ministry of Health. The main objective of this national survey was to evaluate access and rational use of medicines in the Brazilian population. However, other health outcomes were also assessed, such as health service access; chronic diseases; and their risk factors (tobacco, alcohol, and physical activity). Brazil is the largest country in South America (with the total surface area of 8,515,767.049 km2), where more than 80% of the population is currently living in urban areas. The gross domestic product was 11,159 US dollars in 2015, and it is a country marked by huge social inequalities (Gini index = 0.53). The sampling process was drawn to achieve a representative-ness of the Brazilians living in urban areas. The sample included 8 demographic domains (age 0–4, both genders; age 5–19, both genders; age 20–39, female; age 20–39, male; age 40–59, female; age 40–59, male; age 60 or older, female; age 60 or older, male), for which the results can be extrapolated.14 Demographic domains
were replicated to each country region (south, southeast, midwest, northeast, and north), where the sampling process was performed by clusters in 3 stages. Initially, primary sampling units (cities) were randomly selected with probability proportional to size strati-fied by federal states. In each city, 2 urban clusters were randomly selected with probability proportional to size, providing 120 clus-ters by Brazilian region. Households were systematically sampled according to demographic density of clusters. Finally, all residents (children, adolescents, adults, and elderly) of each household included were considered eligible to participate in the study. Further details on methodological procedures are published elsewhere.14
Thefinal sample included 576 urban clusters; 20,404 house-holds; and a total of 41,433 participants interviewed in the 5 Brazilian regions. Households response rates varied between 42% and 59%, and individuals’response rates varied between 91% and 95% in the 5 country regions. To reduce potential bias from the household low-response rate, sample weights were calculated according to age and gender per region. Thereafter, the weighted sample distribution is demographic and socioeconomic represen-tative of the Brazilian population and highly comparable with the Brazilian Health Survey carried out in 2012/2013.14,15The present
analyses are based on 15 years and older adults.
Data collection was performed by a trained team using face-to-face interviews and carried out from September 2013 to February 2014. Self-reported physical activity was measured by the GPAQ. Briefly, GPAQ measures minutes spent in moderate- and vigorous-intensity physical activity in a typical week in 3 domains: work (labor and household)-related activities, leisure-time activities, and transportation. This questionnaire was submitted to a reliability study in 9 countries, including Brazil, and showed moderate to high reliability (κ= .67–.73; Spearman’sρ= .67–.81).8Physical activity was analyzed according to a guide from WHO.3 Minutes spent
in each category were used to calculate a metabolic equi-valent, which was expressed in metabolic equivalent minutes per week. In this paper, the following outcomes were analyzed: (1) Total physical inactivity defined as not meeting WHO’s recommendations on physical activity for health (ie, not engaging in at least 150 min of moderate-intensity activity per week or 75 min of vigorous-intensity activity per week; or an equivalent combination of moderate- and vigorous-intensity activity) and (2) Leisure-time physical activity defined as proportion of parti-cipants meeting WHO guidelines considering only physical activi-ty during leisure time.
All data analyses were carried out considering sample weight allowing extrapolation offindings to the larger population of urban residents. Initially, focusing on overall physical inactivity,
descriptive analyses estimating weighted prevalence and 95% con-fidence intervals (CIs) were carried out according to sex (male and female), age groups (15–24, 25–34, 35–44, 45–54, 55–64, and 65 y or older), years of formal schooling (0, 1–8, 9–11, and 12 or more years), and socioeconomic status (SES) based on an asset index, and the educational level of the head of household was categorized into 5 groups according to a standardized protocol from A (wealthiest) to E (poorest).16Categories A and B as well as D and E were merged due
to their distribution in the sample and to avoid small categories in the stratified analyses. Further, an additional analysis was conducted to determine the contribution of each domain and its respective intensity to total amount of physical activity. It was calculated considering total minutes per week in physical activity for each participant and minutes per week spent in specific domains and intensities. Finally, relative and absolute differences in leisure-time physical activity within and between groups were analyzed as follows: (1) relative difference in leisure-time physical activity between male and female according to age groups and (2) absolute differences in leisure-time physical activity between socioeconomic position according to age groups among males and females. Relative differences were analyzed through prevalence ratio between males and females, and absolute differences were analyzed graphically using“equiplot”method, which was developed by the International Center for Equity in Health (www.equidade.org). All analyses were conducted in Stata 12.0 (StataCorp LP, College Station, TX).
The Brazilian Survey on Medicine Access, Utilization, and Rational Use of Medicines Project was approved by the National Committee for Research Ethics (protocol number: 18947013. 6.0000.0008) and the Committee for Research Ethics of the Federal University of the Rio Grande do Sul (protocol number 19997). All individual information is confidential and interviews were carried out after participants signed an informed consent form.
Results
Thefinal sample was representative of Brazilian urban areas. There were 32,641 participants aged 15 years and older with available physical activity data. Physical inactivity estimates may be extrap-olated to more than 171 million of Brazilian adults living in urban areas.
Overall Physical Inactivity
Table1shows the prevalence of physical inactivity according to sociodemographic variables in the overall sample and stratified by sex. About one-third of the participants (37.1%; 95% CI, 35.5– 38.8) did not meet the current physical activity guidelines, and this prevalence was similar between males and females. The widest difference between sexes was observed (among 15–24 y, the female prevalence of physical inactivity was almost 40% higher than male prevalence in the same age group—42.0% in females vs 30.8% in males). Physical inactivity prevalence increased with age in both sexes and was negatively associated with years of schooling only among males. Differences in physical inactivity prevalence according to SES were observed only among females.
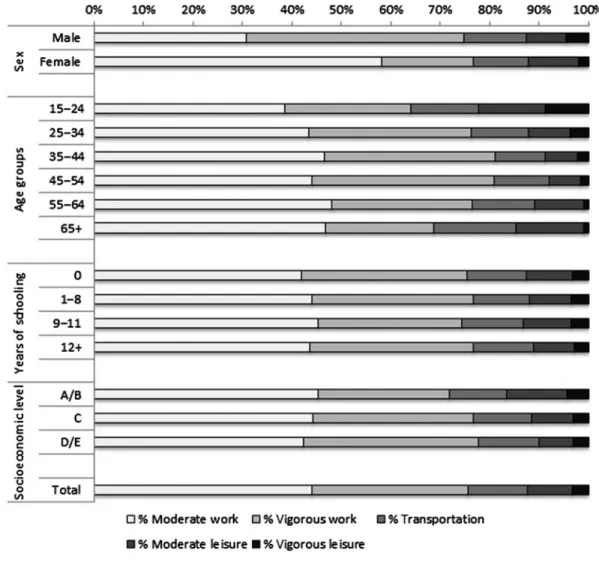
On average, participants spent 143 (95% CI, 129–157) minutes per week in leisure-time physical activity, 137 (95% CI, 127–147) minutes per week in transport-related physical activity, and 874 (95% CI, 821–927) minutes per week in work-based physical activity. The relative contribution of each domain and intensity to the total amount of minutes spent per week in physical activity is presented in Figure1. In the whole sample, work-based activities
were responsible for 75.7% of total time spent in physical activity (44.0% in moderate- and 31.6% in vigorous-intensity activities), followed by leisure (9.0% in moderate and 3.4% in vigorous) and by transport-related physical activity (12.9%). Important differences in terms of sociodemographic characteristics were observed between sex, age groups, and SES. The contribution of moderate work activities among females was almost twice as high in comparison with males (58.1% in females vs 30.8% in males). Among males, the contribution of work-based vigorous activities was 44.0%, whereas among females, this proportion was 18.7%. Furthermore, the contribution of time spent in vigorous leisure-time physical activity was 4.6% among males and 2.1% among females (Figure1).
There was a huge decrease in the contribution to overall physical activity of the time spent in vigorous leisure activities across age groups, especially between 15- to 24-years-old group (8.8%) and 25- to 34-years-old group (3.8%). The oldest group spent, on average, only 1% of the total time of physical activities performing vigorous-intensity activities at leisure time. Regarding SES, although total physical inactivity prevalence was similar between different groups, the contribution of vigorous work activ-ities was higher among the poorest group (35.4%), compared with the richest group (26.6%; Figure1).
Leisure-Time Physical Activity
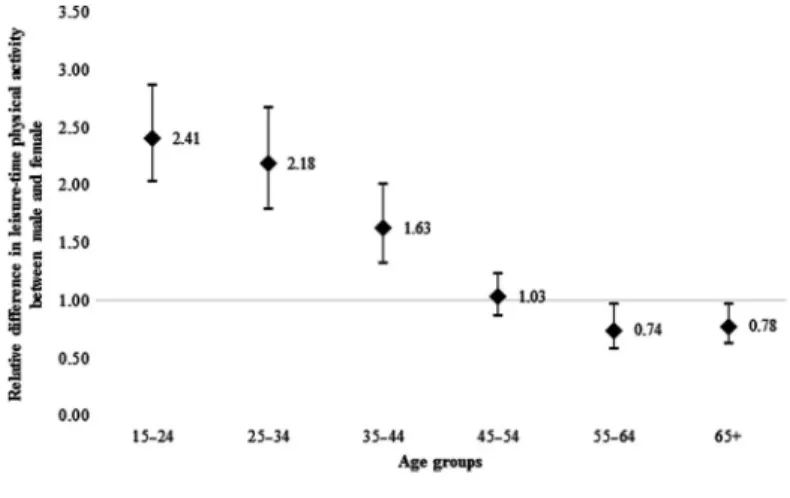
The prevalence of participants meeting physical activity guidelines considering only leisure time was 17.8% (95% CI, 16.7–19.2; data not presented in tables andfigures). Overall, leisure-time physical activity prevalence was twice as high among males compared with females and decreased with age (except among females with 55–64 y). Socioeconomic status was markedly and positively associated with leisure-time physical activity, although no associ-ation was found with years of schooling for both sexes (Figure2). The relative difference in leisure-time physical activity between
males and females was larger in younger groups (Figure3). In addition, males were more active than females until middle age (35–44 y). After 55 years, females were more active than males. Figure4shows differences in leisure-time physical activity in SES according to age groups and sex. The wealthiest participants were more active than the poorest ones in leisure time (P<.05), except among 15- to 24-years-old males. Among males, the most pronounced socioeconomic gradient occurred in participants be-tween 25 and 34 years old, whereas among females, there were no marked differences in the socioeconomic inequality according to age groups.
Discussion
The current analyses presented the first national representative physical activity prevalence based on GPAQ, the questionnaire recommended by WHO to increase comparability worldwide. Brazil plays an important role representing middle-income coun-tries regarding the availability of physical activity estimates. How-ever, despite the existence of a national health survey6and also a
surveillance system in the Brazilian capital cities,4,5up to this date
more comparable physical activity estimates were not available. Furthermore, these analyses presented a wide overview of socio-demographic correlates of physical activity and the contribution of different domains to this behavior. Focus was also given on the leisure-time domain, which might be considered a key dimension for public health interventions. Finally, several multiple stratifi ca-tions were performed to improve understanding of sociodemo-graphic inequalities of leisure-time physical activity prevalence.
About one-third of the Brazilian urban population did not reach physical activity guidelines. Pooled analyses of data from 122 countries, representing around 89% of the world’s popula-tion, found a prevalence of physical inactive of 31.1%.2Estimates
specifically from 3 lower–middle or high-income countries
Table 1 Prevalence of Physical Inactivity According to Sociodemographic
Characteristics Among Brazilian Adults, 2013–2014
Variables
Total sample Males Females
% (95% CI)a % (95% CI)a % (95% CI)a
Age groups, y
15–24 36.6 (33.9–39.4) 30.8 (27.0–34.8) 42.0 (38.6–45.5) 25–34 31.1 (28.6–37.7) 27.8 (24.0–31.9) 34.3 (31.5–37.3) 35–44 35.7 (33.1–38.4) 37.2 (33.6–41.0) 34.4 (31.6–37.2) 45–54 34.2 (31.8–36.6) 36.2 (32.9–39.7) 32.5 (29.8–35.3) 55–64 37.9 (35.8–40.1) 41.3 (38.2–44.5) 35.3 (32.5–38.2) 65 and older 55.2 (53.0–57.4) 54.5 (51.3–57.7) 55.6 (53.1–58.1) Years of schooling
0 39.2 (36.7–41.8) 40.4 (36.1–44.8) 38.2 (35.3–41.2) 1–8 37.0 (35.2–39.1) 35.4 (32.7–38.2) 38.4 (36.2–40.7) 9–11 37.0 (35.0–39.0) 35.2 (32.6–38.0) 38.5 (36.0–41.0) 12+ 35.4 (32.3–38.6) 32.8 (28.4–37.5) 37.7 (34.2–41.2) Socioeconomic position
A/B (wealthiest group) 35.0 (32.4–37.7) 33.3 (29.7–37.2) 36.5 (33.7–39.4) C 37.0 (35.1–38.9) 36.6 (34.3–39.0) 37.4 (35.2–39.5) D/E (poorest group) 39.7 (37.0–42.5) 36.6 (32.6–40.7) 42.4 (39.6–45.2)
Abbreviation: CI, confidence interval. a
Weighted prevalence and 95% CI.
collecting physical inactivity using GPAQ have shown similar prevalence; about 30% of adults in Bangladesh, Vietnam, and Czech Republic did not reach WHO guidelines for physical activity.17–19However, pooled analysis among 22 African
coun-tries has identified only 20.9% of adults who did not reach the guidelines.20Overall physical inactivity was similar between sex,
increased according to the participant’s age, and did not present a clear pattern in terms of socioeconomic indicators (SES and schooling). These differences and similarities were already evi-denced in the literature,21 and their explanations are closely
related to hidden differences in specific physical activity domains and intensities.
Figure 2—Prevalence of leisure-time physical activity according to sociodemographic variable among Brazilian adults, 2013–2014.
Figure 1—Contribution of specific domains and intensities to the total amount of minutes per week spent in physical activity according to gender, age groups, schooling, and socioeconomic position among Brazilian adults, 2013–2014.
Work-based activities accounted for 3 quarters of total time spent in physical activity in Brazil, according to the present analyses. Dissimilarly, among African countries with comparable data, it was identified that transport-related physical activity was as important as work-based activities for the total contribution for overall physical activity.20 Transport-related physical activity
seems to be more influenced by a need than individual choices, particularly in low- and middle-income countries. Therefore, dif-ferences in between-countries on transport-related physical activity might be attributed to both differences in the quality of public transport services and access to private motorized transport.
Work-based physical activity was markedly lower among older higher SES when compared with their counterparts. Further-more, although the contribution of work-related physical activity is higher among poorer groups, the physical activity during leisure time is higher among richer, justifying the absence of association with SES when the overall physical activity is taken into account. This complex relationship between overall physical activity and SES, which varies across country income groupings, might repre-sent that changes in work-related technology have occurred par-tially in countries like Brazil, affecting differently poorest and richest groups.
Regardless of the fact that the largest contribution to overall physical activity is attributed to work-related activities, the leisure-time physical activity domain presents itself as the most important domain for public health purposes. It is the most appropriate domain to intervene and options should be equitable to respect individual’s choices. Thus, several analyses were carried out to provide information about which group should be focused on to close the gaps between population groups regarding physical activity. In the present analyses, there was a huge difference between males and females in leisure-time physical activity. In Brazil, despite evidence of a slight increase in leisure-time physical activity prevalence, the sex gap (difference between male and female) is not closing.6,12Even in countries where men are more
active than women due to work-based activities, men also seem to be much more active at leisure time.9Physical activity is a complex
behavior influenced by multiple factors, which are probably dif-ferent between sexes.22Cultural and environmental aspects might
act differently between males and females. The doubled daily work period (formal labor and domestic work) that most females from low- and middle-income countries are still submitted, less social support from relatives and friends,23and higher safety concerns
compared with males24,25are examples, which must be taken into
account to understand these estimates.
Moreover, the leisure-time analyses based on multiple strati-fication arise interesting research questions, which are still useful for future interventions. Why do women become more active than men when they get older? Are females only healthier than males or are there other cultural factors influencing this change? Why does leisure-time physical activity decrease abruptly among men older than 25–34 years, mainly among those richer? Is this related to family or work responsibilities? Physical activity correlates, theo-retically well established in the literature such as sex, age, and SES, might still provide a better understanding about their association with physical activity once analyzed carefully.
Different from other settings based on a high-income country pattern,21 socioeconomic measures (schooling vs SES based on
assets index) showed a different association with leisure-time physical activity in this study. There was no association between physical activity and years of schooling, although a positive relationship was found regarding SES. Although knowledge Figure 3—Relative difference (expressed by the prevalence ratio male/
female and its 95% confidence interval) in leisure-time physical activity between male and female according to age group among Brazilian adults, 2013–2014.
Figure 4 — Differences in leisure-time physical activity between socioeconomic position according to age groups among (A) males and (B) female among Brazilian adults, 2013–2014.
and/or information about physical activity benefits are widely available now for general population, which might explain part of the lack of association between schooling and physical activity, SES based on ownership of goods is probably closely related to resources availability, access to private places (gyms and sports courts) and also to more attractive public areas (which is unequally distributed in Brazil).26 In the present study, socioeconomic
in-equalities were markedly identified in all sexes and age groups (Figure 4). Wealthiest groups presented leisure-time physical activity prevalence about 10% points higher than the prevalence of poorest groups. These findings claim for public health inter-ventions focusing on those who have been left behind.
There are some caveats to interpret this study. First, it is a representative study of Brazilian urban areas, and our findings cannot be extrapolated to rural settings, which represent less than 20% of the Brazilian population and present different physical activity patterns, strictly based on labor physical activities.4
Sec-ond, the recommendation used to apply the operational definition is originally proposed for adults (18 y and older), and given that this sample included participants aged 15 years and older, our estimates might be overestimated in this age group. However, this approach has been extensively used in previous surveys.27 Finally,
self-reported information might overestimate individual physical activity practice, especially work-related physical activity. Never-theless, it provides important estimates at a population level, which are indeed more important than individual estimates. In addition, by evaluating physical activity by a questionnaire largely used, we are able to provide a wide overview from different domains of physical activity to improve comparability in the Brazilian physical activity data.
Conclusion
About one-third of the Brazilian population is not reaching the public health guidelines for physical activity. Major overall physi-cal activity was attributed to work-related physiphysi-cal activity, which is concerning for the near future due to the worldwide trend of decreasing the total amount of physical activity in labor settings. Finally, leisure-time physical activity presents important gender and socioeconomic inequalities in Brazil, which must be addressed by public health initiatives toward a more equitable access to physical activity.
References
1. Lee IM, Shiroma EJ, Lobelo F, Puska P, Blair SN, Katzmarzyk PT. Effect of physical inactivity on major non-communicable diseases worldwide: an analysis of burden of disease and life expectancy. Lancet. 2012;380(9838):219–229.PubMeddoi:10.1016/S0140-6736 (12)61031-9
2. Hallal PC, Andersen LB, Bull FC, Guthold R, Haskell W, Ekelund U. Global physical activity levels: surveillance progress, pitfalls, and prospects.Lancet. 2012;380(9838):247–257.PubMeddoi:10.1016/ S0140-6736(12)60646-1
3. World Health Organization. Global Recommendations on Physical Activity for Health. Geneva, Switzerland: World Health Organization; 2010.
4. Mielke GI, Hallal PC, Rodrigues GBA, Szwarcwald CL, Santos FV, Malta DC. Physical activity and television viewing among Brazilian adults: National Health Survey 2013.Epidemiol Serv Saúde. 2015; 24(2):277–286. doi:10.5123/S1679-49742015000200010
5. Malta DC, Andrade SSA, Santos MAS, Rodrigues GBA, Mielke GI. Trends of physical activity indicators in adults: State Capitals of Brazil 2006–2013.Braz J Phys Act Health. 2015;20(2):141–151. 6. Mielke GI, Hallal PC, Malta DC, Lee IM. Time trends of physical
activity and television viewing time in Brazil: 2006–2012.Int J Behav Nutr Phys Act. 2014;11:101. PubMed doi: 10.1186/s12966-014-0101-4
7. Armstrong T, Bull F. Development of the WHO Global Physical Activity Questionnaire (GPAQ). Public Health. 2006;14:66–70. doi:10.1007/s10389-006-0024-x
8. Bull FC, Maslin TS, Armstrong T. Global Physical Activity Ques-tionnaire (GPAQ): nine country reliability and validity study.J Phys Act Health. 2009;6(6):790–804. doi:10.1123/jpah.6.6.790
9. World Health Organization. Chronic diseases and health promotion: STEPwise approach to surveillance. www.who.int/chp/steps. Ac-cessed April 15, 2016.
10. Bauman A, Bull F, Chey T, et al. The international prevalence study on physical activity: results from 20 countries.Int J Behav Nutr Phys Act. 2009;6:21.PubMeddoi:10.1186/1479-5868-6-21
11. Hallal PC, Cordeira K, Knuth AG, Mielke GI, Victora CG. Ten-year trends in total physical activity practice in Brazilian adults: 2002– 2012. J Phys Act Health. 2014;11(8):1525–1530.PubMeddoi:10. 1123/jpah.2013-0031
12. da Silva IC, Knuth AG, Mielke GI, Azevedo MR, Goncalves H, Hallal PC. Trends in leisure-time physical activity in a southern Brazilian city: 2003–2010. J Phys Act Health. 2014;11(7):1313–
1317. doi:10.1123/jpah.2012-0460
13. Matsudo VK, Matsudo SM, Araujo TL, Andrade DR, Oliveira LC, Hallal PC. Time trends in physical activity in the state of Sao Paulo, Brazil: 2002–2008.Med Sci Sports Exerc. 2010;42(12):2231–2236.
PubMeddoi:10.1249/MSS.0b013e3181e1fe8e
14. Mengue SS, Bertoldi AD, Boing AC, et al. National Survey on Access, Use and Promotion of Rational Use of Medicines (PNAUM): household survey component methods. Braz J Public Health. 2016;50(suppl 2):4s.
15. Damasceno GN, Szwarcwald Cl, Malta DC, et al. The Development of the National Health Survey in Brazil, 2013.Epidemiol Serv Saúde. 2015;24(2):197–206.
16. Brazilian Association of Research Companies. CCEB 2010 adoption—Brazilian Economic Classification Criteria. São Paulo, Brazil: Brazilian Association of Research Companies; 2010.www. abep.org.
17. Moniruzzaman M, Mostafa Zaman M, Islalm MS, Ahasan HA, Kabir H, Yasmin R. Physical activity levels in Bangladeshi adults: results from STEPS survey 2010. Public Health. 2016;137:131–138.
PubMeddoi:10.1016/j.puhe.2016.02.028
18. Bui TV, Blizzard CL, Luong KN, et al. Physical activity in Vietnam: estimates and measurement issues. PLoS ONE. 2015;10(10): e0140941.PubMeddoi:10.1371/journal.pone.0140941
19. Hamrik Z, Sigmundova D, Kalman M, Pavelka J, Sigmund E. Physical activity and sedentary behaviour in Czech adults: results from the GPAQ study.Eur J Sport Sci. 2014;14(2):193–198.PubMed
doi:10.1080/17461391.2013.822565
20. Guthold R, Louazani SA, Riley LM, et al. Physical activity in 22 African countries: results from the World Health Organization STEPwise approach to chronic disease risk factor surveillance.Am J Prev Med. 2011;41(1):52–60.PubMeddoi:10.1016/j.amepre.2011. 03.008
21. Bauman AE, Reis RS, Sallis JF, Wells JC, Loos RJ, Martin BW. Correlates of physical activity: why are some people physically active and others not?Lancet. 2012;380(9838):258–271.PubMeddoi:10. 1016/S0140-6736(12)60735-1
22. Brown WJ, Mielke GI, Kolbe-Alexander TL. Gender equality in sport for improved public health. Lancet. 2016;388(10051):1257–1258.
PubMeddoi:10.1016/S0140-6736(16)30881-9
23. da Silva IC, Goncalves H, Azevedo MR. Leisure-time physical activity and social support among Brazilian adults.J Phys Act Health. 2013;10(6):871–879.PubMeddoi:10.1123/jpah.10.6.871
24. Van Dyck D, Veitch J, De Bourdeaudhuij I, Thornton L, Ball K. Environmental perceptions as mediators of the relationship between the objective built environment and walking among socio-economi-cally disadvantaged women.Int J Behav Nutr Phys Act. 2013;10:108.
PubMeddoi:10.1186/1479-5868-10-108
25. Osuji T, Lovegreen SL, Elliott M, Brownson RC. Barriers to physical activity among women in the rural midwest.Women Health. 2006; 44(1):41–55.PubMeddoi:10.1300/J013v44n01_03
26. da Silva ICM, Mielke GI, Nunes BP, et al. Public open spaces in Pelotas (Brazil): distribution, quality and suitability for physical activity practice. Braz J Phys Act Health. 2015;20(1): 82–92.
27. Pavey TG, Peeters G, Bauman AE, Brown WJ. Does vigorous physical activity provide additional benefits beyond those of moder-ate?Med Sci Sports Exerc. 2013;45(10):1948–1955.PubMeddoi:10. 1249/MSS.0b013e3182940b91