Adv. Sci. Res., 12, 1–4, 2015 www.adv-sci-res.net/12/1/2015/ doi:10.5194/asr-12-1-2015
© Author(s) 2015. CC Attribution 3.0 License.
14th
EMS
Ann
ual
Meeting
&
10th
European
Conf
erence
on
Applied
Climatology
(ECA
C)
Yearly changes in surface solar radiation
in New Caledonia
P. Blanc1, C. Coulaud2, and L. Wald1
1MINES ParisTech, PSL Research University, Centre Observation, Impacts, Energy, BP 204,
06905 Sophia Antipolis CEDEX, France 2ADEME, Valbonne, France
Correspondence to:L. Wald (lucien.wald@mines-paristech.fr)
Received: 27 November 2014 – Accepted: 11 February 2015 – Published: 17 February 2015
Abstract. New Caledonia experiences a decrease in surface solar irradiation since 2004. It is of order of 4 % of the mean yearly irradiation over the 10 years period: 2004–2013, and amounts to−9 W m−2. The preeminent roles of the changes in cloud cover and to a lesser extent, those in aerosol optical depth on the decrease in yearly irradiation are evidenced. The study highlights the role of data sets offering a worldwide coverage in under-standing changes in solar radiation and planning large solar energy plants such as the ICOADS (International Comprehensive Ocean-Atmosphere Data Set) of the NOAA and MACC (Monitoring Atmosphere Composition and Climate) data sets combined with the McClear model.
1 Introduction
New Caledonia, a large island in tropical Pacific Ocean (Fig. 1), experiences a very sunny weather. Cloudiness is low and on average 60 % of the solar radiation available at the top of atmosphere reaches the ground. Hence, solar radiation is an option for energy production.
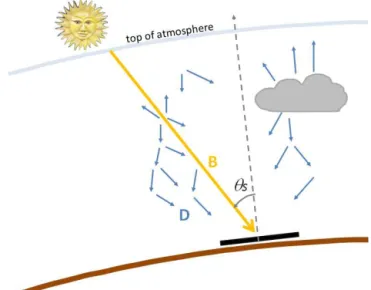
The solar radiation reaching the ground on a horizontal surface, known as the surface solar irradiance (SSI) is made of the direct component that is the radiation coming from the direction of the sun and the diffuse component that is the ra-diation coming from all other directions (Fig. 2). The sum of the direct and diffuse is called the global radiation. Of in-terest to concentrating solar technologies (CST) that concen-trate sun rays to produce electricity is the direct solar radia-tion received on a plane normal to the sun rays (DNI).
A preliminary study, not publicly available, has been per-formed to assess the potentials of electricity production by concentrating Fresnel mirrors using local measurements of DNI and other meteorological data. The yearly sum of DNI has been estimated at 2 MWh m−2at Noumea, the major city. If 190 000 m2 of mirrors were installed, they could produce 36 GWh per year. Coupled to a coal fired power station, they could save up to 19 kt of CO2 per year. A similar quantity
of energy per year would be produced by approximately the same number of PV panels.
This preliminary study has noted that the SSI is varying from years to years. Such variations have an impact on the electricity production and hence on investment and should be taken into account.
The present article deals with the changes of SSI with months and years from 1998 up to 2013 and discusses possi-ble causes.
2 Data
Measurements of global SSI and DNI were collected from Meteo-France for the stations of Koumac and Noumea (Fig. 1). Global SSI and DNI are measured at Koumac while Noumea provides global SSI only. The values delivered by Meteo-France are monthly irradiation, from 1998 to 2013. The clearness indexKT, also called atmospheric transmis-sivity or transmittance, is computed by dividing the observed monthly irradiation by the monthly irradiation received by a horizontal plane located at the top of atmosphere.KTallows to disentangling the seasonal variations of the atmosphere transparency from those due to the orbit of the Earth around the Sun.
2 P. Blanc et al.: Yearly changes in surface solar radiation in New Caledonia
Figure 1. Map of New Caledonia. Location of Noumea and Koumac where Meteo-France measures solar radiation. Source: Google Earth.
Re-analyses are another means to assess the SSI. They of-fer worldwide and multi-decadal coverage. Several authors (see a review in Boilley and Wald, 2015) have compared SSI estimated by re-analyses to coincident ground measure-ments. They found a tendency of a majority of reanalyses to overestimate the SSI. Reanalyses often predict clear sky con-ditions while actual concon-ditions are cloudy. This overestima-tion of occurrence of clear sky condioverestima-tions leads to an overes-timation of the SSI. The opposite is also true though less pro-nounced: actual clear sky conditions are predicted as cloudy. For these reasons, reanalyses are not used in this study.
Proper processing of satellite images is another means to assess the SSI. Several databases offer daily irradiation over the area under study, such as the NASA SSE data set available at http://eosweb.larc.nasa.gov/sse/. However, none of these data sets can be used here because they are not ap-propriate for this study like NASA SSE which is limited to the period 1983–2005, or they are not available freely such as the data sets from the 3Tier or GeoModel Solar companies.
The European-funded projects MACC (Monitoring Atmo-sphere Composition and Climate) have created a set of global aerosol properties together with physically consistent total column content in water vapour and ozone (Kaiser et al., 2012). These data are available on a grid of approximately 100 km every 3 h. Once collected from the MACC web site (http://www.gmes-atmosphere.eu), these data were interpo-lated in space and aggregated to yield monthly means of aerosol optical depth at 550 nm, and total column contents in water vapour and ozone for Koumac and Noumea, from 2004 to 2013. The McClear model (Lefèvre et al., 2013) uses the MACC data sets as inputs and provide monthly irradiation of global SSI and DNI that should be observed if the sky were clear i.e. cloud-free, from 2004 to 2013. These quantities are called clear-sky SSI and DNI.
As discussed above, cloud coverage from meteorologi-cal analyses is not very accurate. Since New Caledonia is
Figure 2.The direct componentBis the radiation that comes from the direction of the sun, indicated by the solar zenith angle θS. Global=directB+diffuseD. DNI is the direct for normal inci-dence.
an island of limited extension, it was thought that cloud coverage may be provided by the International Compre-hensive Ocean-Atmosphere Data Set (ICOADS). ICOADS is a global ocean marine meteorological and surface ocean dataset formed by merging many national and international data sources that contain measurements and visual obser-vations from ships (merchant, navy, research), moored and drifting buoys, coastal stations, and other marine platforms. Cloud coverage is available in okta on a grid of 2◦in size. The KNMI Climate Explorer (climexp.knmi.nl) offers access to these data and processing capabilities. Cloud coverage has been collected from this site as monthly values averaged over the oceanic region in the vicinity of New Caledonia defined by latitude ranging from−22 to−18◦, and longitude from 156 to 164◦.
The Pacific Ocean is subject to the El Niño South-ern Oscillation (ENSO) which is characterized by varia-tions in sea surface temperature in the eastern tropical part and in air surface pressure and cloudiness in the west-ern tropical part. El Niño is the warm oceanic phase in the eastern Pacific and is coupled with high surface air pressure in the western part. The cold oceanic phase, La Niña, in the eastern Pacific accompanies low surface air pressure in the western part. New Caledonia is concerned by the ENSO. The Oceanic Niño Index (ONI) is one of the indicators of the strength of the ENSO events. It is available each month as a running average over three months at http://www.cpc.ncep.noaa.gov/products/analysis_ monitoring/ensostuff/ensoyears.shtml. Since ENSO has an effect on cloudiness, the ONI has been included in the study to investigate its relationship with irradiation.
P. Blanc et al.: Yearly changes in surface solar radiation in New Caledonia 3
Table 1.Correlation coefficient between SSI orKTand other vari-ables on a monthly basis.
Monthly Clearness irradiation index KT
Clear sky SSI 0.94 0.41 Clear-skyKT 0.64 0.23 Cloud cover −0.29 −0.45
ONI −0.03 0.04
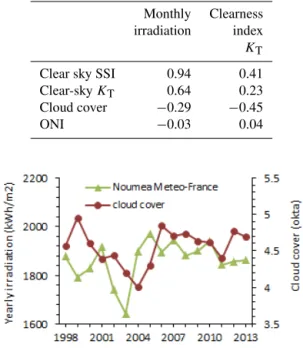
Figure 3. Yearly irradiation observed at Noumea and ICOADS-derived cloud cover from 1998 to 2013.
3 Results
Figure 3 exhibits the yearly SSI observed at Noumea from 1998 to 2013 as well as the cloud cover from ICOADS.
The SSI fluctuates from year to year and ranges between 1640 and 1970 kWh m−2. The relative change from one year to the previous one ranges from−5 to 7 %. These values are similar to those observed in many places around the world.
One would expect an anti-correlation between the SSI and the cloud cover. A decrease of the SSI from one year to an-other should correspond to an increase of the cloud cover and vice-versa. This is well observed here for the whole period with a few exceptions: transition 2002–2003, 2004–2005, 2010–2011, and 2011–2012. One may observe that the mag-nitude of year-to-year change in SSI does not correspond al-ways to the same magnitude of change in cloud cover. Other causes than cloud cover intervene in the change in SSI.
A very large correlation coefficient is found between the monthly SSI and the clear-sky SSI: 0.94 (Table 1). A smaller correlation was expected because of the influence of the cloud cover on the SSI. It is concluded that the seasonal changes on SSI due to changes in the Earth orbit during a year have a large influence on this correlation. This is illus-trated by the much less correlation coefficient: 0.23, observed betweenKTand the clear-skyKT. This seasonal influence is seen also in the correlation coefficient between the SSI and the cloud cover which is small:−0.29. If the seasonal effects are removed by analysingKTinstead of the SSI, the correla-tion is more pronounced:−0.45. The larger the cloud cover,
Figure 4.YearlyKTobserved at Noumea, clear-skyKTfrom Mc-Clear multiplied by 0.75 and ICOADS-derived cloud cover from 2004 to 2013.
Figure 5. Yearly clear-sky KT at Noumea from McClear and MACC aerosol optical depth at 550 nm from 2004 to 2013.
the smallerKT. Table 1 shows that there is no correlation with the ONI index.
To better illustrate the causes of changes in yearly SSI, Fig. 4 exhibits the yearlyKTobserved at Noumea from 2004 to 2013, together with the clear-skyKTand the cloud cover. The clear-skyKThas been multiplied by 0.75 to match better KTand help in the visual interpretation.
One may see that as a whole,KTand the clear-skyKTare following the same trend: decreasing from 2004 to 2011 and since then, a slight increase. The trend inKT is subject to fluctuations that are mostly caused by cloud cover. Like in Fig. 3, an increase of the cloud cover yields a decrease inKT and vice-versa, except for 2004–2005 and 2010–2011.
Figure 5 exhibits the yearly clear-skyKTand the aerosol optical depth at 550 nm. Unsurprisingly, there is a clear link between these variables. As a whole, an increase in aerosol optical depth yields a decrease of the clear-skyKT. The cor-relation coefficient is−0.89.
4 Discussion
Noumea experiences year-to-year fluctuation in SSI. The strong negative correlation coefficient:−0.45 between cloud cover andKTclearly shows the preeminent role of the cloud cover on the SSI.
4 P. Blanc et al.: Yearly changes in surface solar radiation in New Caledonia
Cloud cover cannot be the sole cause of the changes in so-lar radiation. Another reason is an increase in aerosol load. Strong correlations are found between the SSI and KT, and the clear-sky SSI andKT. The role of aerosols is evidenced in Fig. 5 where a change in aerosol optical depth yields an opposite change inKTand further in SSI. Besides their scat-tering and absorbing effects on solar radiation, aerosols may act as cloud condensation nuclei, thereby increasing cloud reflectivity and lifetime, hence the cloud cover effects on the SSI. The role of aerosols is far from simple; this complexity may contribute to explain the exceptions discussed in Fig. 3. The relative change in SSI over a period of 10 years can be computed by taking the difference between the SSI of the last and first years, and dividing this difference by the mean value of the SSI over the 10 years (Mueller et al., 2014). This op-eration cannot be performed in our case with reliable results because the period of measurements is too short: 17 years only. Figure 3 shows that the yearly SSI in 2003 is much smaller than for the other years. This extreme value has an influence on most of the period since it will belong to all moving windows of 10 years, starting from 1998 till 2012. If this extreme is removed, the resulting relative changes would be very different.
Only a visual analysis can be performed. The yearly SSI is less variable after 2003. Since 2004, the SSI has decreased as a whole. The changeCover a decade is quantified by cal-culating the difference between the mean SSI computed for each limit of the interval 2004–2013, i.e. 2004 and 2005, and 2012 and 2013, in the following way where I is the yearly SSI:
C= [(I (2012)+I (2013))−(I (2004)+I (2005))]/2.
It is found thatC is equal to−75 kWh m−2, i.e. 4 % of the yearly SSI averaged over 2004–2013. When converted in ir-radiance, C is equal to −9 W m−2. This value is similar to the typical change reported by Wild (2012) for India since 2000:−10 W m−2.
5 Conclusions
This study demonstrates that New Caledonia experiences a decrease in surface solar irradiation since 2004. The decrease over the 10 years period: 2004–2013, is of order of 4 % of the mean yearly irradiation for this period. This change amounts to−9 W m−2and is very large with respect to cli-matic changes as reported by Wild (2012). The available data set for the study is limited and hence our conclusions are fairly questionable.
The study has demonstrated the preeminent role of the cloud cover on the decrease of the yearly SSI and has found that it cannot be the sole cause of the changes in solar radia-tion. Changes in aerosol optical depth play a role in changes in SSI though more moderate.
This study highlights the role of data sets offering a world-wide coverage in understanding changes in solar radiation and planning large solar energy plants. The ICOADS (Inter-national Comprehensive Ocean-Atmosphere Data Set) of the NOAA has helped in revealing the role of the cloud cover. The MACC (Monitoring Atmosphere Composition and Cli-mate) data sets combined with the McClear model reveal changes in the optical depth of the aerosols that yield op-posite changes in the irradiation under clear sky conditions.
Acknowledgements. The research leading to these results has received funding from the ADEME, research grant no. 1105C0028. The authors are grateful to the anonymous reviewers whose comments helped in the clarity of this article.
Edited by: S.-E. Gryning
Reviewed by: two anonymous referees
References
Boilley, A. and Wald, L.: Comparison between meteorological re-analyses from ERA-Interim and MERRA and measurements of daily solar irradiation at surface, Renew. Energy, 75, 135–143, doi:10.1016/j.renene.2014.09.042, 2015.
Kaiser, J. W., Peuch, V.-H., Benedetti, A., Boucher, O., Enge-len, R. J., Holzer-Popp, T., Morcrette, J.-J., Wooster, M. J., and the MACC-II Management Board: The pre-operational GMES Atmospheric Service in MACC-II and its potential us-age of Sentinel-3 observations, ESA Special Publication SP-708, Proceedings of the 3rd MERIS/(A)ATSR and OCLI-SLSTR (Sentinel-3) Preparatory Workshop, held in ESA-ESRIN, 15– 19 October 2012, Frascati, Italy, 2012.
Lefèvre, M., Oumbe, A., Blanc, P., Espinar, B., Gschwind, B., Qu, Z., Wald, L., Schroedter-Homscheidt, M., Hoyer-Klick, C., Arola, A., Benedetti, A., Kaiser, J. W., and Morcrette, J.-J.: Mc-Clear: a new model estimating downwelling solar radiation at ground level in clear-sky conditions, Atmos. Meas. Tech., 6, 2403–2418, doi:10.5194/amt-6-2403-2013, 2013.
Mueller, B., Wild, M., Driesse, A., and Behrens, K.: Rethink-ing solar resource assessments in the context of global dimming and brightening, Solar Energy, 99, 272–282, doi:10.1016/j.solener.2013.11.013, 2014.
Wild, M.: Enlightening global dimming and brightening, B. Am. Meteorol. Soc., 93, 27–37, doi:10.1175/BAMS-D-11-00074.1, 2012.