The 12p13.33/
Locus and Genetic
Susceptibility to Squamous Cell Cancers of
Upper Aerodigestive Tract
Manon Delahaye-Sourdeix1, Javier Oliver1, Maria N. Timofeeva2,3, Valérie Gaborieau2, Mattias Johansson2, Amélie Chabrier1, Magdalena B. Wozniak2, Darren R. Brenner2, Maxime P. Vallée1, Devasena Anantharaman2, Pagona Lagiou4, Ivana Holcátová5, Lorenzo Richiardi6, Kristina Kjaerheim7, Antonio Agudo8, Xavier Castellsagué8,9, Tatiana V. Macfarlane10, Luigi Barzan11, Cristina Canova12,13, Nalin S. Thakker14, David
I. Conway15, Ariana Znaor16, Claire M. Healy17, Wolfgang Ahrens18,19, David Zaridze20, Neonilia Szeszenia-Dabrowska21, Jolanta Lissowska22, Eleonora Fabianova23, Ioan Nicolae Mates24, Vladimir Bencko5, Lenka Foretova25, Vladimir Janout26, Maria Paula Curado27, Sergio Koifman28, Ana Menezes29, Victor Wünsch-Filho30, José Eluf-Neto30, Paolo Boffetta31, Leticia Fernández Garrote32, Diego Serraino33, Marcin Lener34, Ewa Jaworowska35, Jan Lubiński34, Stefania Boccia36, Thangarajan Rajkumar37, Tanuja A. Samant38, Manoj B. Mahimkar38, Keitaro Matsuo39, Silvia Franceschi40,
Graham Byrnes41, Paul Brennan2, James D. McKay1*
1Genetic Cancer Susceptibility group (GCS), International Agency for Research on Cancer (IARC), Lyon, France,2Genetic Epidemiology group (GEP), International Agency for Research on Cancer (IARC), Lyon, France,3Colon Cancer Genetics Group, Institute of Genetics and Molecular Medicine, University of Edinburgh and Medical Research Council (MRC) Human Genetics Unit, Edinburgh, United Kingdom,4
Department of Hygiene, Epidemiology and Medical Statistics, University of Athens School of Medicine, Athens, Greece,5Institute of Hygiene and Epidemiology, 1st Faculty of Medicine, Charles University, Prague, Czech Republic,6University of Turin, Department of Medical Sciences, Unit of Cancer
Epidemiology, Turin, Italy,7Cancer Registry of Norway, Oslo, Norway,8Catalan Institute of Oncology-ICO, IDIBELL. L'Hospitalet de Llobregat, Barcelona, Spain,9CIBER Epidemiología y Salud Pública
(CIBERESP), Madrid, Spain,10 School of Medicine and Dentistry, University of Aberdeen, Aberdeen, United Kingdom,11General Hospital of Pordenone, Pordenone, Italy,12 Department of Environmental Medicine and Public Health, University of Padova, Padova, Italy,13MRC-HPA Centre for Environment and Health, Respiratory Epidemiology and Public Health, National Heart and Lung Institute, Imperial College, London, United Kingdom,14University of Manchester, School of Dentistry, Manchester, United Kingdom,15
University of Glasgow Dental School, Glasgow, Scotland, United Kingdom,16 Croatian National Cancer Registry, Croatian National Institute of Public Health, Zagreb, Croatia,17Trinity College School of Dental Science, Dublin, Ireland,18Leibniz Institute for Prevention Research and Epidemiology—BIPS, Bremen, Germany,19Faculty of Mathematics and Computer Science, University of Bremen, Bremen, Germany,20
Institute of Carcinogenesis, Cancer Research Centre, Moscow, Russian Federation,21Department of Epidemiology, Institute of Occupational Medicine, Lodz, Poland,22 Department of Cancer Epidemiology and Prevention, M. Sklodowska-Curie Memorial Cancer Center and Institute of Oncology, Warsaw, Poland,23
Regional Authority of Public Health, Banska Bystrica, Slovakia,24Saint Mary General and Esophageal Surgery Clinic, Carol Davila University of Medicine and Pharmacy, Bucharest, Romania,25 Department of Cancer Epidemiology and Genetics, Masaryk Memorial Cancer Institute and Masaryk University, Brno, Czech Republic,26Palacky University, Olomouc, Czech Republic,27 International Prevention Research Institute (IPRI), Ecully, France,28 National School of Public Health/FIOCRUZ, Rio de Janeiro, Brazil,29
Universidade Federal de Pelotas, Pelotas, Brazil,30 Universidade de Sao Paulo, Sao Paulo, Brazil,31 The Tisch Cancer Institute Mount Sinai School of Medicine, New York, NY, United States of America,32Institute of Oncology and Radiobiology, Havana, Cuba,33 Centro di Riferimento Oncologico, IRCSS, Unit of Epidemiology and Biostatistics, Aviano, Italy,34Department of Genetics and Pathology, International Hereditary Cancer Center, Pomeranian Medical University, Szczecin, Poland,35Department of Otolaryngology and Laryngological Oncology, Pomeranian Medical University, Szczecin, Poland,36
Institute of Public Health, Section of Hygiene, Faculty of Medicine, UniversitàCattolica del Sacro Cuore, Rome, Italy,37 Dept. of Molecular Oncology, Cancer Institute (WIA), Chennai, Tamil Nadu, India,38 Cancer Research Institute, Advanced Centre for Treatment, Research and Education in Cancer, Tata Memorial Centre, Navi Mumbai, India,39 Department of Health Promotion, Division of Oral Pathology, Kyushu Dental OPEN ACCESS
Citation:Delahaye-Sourdeix M, Oliver J, Timofeeva MN, Gaborieau V, Johansson M, Chabrier A, et al. (2015) The 12p13.33/RAD52Locus and Genetic Susceptibility to Squamous Cell Cancers of Upper Aerodigestive Tract. PLoS ONE 10(3): e0117639. doi:10.1371/journal.pone.0117639
Academic Editor:Amanda Ewart Toland, Ohio State University Medical Center, UNITED STATES
Received:July 16, 2014
Accepted:December 29, 2014
Published:March 20, 2015
Copyright:© 2015 Delahaye-Sourdeix et al. This is an open access article distributed under the terms of theCreative Commons Attribution License, which permits unrestricted use, distribution, and reproduction in any medium, provided the original author and source are credited.
Data Availability Statement:All relevant data are within the paper and its Supporting Information files.
University, Kitakyushu, Japan,40 Infections and Cancer Epidemiology group (ICE), International Agency for Research on Cancer (IARC), Lyon, France,41Biostatistics group (BST), International Agency for Research on Cancer (IARC), Lyon, France
Abstract
Genetic variants located within the 12p13.33/RAD52locus have been associated with lung
squamous cell carcinoma (LUSC). Here, within 5,947 UADT cancers and 7,789 controls from 9 different studies, we found rs10849605, a common intronic variant inRAD52, to be also
as-sociated with upper aerodigestive tract (UADT) squamous cell carcinoma cases (OR = 1.09, 95% CI: 1.04–1.15, p = 6x10⁻⁴). We additionally identified rs10849605 as aRAD52 cis-eQTL
inUADT(p = 1x10⁻³) and LUSC (p = 9x10⁻⁴) tumours, with the UADT/LUSC risk allele corre-lated with increasedRAD52expression levels. The 12p13.33 locus, encompassing
rs10849605/RAD52, was identified as a significant somatic focal copy number amplification
in UADT(n = 374, q-value = 0.075) and LUSC (n = 464, q-value = 0.007) tumors and correlat-ed with higherRAD52tumor expression levels (p = 6x10−48and p = 3x10⁻²⁹in UADT and LUSC, respectively). In combination, these results implicate increasedRAD52expression in
both genetic susceptibility and tumorigenesis of UADT and LUSC tumors.
Introduction
Upper aerodigestive tract (UADT) cancers, comprising of the oral cavity, larynx and esopha-gus, are the fourth most common cause of cancer death worldwide [1]. While consumption of tobacco and alcohol are the main UADT cancers risk factors [2], genetic susceptibility has been hypothesized to play a role in the pathogenesis of this disease [3,4].
Exposure to tobacco and alcohol leads to cell damage and DNA alterations that, in the ab-sence of appropriate repair, may cause cell cycle deregulation and cancer development [5,6]. Homologous Recombination (HR) is an important manner by which cells repair DNA lesions [7,8]. TheRAD52gene is involved in the homologous recombination DNA repair process [9]
by mediating RAD51, a central HR gene that forms a helical nucleoprotein filament involved in the search for homology and strand pairing [10].
Genome wide association studies (GWAS) have implicated the rs10849605 genetic variant at 12p13.33, the locus that encompassesRAD52in the human genome, to be associated with a
modest, but statistically significant, increased risk of lung cancer [11,12]. It appears most rele-vant to lung squamous cell carcinoma (LUSC) and small cell lung cancers, but with little evi-dence within lung adenocarcinomas (LUAD) [11,12]. Although the molecular mechanisms contributing to initiation and progression are still poorly understood, squamous cell carcino-mas (SCC) of different anatomical sites share many phenotypic and molecular characteristics with each other [13]. The aim of the present study was to investigateRAD52in the context of
genetic susceptibility to SCC of the UADT, to explore how this association might be mediated and examine the somatic mutation events at theRAD5212p13.33 locus.
Materials and Methods
Study subjects
A total of 9 case-control studies of UADT cancer participated in our present study totalling 5,947 UADT cancer cases and 7,789 controls. Study designs and population characteristics have been described in more details previously [3,14,15] and are briefly described inTable 1. In most studies, the control subjects were frequency matched to the cases on age, sex, and addi-tional factors (e.g., study site and hospital). Written informed consent was obtained from all study subjects, and the investigations were approved by the institutional review boards at each study center. Analysis was restricted to squamous cell carcinomas.
Genotyping
The rs10849605 was genotyped using Illumina bead arrays or TaqMan genotyping
(C__1244798_10, Applied Biosystems, Carlsbad, CA) at IARC as described elsewhere [3]. The performance of Taqman assays was validated by re-genotyping samples of known genotype (for example HapMap). The genotype distribution was in accordance with that expected by Hardy-Weinberg equilibrium in each country/study. All subsequent genotyping achieved an internal study duplicate concordance rate of>99%.
The Cancer Genome Atlas data
We accessed to the Head and Neck Squamous Cell Carcinoma (HNSC), Lung Squamous Cell Carcinoma (LUSC) and Lung Adenocarcinoma (LUAD) components of the TCGA data (TCGA Project Number #3230 and #2731). This data is accessible using the dbGAP via the TGCA (https://tcga-data.nci.nih.gov/tcga/). Data were downloaded either fromhttps://cghub. ucsc.edu/for exome sequencing or directly fromhttps://tcga-data.nci.nih.gov/tcga/for the RNA sequencing, methylation and genotype data.
Exome sequencing. We accessed TCGA exome sequencing“level 1”(unprocessed) data for 363 HNSC and 459 LUSC TCGA individuals and completed bioinformatics analysis of their sequence data using Picard, GATK, MuTect and Somatic Indel detector (Methods A in
S1 File). Subsequently we used in house bioinformatics pipelines (Methods A inS1 File) to de-termine the highest quality variant calls. Somatic point mutations were exonic functional vari-ants defined as either truncating, impacting splicing or missense varivari-ants predicted as
deleterious by SIFT/POLYPHEN2 [16,17].
Copy Number Variation. Samples were hybridized using the Genome-Wide Human SNP Array 6.0 platform at the Genome Analysis Platform of the Broad Institute. We retrieved level 3 TCGA data of 374 HNSC, 464 LUSC and 476 LUAD individuals containing normalized log2
ratios of the fluorescence intensities between the target sample and a reference sample. We only included in our analysis individuals for whom both tumor and corresponding normal calls were available. For a segment, we considered log2(ratio)<-0.5 to be an indication of a
loss, and a log2(ratio)>0.5 to indicate a gain. Segments with log2(ratio) of between−0.5 and
0.5 were not retained as somatic copy number alterations. Annotation was done adding the genes contained in each of the remaining segments using EnsEMBL databases [18].
RNA sequencing. RNA sequencing (RNA-seq) TCGA data was retrieved the“level 3”
data for 263 HNSC, 223 LUSC and 125 LUAD individuals. Normalization of this data is further detailed within the statistical methods section.
site by calculating the M-value (log2(ratio of methylated and unmethylated probes)) using
TCGA level 2 data [19]. Methylation level 2 data is already background-corrected.
rs10849605 TCGA genotypes. rs10849605 is located inside the 5’region ofRAD52and
was not covered by exome sequencing. Therefore we derived the genotypes for 263 HNSC, 223 LUSC and 125 LUAD individuals using the Affymetrix 6.0 SNP array TCGA data.
Statistical methods
Association analysis. The association between the variants and UADT cancer risk was es-timated by odds ratio (ORs) and 95% confidence intervals (CIs) per allele under the log-addi-tive model and genotype derived from multivariate unconditional logistic regression, with sex and study specific country of origin included in the model as covariates (S1 Table). Heteroge-neity of ORs was assessed using the Cochran’s Q test. Statistical analyses were performed using SAS version 9.3 (SAS Institute, Cary, NC, USA).
To control for potential ethnic heterogeneity between cases and controls, we performed a principal components analysis using the EIGENSTRAT package of the EIGENSOFT 5.0 soft-ware [20] using 12,898 markers in low linkage disequilibrium [21]. We used the resulting 12
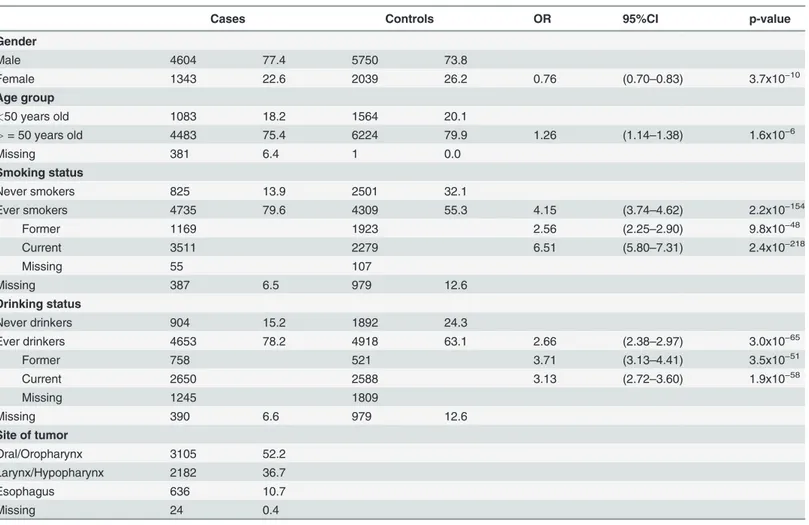
Table 1. Demographic characteristics of the cases and controls included in the genetic susceptibility study ofRAD52/rs10849605.
Cases Controls OR 95%CI p-value
Gender
Male 4604 77.4 5750 73.8
Female 1343 22.6 2039 26.2 0.76 (0.70–0.83) 3.7x10⁻¹⁰
Age group
<50 years old 1083 18.2 1564 20.1
>= 50 years old 4483 75.4 6224 79.9 1.26 (1.14–1.38) 1.6x10⁻⁶
Missing 381 6.4 1 0.0
Smoking status
Never smokers 825 13.9 2501 32.1
Ever smokers 4735 79.6 4309 55.3 4.15 (3.74–4.62) 2.2x10−154
Former 1169 1923 2.56 (2.25–2.90) 9.8x10−48
Current 3511 2279 6.51 (5.80–7.31) 2.4x10−218
Missing 55 107
Missing 387 6.5 979 12.6
Drinking status
Never drinkers 904 15.2 1892 24.3
Ever drinkers 4653 78.2 4918 63.1 2.66 (2.38–2.97) 3.0x10−65
Former 758 521 3.71 (3.13–4.41) 3.5x10−51
Current 2650 2588 3.13 (2.72–3.60) 1.9x10−58
Missing 1245 1809
Missing 390 6.6 979 12.6
Site of tumor
Oral/Oropharynx 3105 52.2
Larynx/Hypopharynx 2182 36.7
Esophagus 636 10.7
Missing 24 0.4
OR, CI and p-values represent the risk of UADT in each substrata, adjusted for sex and study specific country of origin.
statistically significant eigen vectors (as defined by the Tracy-Widom statistics) in the sensitivi-ty analysis (Table A inS1 File).
eQTL analyses. The association between rs10849605 germline genotype andRAD52
tumor expression levels (eQTL) was tested on 263 HNSC, 223 LUSC and 125 LUAD using a linear model. It has been repeatedly observed that tumors acquire somatic alterations that can also influence gene expression, particularly copy number changes and DNA methylation [22–24]. Therefore we tested the eQTL effect of rs10849605 onRAD52tumor expression using
both adjusted and non-adjusted linear models as described in Table B inS1 File. These statisti-cal analyses were performed using R statististatisti-cal software (The R Foundation for Statististatisti-cal Com-puting,http://www.R-project.org).
In order to control for the impact of population heterogeneity, we inferred population struc-ture of the 263 HNSC, 223 LUSC and 125 LUAD TCGA cases with the Strucstruc-ture software [25] using Hapmap release #23 as the reference population [26] and restricted the eQTL analyses to the 215 HNSC, 192 LUSC and 113 LUAD cases predicted to be of European ancestry
(CEU>0.8). On these, we further conducted a principal components analysis similar to the
GWAS one. The resulting significant eigen vectors (as defined by Tracy-Widom statistics) were used within the eQTL sensitivity analysis (Table C inS1 File).
Copy number analysis—GISTIC. We used a publicly available method, called Genomic
Identification of Significant Targets in Cancer (GISTIC) [27,28], version 2.0 to find the signifi-cantly amplified or deleted regions using TCGA copy number data. The GISTIC algorithm computes p-values for each marker by comparing the score at each locus to a background score distribution generated by random permutation of the marker locations in each sample. Then they correct the p-values for multiple-hypothesis testing using the Benjamini-Hochberg false discovery rate (FDR) method. Therefore the GISTIC scores represent significance levels and are expressed as q-values (significant below 0.25).
RNA sequencing normalization. Level 3 RNA sequencing tumor data that we accessed from the TCGA was already normalized to the kilobase per million reads (RPKM) standard which corrects for species length and read depth [29], but not for diversity of the RNA popula-tion. To control for this we applied TMM (Trimmed Mean of M-values) normalization [30] to the RPKM data. This possibly involves a loss of statistical efficiency relative to applying TMM to raw data, since the precision weighting in TMM will no longer function. However it should not add any bias and the loss of efficiency will be small if the read density is close to uniform. We used implementations in the EdgeR package of BioConductor [31] and the voom function of the Bioconductor limma package [32]. The normal expression data being available only for a few cases, it was not possible to perform any differential expression analysis.
Results
Germline genetic variation rs10849605 and susceptibility to UADT
cancers
We genotyped rs10849605 in 5,947 UADT cancer cases and 7,789 control individuals from 9 studies. Frequency of the minor allele of rs10849605 varied somewhat by country, with the risk allele (C) being more prevalent in Europe and Latin America countries compared to Asia (51% and 49% versus 40% respectively).
genetic ancestry (Table A inS1 File). The association was also consistent within UADT cancer subsites and consumption of tobacco. However, it was more prominent in those that consumed alcohol compared to non-drinkers (p_het 0.03) (Fig. 1). There was little evidence to suggest this variant altered consumption patterns of tobacco and alcohol (p = 0.53 and p = 0.40, respec-tively, pack/years and ethanol/day taken as a continuous variable).
Integrated
in-silico
fine mapping of the 12p13.33 locus
We next undertookin-silicoanalysis of the rs10849605 variant and theRAD52/12p13.33 locus
in the head and neck and lung cancers genomically characterised by the Cancer Genome Atlas (TCGA).
Expression quantitative trait locus (eQTL) of rs10849605 in HNSC and
LUSC
rs10849605 is located near the putative promoter 5’to theRAD52gene, therefore we
hypothe-sized that this, or a correlated proxy variant, might influenceRAD52gene expression. We
per-formed an expression quantitative trait locus (eQTL) analysis between rs10849605 andRAD52 Fig 1. Association betweenRAD52SNP rs10849605 and UADT cancer risk.Squares represent ORs, size of the square represents the inverse of the variance of the log ORs, horizontal lines represent 95% CIs. The solid vertical line indicates OR = 1 and the dashed vertical line the overall OR under the log-additive model. p_het is the p-value for heterogeneity between the different subgroups. I2 is the % of observed variation across subgroups (negative I2 were set to 0).
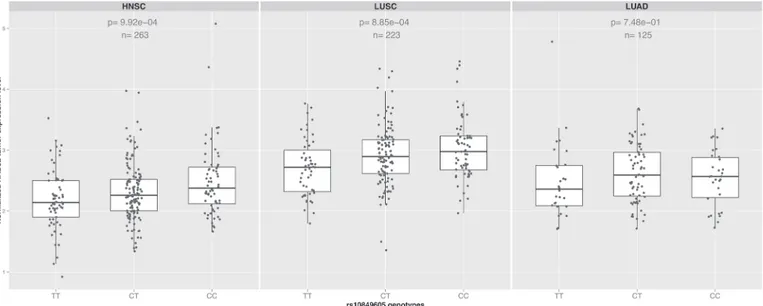
expression levels in HNSC (n = 263), using data where both RNAseq of the tumors and geno-typing had been carried out by TCGA within the same individuals. rs10849605 was signifi-cantly associated withRAD52gene expression levels in HNSC (Fig. 2, n = 263, p = 9x10⁻⁴), suggesting that rs10849605 is acis-eQTL locus forRAD52. The C allele of rs10849605,
associ-ated with risk of HNSC, was correlassoci-ated with increasedRAD52expression levels (Fig. 2). The
association was not sensitive either to adjustment for somatic events (copy number or meth-ylation status which may influence eQTL analysis in tumors [22]), HNSC subtype (larynx/hy-popharynx, oral cavity, oropharynx) or population structure (Tables B and C inS1 File). A comparable effect was observed in LUSC (Fig. 2, n = 223, p = 8x10⁻⁴) but no clear eQTL asso-ciation was observed in lung adenocarcinoma (LUAD,Fig. 2, n = 125, p = 0.75). While statis-tically significant, the eQTL for rs10849605 accounted for only a small proportion of the variance (approximately 4%) inRAD52expression in HNSC and LUSC tumours, an
observa-tion in line with the relatively modest genetic risk observed with this variant.
Somatic alterations at RAD52/12p13.33 in Head and Neck Squamous
Cell Carcinoma (HNSC) and LUSC
Within somatic mutations recalled from paired normal-tumor exome sequencing samples of 305 HNSC and 243 LUSC,RAD52was rarely mutated somatically (point mutations and
inser-tions deleinser-tions), with only 2 HNSC (0.60% of tumors) and one LUSC (0.40% of tumors) pa-tients harbouring a somatic missense variant, and no somatic insertion or deletion observed.
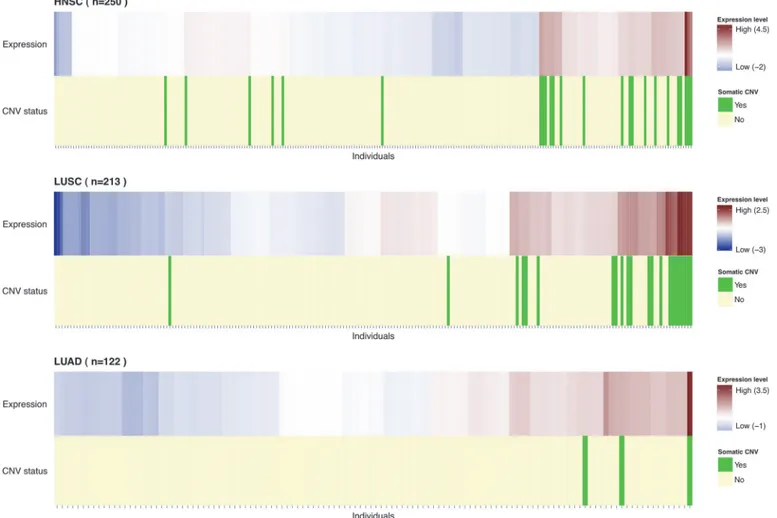
By contrast, we analysed the TCGA somatic copy number variation (CNV) data of 374 HNSC, 464 LUSC and 476 LUAD tumors and found that the 12p13.33 locus was a frequent re-gion of copy number gain in HNSC (7.2% of cases) and LUSC (11.2% of cases). Copy number gain of 12p13.33 was observed in a lower proportion of LUAD tumors (3.9% of cases) (Fig. 3). There was a significant difference in the somatic copy number gain frequencies between SCC and LUAD (p = 3x10⁻⁵). Additionally, we used GISTIC2 statistical program to determine the relative importance of the 12p13.33 gain in comparison with the background rate of copy
Fig 2. eQTL analysis.Boxplots showing the effect of the genotype for the SNPRAD52rs10849605 onRAD52tumor expression levels in HNSC, LUSC and LUAD. The risk allele (C) significantly increasesRAD52expression levels (p = 9x10⁻⁴and 8x10⁻⁴respectively) in both squamous cancers but not in lung adenocarcinoma (p = 0.75). In contrast, there was no evidence for association between rs10849605 and expression levels of other genes in the 12p13.33 region (Table D inS1 File).
number changes across the genome [27,28] using the TCGA somatic copy number data. The 12p13.33 region was identified by GISTIC2 as a significant focal amplification in HNSC and LUSC (q-value = 0.075 and 0.007, respectively) but not in LUAD (Figure A inS1 File).
Presence of somatic copy number gain was also correlated with higherRAD52expression
levels in both HNSC and LUSC tumors, (p = 6x10−48and 3x10⁻²⁹, respectively) (Fig. 3), with copy number at this locus accounting for a large proportion of the variance inRAD52tumor
expression levels (57% in HNSC and 45% in LUSC). As expected, gene expression levels were correlated with copy number for other genes at 12p13.33 (11 out of 26). However, rs10849605 appeared to influence onlyRAD52expression levels (Table D inS1 File).
Discussion
Our study has identified rs10849605 to be associated with UADT cancer (p = 6x10⁻⁴). While the modest nature of this association limited our ability to detect inter-substrata heterogeneity, the association was relatively consistent across the diverse etiological settings of Europe, Japan, Latin America and sub-continental Asia (where tobacco chewing is an important UADT can-cer risk factor). We note that differing LD patterns, or cryptic population structure where we
Fig 3. Distribution of individuals byRAD52expression.Individuals were ordered by unsupervised clustering based onRAD52expression levels.
Heatmap represents the scaled RPKM normalized values with higher expression levels represented in red and lower expression levels in blue. The individuals carrying a copy number gain (log2(ratio)>0.5) ofRAD52are highlighted in green (light yellow otherwise).RAD52gain carriers seem to have the same high expression pattern and cluster together. Particularly in LUAD one of the 3 gain carriers has the highestRAD52expression level.
were unable to control for, could influence these results. Nevertheless, our findings are consis-tent with the observation that rs10849605 (or variants correlated with it) have also been associ-ated with lung cancer, and particularly lung squamous cell carcinomas. As found in lung cancer [12], the allele C of the susceptibility variant rs10849605 was associated with a modest increased risk of UADT.
rs10849605 is located at chromosome 12p13.33, a locus that contains theRAD52gene.
RAD52cellular role is DNA double strand break repair via homologous recombination,
inter-acting with multiple DNA repair related genes within this function and therefore a plausible candidate gene to explain this association [33]. Nevertheless, we cannot exclude the possibility of an alternate susceptibility gene toRAD52due to linkage disequilibrium. We therefore used
anin-silicointegrative analysis using TCGA expression, genotype and somatic alteration data
to fine map this susceptibility locus. 12p13.33 was a region of significant somatic copy number gain in HNSC and LUSC, suggesting that somatic amplification of 12p13.33 is an important molecular event in a subset of tumors. However, the 3MBp amplified region contained multiple genes in addition toRAD52. Importantly, rs10849605 was an eQTL in HNSC and LUSC for
RAD52only, suggestingRAD52as the most probable candidate driver gene for both the genetic
susceptibility and tumorigenesis at this locus. As an eQTL, the rs10849605 UADT and LUSC risk associated allele (allele C) was correlated with increasedRAD52expression levels. That
higherRAD52expression appears involved in both genetic susceptibility and somatic events in
UADT and LUSC may indicate that RAD52 activity is enabling tumor cells to have sufficient genome integrity to avoid apoptosis, a trait that may be particularly important within the geno-toxic environment created by tobacco smoke and alcohol consumption. Notably, both the eQTL and somatic gains were observed in HNSC and LUSC, but not LUAD, consistent with the lung cancer genetic susceptibility [11,12], reinforcing the importance of this locus in SCC.
A key role ofRAD52is to provide cells with a level of redundancy in DNA repair [34].
RAD52is therefore particularly important in cells deficient in the BRCA1-PALB2-BRCA2
pathway, providing an alternate mechanism for DNA repair [35,36]. Targeted inhibition of
RAD52inBRCA2deficient cells results in genomic instability and cell growth inhibition,
lead-ing to the suggestion ofRAD52as a potential therapeutic target using synthetic lethality
ap-proaches [37]. Our results linkingRAD52higher gene expression to UADT and LUSC, along
with our recent observation that a rare truncatingBRCA2genetic variant, rs11571833
(K3326X) is associated with a 2.5 fold risk of squamous cell carcinomas of the lung and UADT [38,39], suggests that such targeted therapy approaches may be worth investigating in UADT and LUSC tumors.
Supporting Information
S1 File. Methods A. Figure A, Amplification peaks identified across the genome by GIS-TIC2 in HNSC, LUSC and LUAD. The Gistic-scores are shown on the top and the q-values on the bottom. The significance line is drawn at q-value = 0.25 and the significantly amplified locus are annotated on the right side of each plot. The 12p13.33 amplified region is framed and indicated with an arrow.Table A, Population stratification sensitivity analysis.Model 1 is the original association analysis logistic regression, adjusted for sex and study specific country of origin. Model 2 further adjusts for population stratification including the 12 significant eigen vectors (as defined by Tracy-Widom statistics) as covariates in the logistic regression.
the following linear models: 1) Non-adjusted, how the genotype influences the gene expression. 2) For HNSC cancer, the subtype (oral cavity, larynx/hypopharynx or oropharynx) is used as the covariate. 3)RAD52somatic copy number is used as the covariate. 4) Since we are
interest-ed here in the influence of somatic determinants on an increase of expression and because methylation is inversely correlated with expression (hypermethylated sites tend to decrease ex-pression when hypomethylated sites induce increase in exex-pression), we selected 8 of the 24 CpG sites for being hypomethylated (as defined by a negative M-value across all individuals in all our 3 different cancer sites). Out of these 8, only cg15612927 was significantly associated with expression ofRAD52in all 3 cancers (p-value<0.05). Therefore tumor methylation levels
of cg15612927 was used as the covariate. 5) The initial model is adjusted for all three somatic alterations (subtype for HNSC, somatic copy number and methylation levels).Table C, eQTL sensitivity analysis.The linear model measures the effect of rs10849605 genotype on RAD52 tumor expression levels. The first line presents the results on all TCGA cases we accessed. The second line restricts the analysis on TCGA cases predicted to be of European origin. The last line show the results of the same linear model but adjusted for the statistically significant eigen vectors, as defined by Tracy-Widom (5 for HNSC and LUSC, 8 for LUAD).Table D, 12p13.33 copy number versus expression and eQTL analysis in HNSC and LUSC. Association analysis between copy number and expression levels for each given gene in the 12p13.33 region (left side of the table,‘NA’if no CNV or expression data available). For the significant associations only, we performed an eQTL analysis to check how rs10849605 genotype influences each given gene expression levels (right side of the table). Significant results are highlighted in green (Bon-ferroni correction for multiple testing).
(DOCX)
S1 Table. Study epidemiological exposures and genetic data.
(XLSX)
Acknowledgments
The authors thank all of the participants who took part in this research and the funders and support and technical staff who made this study possible. We also acknowledge and thank The Cancer Genome Atlas initiative whose data contributed heavily to this study.
Author Contributions
Conceived and designed the experiments: MDS GB P. Brennan JDM. Performed the experi-ments: MDS JO AC JDM. Analyzed the data: MDS JO MNT VG MJ MBW DB MPV DA GB. Contributed reagents/materials/analysis tools: PL IH LR KK AA XC TVM LB CC NST DIC AZ CMH WA DZ NSD J. Lissowska EF INM VB LF VJ MPC SK AM VWF JEN P. Boffetta LFG DS ML EJ J. Lubiński SB TR TAS MBM KM SF. Wrote the paper: MDS JO MNT MJ JDM. Final manuscript writing: MDS JO MNT VG MJ AC MBW DRB MPV DA PL IH LR KK AA XC TVM LB CC NST DIC AZ CMH WA DZ NSD J. Lissowska EF INM VB LF VJ MPC SK AM VWF JEN P. Boffetta LFG DS ML EJ J. Lubiński SB TR TAS MBM KM SF GB P. Bren-nan JDM.
References
1. Ferlay J, Shin HR, Bray F, Forman D, Mathers C, et al. (2010) Estimates of worldwide burden of cancer in 2008: GLOBOCAN 2008. Int J Cancer 127: 2893–2917. doi:10.1002/ijc.25516PMID:21351269
3. McKay JD, Truong T, Gaborieau V, Chabrier A, Chuang SC, et al. (2011) A genome-wide association study of upper aerodigestive tract cancers conducted within the INHANCE consortium. PLoS Genet 7: e1001333. doi:10.1371/journal.pgen.1001333PMID:21437268
4. Negri E, Boffetta P, Berthiller J, Castellsague X, Curado MP, et al. (2009) Family history of cancer: pooled analysis in the International Head and Neck Cancer Epidemiology Consortium. Int J Cancer 124: 394–401. doi:10.1002/ijc.23848PMID:18814262
5. Hoeijmakers JH (2001) Genome maintenance mechanisms for preventing cancer. Nature 411: 366– 374. PMID:11357144
6. Scully C, Field JK, Tanzawa H (2000) Genetic aberrations in oral or head and neck squamous cell car-cinoma (SCCHN): 1. Carcinogen metabolism, DNA repair and cell cycle control. Oral Oncol 36: 256– 263. PMID:10793327
7. Thacker J (1999) The role of homologous recombination processes in the repair of severe forms of DNA damage in mammalian cells. Biochimie 81: 77–85. PMID:10214913
8. Sung P, Klein H (2006) Mechanism of homologous recombination: mediators and helicases take on regulatory functions. Nat Rev Mol Cell Biol 7: 739–750. PMID:16926856
9. Liu J, Heyer WD (2011) Who's who in human recombination: BRCA2 and RAD52. Proc Natl Acad Sci U S A 108: 441–442. doi:10.1073/pnas.1016614108PMID:21189297
10. Baumann P, West SC (1998) Role of the human RAD51 protein in homologous recombination and dou-ble-stranded-break repair. Trends Biochem Sci 23: 247–251. PMID:9697414
11. Shi J, Chatterjee N, Rotunno M, Wang Y, Pesatori AC, et al. (2012) Inherited variation at chromosome 12p13.33, including RAD52, influences the risk of squamous cell lung carcinoma. Cancer Discov 2: 131–139. doi:10.1158/2159-8290.CD-11-0246PMID:22585858
12. Timofeeva MN, Hung RJ, Rafnar T, Christiani DC, Field JK, et al. (2012) Influence of common genetic variation on lung cancer risk: meta-analysis of 14 900 cases and 29 485 controls. Hum Mol Genet 21: 4980–4995. doi:10.1093/hmg/dds334PMID:22899653
13. Yan W, Wistuba II, Emmert-Buck MR, Erickson HS (2011) Squamous Cell Carcinoma—Similarities and Differences among Anatomical Sites. Am J Cancer Res 1: 275–300. PMID:21938273
14. Anantharaman D, Chabrier A, Gaborieau V, Franceschi S, Herrero R, et al. (2014) Genetic variants in nicotine addiction and alcohol metabolism genes, oral cancer risk and the propensity to smoke and drink alcohol: a replication study in India. PLoS One 9: e88240. doi:10.1371/journal.pone.0088240
PMID:24505444
15. Oze I, Matsuo K, Hosono S, Ito H, Kawase T, et al. (2010) Comparison between self-reported facial flushing after alcohol consumption and ALDH2 Glu504Lys polymorphism for risk of upper aerodigestive tract cancer in a Japanese population. Cancer Sci 101: 1875–1880. doi:10.1111/j.1349-7006.2010.
01599.xPMID:20518787
16. Ng PC, Henikoff S (2003) SIFT: Predicting amino acid changes that affect protein function. Nucleic Acids Res 31: 3812–3814. PMID:12824425
17. Adzhubei IA, Schmidt S, Peshkin L, Ramensky VE, Gerasimova A, et al. (2010) A method and server for predicting damaging missense mutations. Nat Methods 7: 248–249. doi:10.1038/nmeth0410-248 PMID:20354512
18. Flicek P, Ahmed I, Amode MR, Barrell D, Beal K, et al. (2013) Ensembl 2013. Nucleic Acids Res 41: D48–55. doi:10.1093/nar/gks1236PMID:23203987
19. Du P, Zhang X, Huang CC, Jafari N, Kibbe WA, et al. (2010) Comparison of Beta-value and M-value methods for quantifying methylation levels by microarray analysis. BMC Bioinformatics (11: ): 587.
20. Price AL, Patterson NJ, Plenge RM, Weinblatt ME, Shadick NA, et al. (2006) Principal components analysis corrects for stratification in genome-wide association studies. Nat Genet 38: 904–909. PMID:
16862161
21. Yu K, Wang Z, Li Q, Wacholder S, Hunter DJ, et al. (2008) Population substructure and control selec-tion in genome-wide associaselec-tion studies. PLoS One 3: e2551. doi:10.1371/journal.pone.0002551
PMID:18596976
22. Li Q, Seo JH, Stranger B, McKenna A, Pe'er I, et al. (2013) Integrative eQTL-based analyses reveal the biology of breast cancer risk loci. Cell 152: 633–641. doi:10.1016/j.cell.2012.12.034PMID:23374354
23. Stranger BE, Forrest MS, Dunning M, Ingle CE, Beazley C, et al. (2007) Relative impact of nucleotide and copy number variation on gene expression phenotypes. Science 315: 848–853. PMID:17289997
24. Portela A, Esteller M (2010) Epigenetic modifications and human disease. Nat Biotechnol 28: 1057– 1068. doi:10.1038/nbt.1685PMID:20944598
26. Frazer KA, Ballinger DG, Cox DR, Hinds DA, Stuve LL, et al. (2007) A second generation human haplo-type map of over 3.1 million SNPs. Nature 449: 851–861. PMID:17943122
27. Beroukhim R, Getz G, Nghiemphu L, Barretina J, Hsueh T, et al. (2007) Assessing the significance of chromosomal aberrations in cancer: methodology and application to glioma. Proc Natl Acad Sci U S A 104: 20007–20012. PMID:18077431
28. Mermel CH, Schumacher SE, Hill B, Meyerson ML, Beroukhim R, et al. (2011) GISTIC2.0 facilitates sensitive and confident localization of the targets of focal somatic copy-number alteration in human cancers. Genome Biol 12: R41. doi:10.1186/gb-2011-12-4-r41PMID:21527027
29. Mortazavi A, Williams BA, McCue K, Schaeffer L, Wold B (2008) Mapping and quantifying mammalian transcriptomes by RNA-Seq. Nat Methods 5: 621–628. doi:10.1038/nmeth.1226PMID:18516045
30. Robinson MD, Oshlack A (2010) A scaling normalization method for differential expression analysis of RNA-seq data. Genome Biol 11: R25. doi:10.1186/gb-2010-11-3-r25PMID:20196867
31. Robinson MD, McCarthy DJ, Smyth GK (2010) edgeR: a Bioconductor package for differential expres-sion analysis of digital gene expresexpres-sion data. Bioinformatics 26: 139–140. doi:10.1093/bioinformatics/
btp616PMID:19910308
32. Smyth G (2005) Bioinformatics and Computational Biology Solutions Using R and Bioconductor. In: R Gentleman VC, W. Huber, R. Irizarry, S. Dudoit editor. pp. 397–420.
33. Symington LS (2002) Role of RAD52 epistasis group genes in homologous recombination and double-strand break repair. Microbiol Mol Biol Rev 66: 630–670, table of contents. PMID:12456786
34. Lok BH, Powell SN (2012) Molecular pathways: understanding the role of Rad52 in homologous recom-bination for therapeutic advancement. Clin Cancer Res 18: 6400–6406. doi:
10.1158/1078-0432.CCR-11-3150PMID:23071261
35. Lok BH, Carley AC, Tchang B, Powell SN (2013) RAD52 inactivation is synthetically lethal with deficien-cies in BRCA1 and PALB2 in addition to BRCA2 through RAD51-mediated homologous recombination. Oncogene 32: 3552–3558. doi:10.1038/onc.2012.391PMID:22964643
36. Feng Z, Scott SP, Bussen W, Sharma GG, Guo G, et al. (2011) Rad52 inactivation is synthetically lethal with BRCA2 deficiency. Proc Natl Acad Sci U S A 108: 686–691. doi:10.1073/pnas.1010959107 PMID:21148102
37. Cramer-Morales K, Nieborowska-Skorska M, Scheibner K, Padget M, Irvine DA, et al. (2013) Personal-ized synthetic lethality induced by targeting RAD52 in leukemias identified by gene mutation and ex-pression profile. Blood 122: 1293–1304. doi:10.1182/blood-2013-05-501072PMID:23836560
38. Wang Y, McKay JD, Rafnar T, Wang Z, Timofeeva MN, et al. (2014) Rare variants of large effect in BRCA2 and CHEK2 affect risk of lung cancer. Nat Genet 46: 736–741. doi:10.1038/ng.3002PMID:
24880342