SED
5, 463–524, 2013Deformation and recrystallization of
olivine
C. A. Trepmann et al.
Title Page
Abstract Introduction
Conclusions References
Tables Figures
◭ ◮
◭ ◮
Back Close
Full Screen / Esc
Printer-friendly Version Interactive Discussion
Discussion
P
a
per
|
Dis
cussion
P
a
per
|
Discussion
P
a
per
|
Discussio
n
P
a
per
|
Solid Earth Discuss., 5, 463–524, 2013 www.solid-earth-discuss.net/5/463/2013/ doi:10.5194/sed-5-463-2013
© Author(s) 2013. CC Attribution 3.0 License.
Geoscientiic Geoscientiic
Geoscientiic Geoscientiic
Open Access
Solid Earth
Discussions
This discussion paper is/has been under review for the journal Solid Earth (SE). Please refer to the corresponding final paper in SE if available.
Experimental deformation and
recrystallization of olivine – processes
and time scales of damage healing during
postseismic relaxation at mantle depths
C. A. Trepmann1, J. Renner2, and A. Druiventak2
1
Department for Earth and Environmental Sciences, Ludwig-Maximilians-Universit ¨at M ¨unchen, Germany
2
Institute for Geology, Mineralogy, and Geophysics, Ruhr-Universit ¨at Bochum, Germany
Received: 20 March 2013 – Accepted: 21 March 2013 – Published: 17 April 2013
Correspondence to: C. A. Trepmann ([email protected])
SED
5, 463–524, 2013Deformation and recrystallization of
olivine
C. A. Trepmann et al.
Title Page
Abstract Introduction
Conclusions References
Tables Figures
◭ ◮
◭ ◮
Back Close
Full Screen / Esc
Printer-friendly Version Interactive Discussion
Discussion
P
a
per
|
Dis
cussion
P
a
per
|
Discussion
P
a
per
|
Discussio
n
P
a
per
|
Abstract
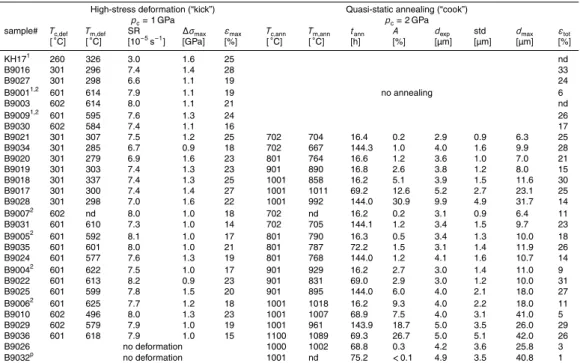
Experiments comprising sequences of deformation (at 300 or 600◦C) and annealing at varying temperature (700 to 1100◦C), time (up to 144 h) and stress (up to 1.5 GPa) were carried out in a Griggs-type apparatus on natural olivine-rich peridotite samples to simulate deformation and recrystallization processes in deep shear zones that reach
5
mantle depth as continuations of seismically active faults. The resulting olivine micro-fabrics were analysed by polarization and electron microscopy. Core-and-mantle like microstructures are the predominant result of our experiments simulating rapid stress relaxation (without or with minor creep) after a high-stress deformation event: porphy-roclasts (>100 µm) are surrounded by defect-poor recrystallized grains with a wide
10
range in size (2 to 40 µm). Areas with smaller recrystallized grains (≤10 µm) trace
former high-strain zones generated during initial high-stress deformation even after annealing at a temperature of 1100◦C for 70 h. A weak crystallographic preferred ori-entation (CPO) of recrystallized olivine grains is related to the oriori-entation of the host crystals but appears unrelated to the strain field. Based on these findings, we propose
15
that olivine microstructures in natural shear-zone peridotites with a large range in re-crystallized grain size, localized fine-grained zones, and a weak CPO not related to the strain field are diagnostic for a sequence of high-stress deformation followed by recrys-tallization at low stresses, as to be expected in areas of seismic activity. We extended the classic Avrami-kinetics equation by accounting for time-dependent growth kinetics
20
and constrained the involved parameters relying on our results and previously reported kinetics parameters. Extrapolation to natural conditions suggests that the observed characteristic microstructure may develop within as little as tens of years and less than ten thousands of years. These recrystallization microstructures have a great diagnostic potential for past seismic activity because they are expected to be stable over
geolog-25
SED
5, 463–524, 2013Deformation and recrystallization of
olivine
C. A. Trepmann et al.
Title Page
Abstract Introduction
Conclusions References
Tables Figures
◭ ◮
◭ ◮
Back Close
Full Screen / Esc
Printer-friendly Version Interactive Discussion
Discussion
P
a
per
|
Dis
cussion
P
a
per
|
Discussion
P
a
per
|
Discussio
n
P
a
per
|
1 Introduction
In the tectonic environment of subduction zones, shear zones can reach down to man-tle depth as continuation of seismically active fault zones, as for example observed for the Sumatra earthquake in 2004 that caused the infamous tsunami (Singh et al., 2008; Dessa et al., 2009). The macro-scale time-dependent rheology of such shear zones
5
is controlled by nano- to micro-scale deformation and recrystallization processes in the affected upper mantle rocks (i.e. peridotites). What are these processes and what are their characteristic time scales for damage healing? These questions can be ad-dressed by experimentally studying deformation and recrystallization processes during characteristic stress sequences. Large earthquakes generate short-term high strain
10
rates and stresses at depth below the seismogenic zone and below the long-term litho-spheric brittle-viscous transition, causing transiently brittle mechanisms at depth where at lower stress the material shows ductile behaviour (e.g. Sibson, 1980; Schloz, 2002; Ellis and St ¨ockhert, 2004; N ¨uchter and Ellis, 2010). This temporal change in rheology is reflected by:
15
1. seismological observations: maximum hypocenter depths are initially larger than that of the preceding background seismicity and then decrease gradually with time to the background level (e.g. Ben-Zion and Lyakhovsky, 2006; Ben-Zion, 2008). Aftershocks following large earthquakes occur transiently at larger depth than the main event (e.g. Schaffet al., 2002; Rolandone et al., 2004), and
20
2. the microstructural record of deformation and recrystallization from exhumed metamorphic rocks (e.g. K ¨uster and St ¨ockhert, 1999; Trepmann and St ¨ockhert, 2001, 2002, 2003; N ¨uchter and St ¨ockhert, 2007; Birtel and St ¨ockhert, 2008; Matysiak et al., 2012).
Despite the important influence of rapidly changing stresses and strain rates on
defor-25
SED
5, 463–524, 2013Deformation and recrystallization of
olivine
C. A. Trepmann et al.
Title Page
Abstract Introduction
Conclusions References
Tables Figures
◭ ◮
◭ ◮
Back Close
Full Screen / Esc
Printer-friendly Version Interactive Discussion
Discussion
P
a
per
|
Dis
cussion
P
a
per
|
Discussion
P
a
per
|
Discussio
n
P
a
per
|
b). The focus on deformation and recrystallization at long-lasting stationary conditions owes partly to the lack of diagnostic features in the geological record that can be used to assess whether recrystallization occurs continuously together with deformation (dy-namic recrystallization) at relatively constant stresses or subsequently to deformation at high stress when stresses are low and insufficient to maintain inelastic
deforma-5
tion (static recrystallization). Microstructures formed at rapidly evolving conditions dur-ing coseismic loaddur-ing and postseismic relaxation superimpose each other and a pro-longed thermal history of exhumed rocks causes a modification of the earlier features. Therefore, non-steady state experiments at successively different stress conditions are needed to identify characteristic overprinting microfabrics and the relevant time scales
10
of their evolution.
Olivine in peridotites experimentally deformed at low temperatures and high stresses reveals specific microstructures (Druiventak et al., 2011) that are modified by recov-ery and recrystallization to core-and-mantle like microstructures during annealing at quasi-isostatic conditions (Druiventak et al., 2012). The experimentally derived
core-15
and-mantle like microstructures are strikingly similar to those from shear zone peri-dotites often interpreted to be formed by continuous dynamic recrystallization during dislocation creep at relatively constant stresses.
The primary objectives of this experimental study are documenting the microfabric evolution and constraining the kinetics parameters of static recrystallization of olivine
20
after high-stress deformation. For this end, we carried out deformation and isostatic annealing (“kick and cook”) experiments at various temperatures and times, simulat-ing quasi-instantaneous stress relaxation and a subsequent prolonged isothermal low-stress event. We aim at establishing relations between deformation conditions, anneal-ing temperature, and annealanneal-ing time on the one hand and area percentage, grain size,
25
SED
5, 463–524, 2013Deformation and recrystallization of
olivine
C. A. Trepmann et al.
Title Page
Abstract Introduction
Conclusions References
Tables Figures
◭ ◮
◭ ◮
Back Close
Full Screen / Esc
Printer-friendly Version Interactive Discussion
Discussion
P
a
per
|
Dis
cussion
P
a
per
|
Discussion
P
a
per
|
Discussio
n
P
a
per
|
(“kick and creep”) and (b) repeat deformation after a first deformation and isostatic annealing (“kick-cook-kick”). The microstructural findings from our experiments and the inferred kinetics parameters are used to discuss the time-dependent rheology and damage healing processes in shear zones that occur at mantle depths as continuations of seismically active faults.
5
2 Characteristics of the experimental approach
2.1 Experimental protocol
The Griggs-type apparatus, its sample assembly, and the sample material, a coarse-grained (grain size 0.2 to 1 mm) peridotite (up to 90 % olivine) from the Almklovdalen complex, Norway, have previously been described in detail (Druiventak et al., 2011,
10
2012). In this study, five suites of experiments were carried out with varying sequences of deformation and annealing.
1. To simulate instantaneous stress relaxation after high-stress deformation, sam-ples were deformed at temperatures of 300 and 600◦C, at a confining pressure of 1 GPa. The strain rates varied between 3×10⁻⁵and 8×10⁻⁵s−1(Table 1). After 15
deformation, the axial piston was retracted and samples were heated at a con-stant rate of 5◦C min−1to temperatures of 700 to 1100◦C. To avoid melting of the confining medium, the confining pressure was simultaneously increased at a con-stant rate to GPa and these conditions were held for ca. 16, 70 or 144 h. These “kick and cook” experiments follow the original set up for studying microstructure
20
development during coseismic loading and postseismic relaxation in quartz-rich lithologies (Trepmann et al., 2007), later applied to natural peridotites by Druiven-tak et al. (2012).
2. Two reference annealing experiments without preceding deformation (“cook”, Ta-ble 1) were performed at a temperature of 1000◦C, a confining pressure of 2 GPa,
SED
5, 463–524, 2013Deformation and recrystallization of
olivine
C. A. Trepmann et al.
Title Page
Abstract Introduction
Conclusions References
Tables Figures
◭ ◮
◭ ◮
Back Close
Full Screen / Esc
Printer-friendly Version Interactive Discussion
Discussion
P
a
per
|
Dis
cussion
P
a
per
|
Discussion
P
a
per
|
Discussio
n
P
a
per
|
and a duration of ca. 70 h. One experiment was performed in the Griggs-type ap-paratus (B9026) and one in a standard piston cylinder apap-paratus (B9032) (Renner et al., 1997).
3. To simulate creep during the period of stress relaxation three experiments were conducted with the first deformation stage as in (1) and continued deformation
5
during heating and annealing at 1000◦C and 2 GPa for ca. 70 h (Table 2). In these “kick and creep” experiments, the piston was not retracted before heating and annealing. During one experiment (B9037) the axial piston remained at its final position of the first deformation step. During heating stress relaxation may have been partly counteracted by thermal expansion of the piston and the sample.
10
Stress relaxation then dominated during isothermal annealing. The axial piston was advanced from its end position with a velocity of 0.15 mm h−1 during experi-ment B9039 for ca. 0.7 h during heating from 600 to 850◦C. In experiment B9038 the piston was advanced with a velocity of 0.75 mm h−1during the entire heating period lasting for ca. 2 h.
15
4. To simulate a repeated seismic event, “kick-cook-kick” experiments were carried out comprising deformation and subsequent quasi-isostatic annealing as in (1) and finally a second deformation step at 1 GPa and 300◦C (B9040) or 600◦C (B9014), experiment B9015 was deformed during both high-stress stages at 600◦C and 2 GPa (Table 2).
20
5. One reference experiment (“cook-and-kick” B9044) was carried out without the first deformation but starting with isostatic annealing at 1000◦C for 70 h followed by deformation at 600◦C and 1 GPa confining pressure (Table 2).
2.2 Analytical techniques
The olivine microfabrics of tested samples were analysed by optical microscopy,
scan-25
SED
5, 463–524, 2013Deformation and recrystallization of
olivine
C. A. Trepmann et al.
Title Page
Abstract Introduction
Conclusions References
Tables Figures
◭ ◮
◭ ◮
Back Close
Full Screen / Esc
Printer-friendly Version Interactive Discussion
Discussion
P
a
per
|
Dis
cussion
P
a
per
|
Discussion
P
a
per
|
Discussio
n
P
a
per
|
transmission electron microscopy (TEM). Polarization microscopy was performed on polished thin sections (30 µm thick). A SEM (LEO 1530) instrument equipped with field emission gun and forescatter detector was used for automated EBSD measurements with a step size of 0.7 to 1 µm. For the TEM analysis, a Phillips EM301 microscope operating at 100 kV was used. The TEM foils (100 to 200 nm thick) were prepared by
5
the focused ion beam (FIB) technique.
The area covered by recrystallized grains, further referred to as recrystallization area, was mapped for all samples relying on images gained by optical microscopy (see Ta-bles 1 and 2). EBSD measurements provided information on the spatial distribution of the crystallographic orientation of grains in recrystallized areas. Since recrystallized
10
grains were generally too small to be analysed by optical microscopy in 30 µm thick sec-tions, EBSD maps were also used for grain size analysis, despite the general difficulty to distinguish between mis-indexing and small real grains. Grain sizes were estimated using a threshold of a relative crystallographic misorientation angle of 10◦ to formally distinguish between subgrains and grains.
15
The quoted recrystallized grain size represents the diameter of a circle of equivalent area. Given the applied step size of 0.7 to 1 µm for automatic EBSD measurements, grains with a diameter below 2 µm were neglected. The average grain diameter is given as the expectation value of the associated grain size distribution. Variability in grain size within a sample is represented by the standard deviation in grain size (see Tables 1 and
20
2). Typically, grain size distributions show the maximum for the lowest grain size bin (<5 µm), then grain size frequencies rapidly decrease to zero. Maximum recrystallized grain size is reported as the diameter of the last bin class with a non-zero frequency. Clearly, the absolute values for grain size determination are strongly dependent on the processing routine of the EBSD data. Here, all measurements were processed by
25
SED
5, 463–524, 2013Deformation and recrystallization of
olivine
C. A. Trepmann et al.
Title Page
Abstract Introduction
Conclusions References
Tables Figures
◭ ◮
◭ ◮
Back Close
Full Screen / Esc
Printer-friendly Version Interactive Discussion
Discussion
P
a
per
|
Dis
cussion
P
a
per
|
Discussion
P
a
per
|
Discussio
n
P
a
per
|
3 Results – mechanical data
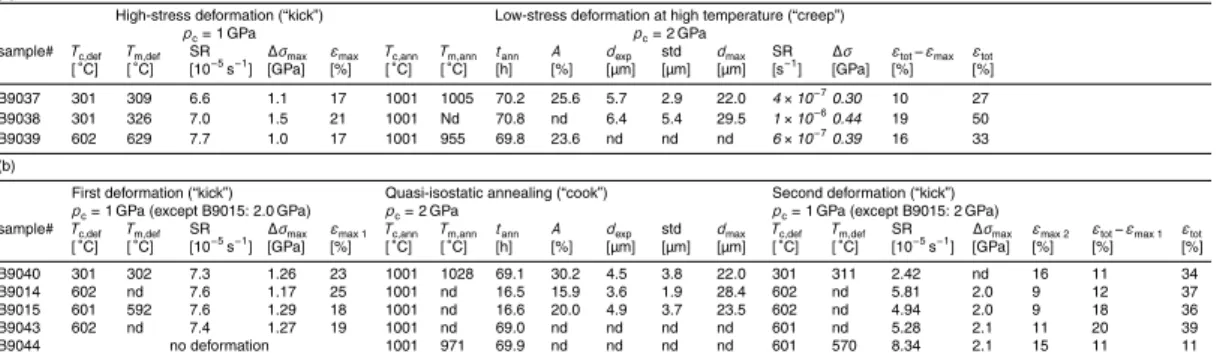
Maximum differential stress,∆σmax, and maximum strain,εmax, (sum of elastic and in-elastic strain) reached during deformation were derived from stress-strain curves after friction correction (Rybacki et al., 1998). The maximum differential stress ranged be-tween 1 and 1.5 GPa during the initial deformation stage (Table 1). A weak temperature
5
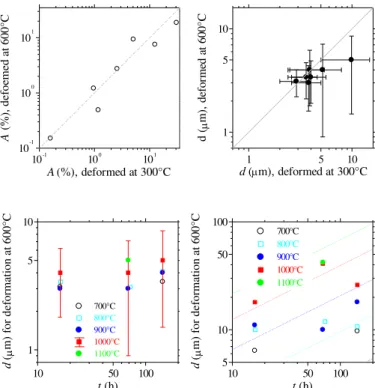
dependence of strength can be noticed from mean values of differential stress at 10 % strain (Fig. 1). On average, samples deformed at 300◦C show a higher strength than those deformed at 600◦C (see also Druiventak et al., 2011).
The stress-strain curves yield maximum strain between 14 and 28 %, correlating well with the permanent shorteningεtotalbetween 5 and 33 % as determined from
cal-10
liper measurements on recovered samples after the experiments (Table 1). Shorten-ing of samples in the reference annealShorten-ing experiments without precedShorten-ing deformation (“cook”) amounts to 3 % for the sample tested in the Griggs-type apparatus and 1 % for the sample tested in the piston-cylinder apparatus (Table 1).
Most of the stress-strain curves show systematic softening with increasing strain.
15
Due to the inherent uncertainty of the friction corrections in solid-media apparatus (e.g. Rybacki et al., 1998; Holyoke and Kronenberg, 2010) it is possible that the curves in-dicating softening do not all reflect actual material behaviour. Yet, the cases for which stress decreases prominently with increasing strain (Fig. 1) correlate with the obser-vation of local shear zones in the deformed samples (Fig. 2). The slight variations in
20
applied strain rates do not affect strength (Table 1).
Strains accumulated during the “creep” stage in “kick and creep” experiments,εcreep, in which the piston was slowly advanced or remained at its final position of the de-formation stage during the annealing, range from 10 to 29 %, as calculated from the difference between total strain determined from the shortening of the sample after the
25
SED
5, 463–524, 2013Deformation and recrystallization of
olivine
C. A. Trepmann et al.
Title Page
Abstract Introduction
Conclusions References
Tables Figures
◭ ◮
◭ ◮
Back Close
Full Screen / Esc
Printer-friendly Version Interactive Discussion
Discussion
P
a
per
|
Dis
cussion
P
a
per
|
Discussion
P
a
per
|
Discussio
n
P
a
per
|
the duration of the high-temperature stage (Table 2). Differential stress at this stage is estimated to be somewhat below 0.5 GPa using the flow law for dislocation creep of olivine after Chopra and Paterson (1981) and assuming that at this stage olivine de-forms by dislocation creep at the given temperature of 1000◦C and the inferred strain rates. Clearly, differential stress and strain rate are not constant during the creep stage.
5
Strain during the second low-temperature deformation after isostatic annealing can be estimated in two ways: (1) taking the difference between the total strainεtot repre-senting the permanent shortening of the sample and the strainεmax1 derived from the stress-strain curves of the first deformation leads to 11 to 20 %; (2) directly analyzing the “second” stress-strain curve gives comparable strainsεmax2 of 9 to 16 % (Table 2).
10
Maximum differential stresses during this second deformation stage exceed those ob-served during the first. The friction characteristics changed relative to the first deforma-tion stage when the experiment was cooled down to the temperatures of the second deformation stage (300, 600◦C) after extended high-temperature annealing rendering the quoted stresses of the second stage more uncertain. A reduction in strength from
15
the first to the second deformation stage can however be excluded. The same applies to the reference experiment without a first deformation stage (“cook-kick”).
4 Results – olivine microfabric analysis
Microstructures resulting from the high-stress deformation (“kick”) are described in detail by Druiventak et al. (2011). In this study, the focus is on the evolution of the
20
olivine microfabric during subsequent annealing at varying temperatures, durations, and stresses. As the high-stress deformation determines the olivine microfabric evo-lution during subsequent annealing, the main characteristics ought to be summarised here. The olivine grains with an original diameter of 0.2 to 1 mm show intragranular frac-tures, some of which may be pre-existent features (Fig. 2a). Localized, highly damaged
25
SED
5, 463–524, 2013Deformation and recrystallization of
olivine
C. A. Trepmann et al.
Title Page
Abstract Introduction
Conclusions References
Tables Figures
◭ ◮
◭ ◮
Back Close
Full Screen / Esc
Printer-friendly Version Interactive Discussion
Discussion
P
a
per
|
Dis
cussion
P
a
per
|
Discussion
P
a
per
|
Discussio
n
P
a
per
|
undulatory extinction associated with high relative misorientation angles as evidenced by EBSD and with a high density of dislocations, cellular domains, and voids as found by TEM (see also Druiventak et al., 2011, 2012). The highly damaged zones constitute an area percentage of 5 to 7 %.
In samples from the reference annealing experiments at 1000◦C for 70 h without
5
preceding experimental deformation (B9026, B9036), small grains with a diameter of 4 to 5 µm occur locally along boundaries and former cracks of the coarse-grained original olivine crystals. These small grains are referred to as recrystallized grains. An area of about 1 to 3 % of the reference samples is covered by the recrystallized grains.
4.1 Microfabrics after deformation and annealing (“kick and cook”)
10
4.1.1 Types of grains
In the deformed and then annealed samples, the differentiation between original host grains and recrystallized grains, as described above in the reference samples (B9026, B9036), is not as straight forward, given the locally strong grain size reduction by brit-tle and glide-controlled crystal-plastic deformation, especially in the highly damaged
15
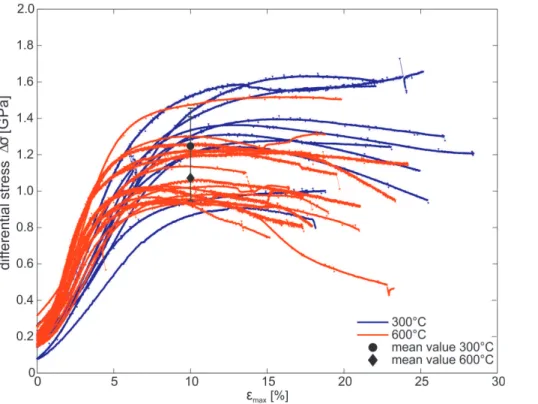
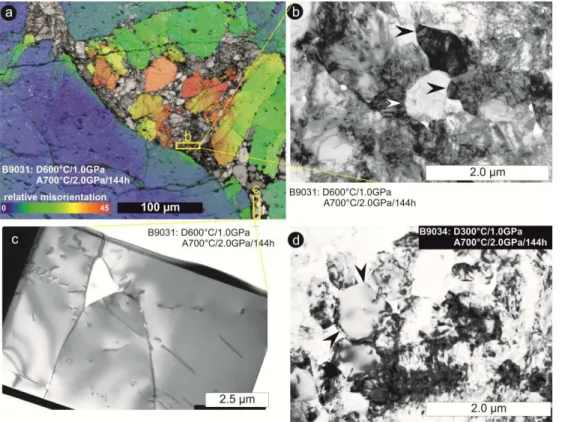
zones (Fig. 3). Different types of grains are differentiated on the basis of the microstruc-tures of samples deformed at 300 or 600◦C and annealed at 700◦C. In these samples that experience annealing at the lowest temperature, optically, a marked modification is not resolved compared to the microstructures observed immediately after deformation (Fig. 4). In TEM, the highly damaged zones represented by a high density of
dislo-20
cations that occur in tangles containing dislocation-poor domains is still present after 144 h of annealing, irrespective whether initial deformation occurred at 600◦C (Fig. 4b) or at 300◦C (Fig. 4d). The combination of EBSD maps and TEM observations (Fig. 4), however, reveals that recrystallized grains occur locally after annealing for 144 h even at this lowest annealing temperature. At this stage of incipient recrystallisation we can
25
SED
5, 463–524, 2013Deformation and recrystallization of
olivine
C. A. Trepmann et al.
Title Page
Abstract Introduction
Conclusions References
Tables Figures
◭ ◮
◭ ◮
Back Close
Full Screen / Esc
Printer-friendly Version Interactive Discussion
Discussion
P
a
per
|
Dis
cussion
P
a
per
|
Discussion
P
a
per
|
Discussio
n
P
a
per
|
1. Almost defect free tiny (<1 µm) crystalline volumes occur within crystalline mate-rial of very high defect density composing the highly damaged zones originating from the high-stress deformation stage (Fig. 4b, d). This type of recrystallized grains is subsequently referred to as “new grains”. Voids occur along the bound-aries of new grains but also within the matrix of high defect density.
5
2. Grains of a few micrometers or a few tens of micrometers with smoothly curved grain boundaries and an inherited defect density are interpreted to originate from small fragments of original grains whose boundaries lost their angularity driven by curvature reduction during incipient heat treatment (Fig. 4c). These grains are referred to as “recrystallized host fragments”. Voids of 1 to 2 µm in diameter are
10
present at three-grain junctions and smaller voids between two grains. The dif-ferentiation between “recrystallized host fragment” and “new grains” thus reflects both, the variance in defect density and grain size. A distinction between “recrys-tallized host fragment” and “porphyroclasts” is established solely on the basis of size: porphyroclasts are defined by a long axis of grains >100 µm, i.e. >10 to
15
50 % of the original grain size of the natural peridotites.
Optically, new grains and recrystallized host fragments cannot be distinguished, es-pecially in samples that experienced low annealing temperature for short duration, and are summarized as “recrystallized grains” when describing bulk properties. A diff eren-tiation between new grains and recrystallized host fragments at SEM and TEM scale
20
is obvious and required when discussing grain boundary migration processes during growth. Grains with inherited dislocation density (i.e. recrystallized host fragments plus porphyroclasts) are summarized as deformed grains.
4.1.2 Development of recrystallized area and grain size during isostatic annealing
25
SED
5, 463–524, 2013Deformation and recrystallization of
olivine
C. A. Trepmann et al.
Title Page
Abstract Introduction
Conclusions References
Tables Figures
◭ ◮
◭ ◮
Back Close
Full Screen / Esc
Printer-friendly Version Interactive Discussion
Discussion
P
a
per
|
Dis
cussion
P
a
per
|
Discussion
P
a
per
|
Discussio
n
P
a
per
|
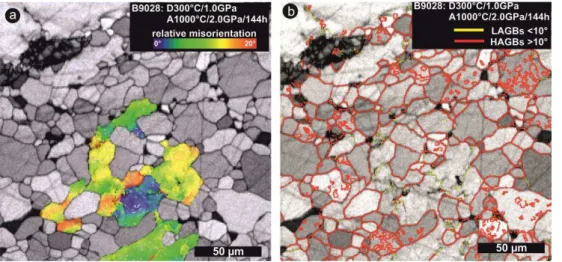
and time (Figs. 5c, d, 6). Recrystallization area (up to 30 %) and average diameter of recrystallized grains (3 to 10 µm) increase with annealing temperature and time (see also Table 1). Recrystallized grains occur in zones between porphyroclasts and in in-tragranular zones. Most prominently, they follow the original highly damaged zones generated during the high-stress deformation stage (Fig. 3). The size of recrystallized
5
grains varies strongly within one sample, as reflected by the high standard deviation (Table 1). The variability slightly increases with increasing annealing temperature and annealing time not only in absolute values but also relative to the expectation values (Fig. 5a).
Generally, less than a few percent of the area of a sample are recrystallized after
an-10
nealing at temperatures of≤900◦C. The microstructural observations indicate that the
highly damaged zones formed during deformation are completely replaced by recrys-tallized grains after annealing for 70 h at 900◦C. At higher temperatures, recrystalliza-tion affects an area beyond the optically-defined highly damaged zones. Generally, the striking microstructure of porphyroclasts surrounded by recrystallized grains observed
15
after annealing at temperatures of≥900◦C is similar to what is commonly addressed as core-and-mantle structure (e.g. Fitz Gerald and St ¨unitz, 1993; Passchier and Trouw, 2008; Stipp and Kunze, 2008).
New grains and recrystallized host fragments differ prominently also after anneal-ing at high temperature for a long time: in samples annealed at 1000◦C for 144 h,
20
EBSD maps reveal isometric new grains that do not show any intracrystalline deforma-tion features and that have smoothly curved high-angle grain boundaries (Fig. 7). Re-crystallized host fragments, in contrast are characterised optically and in EBSD maps by varying crystallographic orientation within one grain (i.e. undulatory extinction), the presence of low-angle grain boundaries, sutured high-angle grain boundaries and
ir-25
SED
5, 463–524, 2013Deformation and recrystallization of
olivine
C. A. Trepmann et al.
Title Page
Abstract Introduction
Conclusions References
Tables Figures
◭ ◮
◭ ◮
Back Close
Full Screen / Esc
Printer-friendly Version Interactive Discussion
Discussion
P
a
per
|
Dis
cussion
P
a
per
|
Discussion
P
a
per
|
Discussio
n
P
a
per
|
arrow in Fig. 8a), which is not the case for the recrystallized host fragments (red arrow in Fig. 8a). The new grains typically retain a small diameter of<10 µm and occur con-centrated in zones that are interpreted to follow former highly damaged zones (Fig. 8a). The exact differentiation between recrystallized host fragments and porphyroclasts be-comes increasingly ambiguous, as the grain size of porphyroclasts shrinks as they are
5
replaced by the growing recrystallized grains (Fig. 8a). Despite this ambiguity in detail, however, it can be safely stated that an area>70 % of the sample is covered by por-phyroclasts (host fragments >100 µm) even at the highest annealing temperature of 1100◦C (B9036, Fig. 8).
In TEM, the different characteristics of recrystallized host fragments and new grains
10
are apparent by their respective intracrystalline defects: recrystallized host fragments show low-angle grain boundaries arranged in short, commonly subparallel sets and a low to moderately high (<1013m−2) dislocation density (Figs. 8b, c, 9). New grains are free of low-angle grain boundaries and contain almost no dislocations (Figs. 8b, c, 9a–c, f). The boundaries between two new grains (Fig. 9a, b) as well as the boundaries
15
between new grains and recrystallized host fragments (Figs. 9c, f, 10b, c) are partly decorated by tiny voids. Either type of boundary, between new grains and host grains or between two new grains, is smoothly curved.
4.1.3 CPO of recrystallized grains
New grains that occur in intragranular zones show a relative misorientation angle of
20
generally higher than 30◦ compared to their host and no systematic orientation rela-tionship to the host or the shortening direction (Fig. 10a, b). In contrast, larger aggre-gates of new grains and recrystallized host fragments (Fig. 10c) and consequently the bulk CPO of recrystallized olivine grains (Fig. 11) show a marked imprint of the crys-tallographic orientation of the host crystal rather than to the shortening direction. For
25
SED
5, 463–524, 2013Deformation and recrystallization of
olivine
C. A. Trepmann et al.
Title Page
Abstract Introduction
Conclusions References
Tables Figures
◭ ◮
◭ ◮
Back Close
Full Screen / Esc
Printer-friendly Version Interactive Discussion
Discussion
P
a
per
|
Dis
cussion
P
a
per
|
Discussion
P
a
per
|
Discussio
n
P
a
per
|
4.2 Microfabrics after deformation and a subsequent low-stress, high-temperature stage (“kick and creep”)
The main characteristics of the microfabrics found after high-stress deformation and a high-temperature creep stage at 1000◦C for 70 h and stresses about 3 times lower than those during the “kick” stage (i.e. 0.5 GPa) are comparable to those of samples
5
that experienced isostatic annealing at the same temperature for the same duration. Coand-mantle like structures are found (Fig. 12a, b); the average diameter of re-crystallized grains is about 6 µm (see Tables 1 and 2); the observed CPO patterns are variable with strong scatter in orientations and unsystematic correlation with the host orientation (Fig. 11). Yet, an increase in recrystallized area to 24 to 26 % is observed
10
for samples after “kick and creep” experiments compared to only 7 to 13 % in the iso-statically annealed samples at otherwise comparable conditions.
4.3 Microfabrics after deformation, annealing and renewed low-temperature deformation (“kick-cook-kick”)
In samples that experienced a second high-stress, low-temperature deformation stage
15
after an initial high-stress deformation and isostatic annealing (“kick-cook-kick”), elon-gate remnants of bent original grains with internal misorientation are observed in di-rect contact to zones of recrystallized grains (Fig. 12c, d). Strain accumulated during the second high-stress deformation therefore appears to localize in the porphyroclasts rather than in the fine-grained recrystallized zones. Microstructures from the “cook and
20
kick” reference experiment (B9044, annealed at 1000◦C for 70 h, deformed at 600◦C) show some isometric recrystallized grains along boundaries of large original grains comparable to the “cook” reference samples B9026 and B9032 and otherwise deforma-tion microstructures (fractured original grains and highly damaged zones) comparing well to the “kick” experiments.
SED
5, 463–524, 2013Deformation and recrystallization of
olivine
C. A. Trepmann et al.
Title Page
Abstract Introduction
Conclusions References
Tables Figures
◭ ◮
◭ ◮
Back Close
Full Screen / Esc
Printer-friendly Version Interactive Discussion
Discussion
P
a
per
|
Dis
cussion
P
a
per
|
Discussion
P
a
per
|
Discussio
n
P
a
per
|
5 Discussion
The recrystallization features observed in our reference samples annealed without pre-ceding experimental deformation are interpreted to be a result of the rocks natural strain history rather than non-hydrostatic stress states during the experiments. The ob-served recrystallized grains supposedly develop by grain boundary migration of small
5
crystalline, relatively defect-free volumes surrounded by naturally strained areas of the peridotites, i.e. along grain boundaries or pre-existent fractures. Yet, the recrystallized area observed after the hydrostatic reference “cook” experiments in the Griggs appa-ratus (B9026) and the piston cylinder appaappa-ratus (B9032) differs. The difference may be a result of sample to sample variability but may also indicate a poorer realization of
10
hydrostatic conditions in the Griggs apparatus. If the latter is true, the microstructural observations of all experiments may be slightly biased by a recrystallization fraction of up to 3 % not necessarily directly correlated with the imposed experimental conditions. The sites most prone to recrystallization due to an inherited natural deformation his-tory may, however, also accommodate the experimental deformation. If so, the
recrys-15
tallized area observed during the reference experiments does not constitute a bias to our observations. The extent of these recrystallization phenomena is so restricted that their occurrence does not significantly affect our discussion. Furthermore, the “starting material” in nature will typically also have some strain energy stored from preceding events when a high-stress event takes place.
20
In the following, we firstly discuss the recrystallization processes for the two identified types of recrystallized grains distinguished from our “kick and cook” experiments, then specifically address the quantitative grain size evolution during isostatic annealing, the kinetics of static recrystallization and finally the implications of our study with regards to extrapolation to natural conditions and recognition of diagnostic microstructures in
25
SED
5, 463–524, 2013Deformation and recrystallization of
olivine
C. A. Trepmann et al.
Title Page
Abstract Introduction
Conclusions References
Tables Figures
◭ ◮
◭ ◮
Back Close
Full Screen / Esc
Printer-friendly Version Interactive Discussion
Discussion
P
a
per
|
Dis
cussion
P
a
per
|
Discussion
P
a
per
|
Discussio
n
P
a
per
|
5.1 Evolution of the two different types of recrystallized grains
The “kick” stage at 300 and 600◦C leads to a transient marked grain size reduction by fracturing together with glide-controlled crystal-plastic deformation but evidence for recrystallization is lacking (see also, Druiventak et al., 2011, 2012). Thus, the tallised grains observed after isostatic annealing develop exclusively by static
recrys-5
tallisation after deformation. The increase in recrystallized grain size with increasing annealing temperature and duration indicate that “nucleation and growth” processes are active to different degrees when recrystallization proceeds during heating and iso-static annealing with and without superposed creep.
Based on the microstructural observations we distinguished two fundamentally
dif-10
ferent types of recrystallized grains:
1. The first type referred to as “new grains” formed within highly damaged zones (Figs. 8, 10a). We suppose that their precursors differentiate into
– crystallites: tiny dislocation-free volumes (<2 µm) formed by comminution, – cell structures: dislocation-free domains surrounded by dislocation tangles,
15
formed by dislocation glide during high-stress deformation.
At an early stage of annealing at 700◦C (Fig. 4b, d), these grains are repre-sented by the defect-free domains with a diameter<2 µm, both are surrounded by crystalline material containing a high density tangled dislocation. Since annealing proceeds at isostatic conditions new grains do not develop internal deformation
20
features. The crystallographic orientation of new grains appears nearly random and only weakly controlled by the crystallographic orientation of the host crystal (Fig. 10). Their orientation does not show a relation to the stress orientation of the initial deformation.
Both, crystallites and cell structures, are formed during deformation and
ther-25
SED
5, 463–524, 2013Deformation and recrystallization of
olivine
C. A. Trepmann et al.
Title Page
Abstract Introduction
Conclusions References
Tables Figures
◭ ◮
◭ ◮
Back Close
Full Screen / Esc
Printer-friendly Version Interactive Discussion
Discussion
P
a
per
|
Dis
cussion
P
a
per
|
Discussion
P
a
per
|
Discussio
n
P
a
per
|
not apply to static recrystallisation. Nevertheless, some thermal affects may con-tribute, such as cell-wall migration and rounding of granular fragments. However, the similarity between quantitative microstructural characteristics found for an-nealing after deformation at 300◦C and 600◦C (Fig. 4) suggests these contribu-tions to be small. Thus, “nucleation” does not occur in the classical sense used
5
for phase transformations but rather constitutes a process of “initiation”, during which small crystalline volumes of low internal strain energy grow on the ex-pense of deformed material (e.g. Humphreys and Hatherly, 2004). We still use the term “nucleation” here, given the small size of the precursors (“seeds” or “nu-clei”) embedded in the highly disordered crystal lattice. The formation of these
10
new grains is different from subgrain rotation recrystallization (i.e. polygonisation) or bulging recrystallization (e.g. Drury and Urai, 1990; Shimizu, 1998; Stipp and Kunze, 2008; Platt and Behr, 2011), for which the larger precursors inherit the crystallographic orientation of the host and which are processes that require on-going deformation with continuous dislocation production, i.e. dynamic
recrystal-15
lization. Similar observations of high misorientation between new grains and weak to absent orientation control by the host crystals developed from sites, where the crystal lattice is highly disordered (Fig. 4b, d), has also observed for example in quartz (Trepmann et al., 2007) and feldspar (St ¨unitz et al., 2003).
2. The second type of recrystallized grains differ mainly from new grains by (a) the
20
inherited defects from the initial deformation stage, (b) their larger size (up to a few tens of µm, Fig. 4c) compared to that of the crystallites (<2 µm) from which the new grains develop, and (c) the separation to other fragments by high-angle grain boundaries (Fig. 4c). After isostatic annealing the recrystallized host fragments contain low-angle grain boundaries and show sutured grain boundaries (Figs. 4c,
25
SED
5, 463–524, 2013Deformation and recrystallization of
olivine
C. A. Trepmann et al.
Title Page
Abstract Introduction
Conclusions References
Tables Figures
◭ ◮
◭ ◮
Back Close
Full Screen / Esc
Printer-friendly Version Interactive Discussion
Discussion
P
a
per
|
Dis
cussion
P
a
per
|
Discussion
P
a
per
|
Discussio
n
P
a
per
|
The weak CPO (Fig. 11) in the bulk areas of recrystallized grains (new grains plus recrystallized host fragments) is not interpretable in terms of intracrystalline glide sys-tems requiring dynamic recrystallization resulting in recrystallized grains preferentially oriented with the active glide direction parallel to the stretching lineation and the glide plane in the foliation plane.
5
5.2 Grain size evolution during isostatic annealing
Growth of recrystallized grains occurs dominantly during isostatic annealing. Given the short time of heating from 600◦C to the final annealing temperature (max. 2.3 h) in comparison to the extended duration of annealing (16 to 144 h), the contribution of growth during the heating phase can be neglected. Growth of defect-free new grains
10
surrounded by crystalline material with a high defect density is initially driven by the re-duction in strain and surface energies. Boundaries between defect-free new grains are solely controlled by interfacial free energy, whereas other grain boundaries (between deformed grains and between new grains and deformed grains) are continuously mi-grating driven by gradients in the defect density.
15
A positive correlation between the final grain size attained during static recrystalli-sation and annealing temperature as observed here (Fig. 5b, c, Table 1) has also pre-viously been reported, as has a negative correlation between resulting grain size and accumulated bulk strain during the preceding deformation (e.g. Fig. 4.16 in Nicolas and Poirier, 1976; Humphreys and Hatherly, 2004). Strain affects the number of nucleation
20
sites (e.g. Humphreys and Hatherly, 2004) as much as it affects the degree and spa-cial extent of crystal damage. In addition, the defect content of the deformed material affects the driving force for growth and potentially also the grain boundary mobility. Spacial heterogeneity in local strain is characteristic for deformation in the regime of low-temperature plasticity associated with fracturing dominant in the “kick” steps of the
25
SED
5, 463–524, 2013Deformation and recrystallization of
olivine
C. A. Trepmann et al.
Title Page
Abstract Introduction
Conclusions References
Tables Figures
◭ ◮
◭ ◮
Back Close
Full Screen / Esc
Printer-friendly Version Interactive Discussion
Discussion
P
a
per
|
Dis
cussion
P
a
per
|
Discussion
P
a
per
|
Discussio
n
P
a
per
|
The observed range in grain sizes in samples from experiments after annealing at high temperatures (≥900◦C) and long annealing times (≥69 h) can be explained by
a negative correlation between grain size and strain (Figs. 8a, 10a, Table 1). The fine-grained (<10 µm) zones represent sites of high nucleus density, i.e. former highly dam-aged zones, where many nuclei are created and they mutually hinder each other in
5
their growth due to impingement. In contrast, at some distance of the highly damaged zones fewer and larger recrystallised grains (up to 40 µm) occur (Fig. 10a), likely due to a lower nucleus density for new grains and/or predominant occurrence of recrystal-lized host fragments over new grains. Furthermore, for the new grains that are almost free of defects on the one hand and the recrystallized host fragments that inherit the
10
deformed microstructure on the other, variations in the driving force for growth during isostatic annealing have to be considered (see for example Hackl and Renner, 2013, for an analytic expression of the dependence of a grain’s size evolution on the relation between its energy state and that of its environment).
The driving force for growth of recrystallized grains, i.e. the difference in their free
15
energy and that of their environment, is here simply associated with two defect con-centrations, the density of interfaces and dislocations,
∆G= ∆Gγ+ ∆Gρ=γ
1 ddef
− 1
drec
+µb2(ρdef−ρrec) . (1)
In our samples, the free energy of new grains is dominated by their interfacial en-ergy while that of deformed grains is dominated by strain enen-ergy represented by
20
dislocation density (Fig. 13a). We therefore approximate the driving force by ∆G≃ −γ/drec+µb2ρdef yielding a condition for the minimum size of a new grain to grow in expense of the deformed grains,drec,min=γ/µb
2 ρdef.
A quantitative analysis of the critical size for a recrystallisation nucleus in olivine aggregates yields between 10 and a 100 nm in volumes with a dislocation density of
25
∼1015m−2(within half an order of magnitude) assumingγ∼1J m−2(see Table 3a). The
SED
5, 463–524, 2013Deformation and recrystallization of
olivine
C. A. Trepmann et al.
Title Page
Abstract Introduction
Conclusions References
Tables Figures
◭ ◮
◭ ◮
Back Close
Full Screen / Esc
Printer-friendly Version Interactive Discussion
Discussion
P
a
per
|
Dis
cussion
P
a
per
|
Discussion
P
a
per
|
Discussio
n
P
a
per
|
nuclei may be even smaller than the value above due to the order of magnitude reduc-tion in their interfacial energy relative to the value of large-angle grain boundary energy used here. Once a material volume is solely composed of new grains (e.g. complete replacement of highly damaged zones) normal grain growth sets in controlled by a driv-ing force that is dominated by the relative relation between the curvature of the grain
5
boundaries (e.g. Atkinson, 1988; Evans et al., 2001).
At all stages, grain boundary migration may be affected by pinning due to voids present on the grain boundaries (Fig. 9) that are relics of low-temperature plasticity associated with brittle deformation preceding the annealing. In contrast, strain-induced migration of boundaries between defect-free new grains and recrystallized host
frag-10
ments or porphyroclasts with inherited defect-density can further proceed due to gra-dients in stored strain energy. The observation that the recrystallized area exceeds the area of original highly damaged zones after annealing at high temperature (≥900◦C) and time (≥69 h) may indeed be explained by ongoing strain-induced grain boundary
migration after the complete replacement of the highly damaged zones.
15
Our data set is clearly affected by the lower limit in resolution of the EBSD-based grain size analysis. Yet, the size of recrystallized grains is sufficiently large for growth to be resolved for annealing temperatures exceeding ≥900◦C. Grain growth is tradi-tionally modeled by laws of the form
d(t)m−dm
0 =kggt, (2)
20
where kgg=kgg,0exp(−Hgg/RT) (see, e.g. Drolet and Galibois, 1971; Simpson and Aust, 1972; Evans et al., 2001). At face value, the observed size evolution of re-crystallized grains is in fair agreement with predictions based on equation (2) using Karato’s (1989) experimentally derived parametersm=2,kgg,0=1.6·10
−8
m2s−1, and Hgg=160 kJ mol
−1
(Fig. 5c).
25
SED
5, 463–524, 2013Deformation and recrystallization of
olivine
C. A. Trepmann et al.
Title Page
Abstract Introduction
Conclusions References
Tables Figures
◭ ◮
◭ ◮
Back Close
Full Screen / Esc
Printer-friendly Version Interactive Discussion
Discussion
P
a
per
|
Dis
cussion
P
a
per
|
Discussion
P
a
per
|
Discussio
n
P
a
per
|
calculation of critical nucleus size indicated much smaller values, though, suggesting that starting grain size can be neglected in Eq. (2) for new grains. This reasoning may not apply to the recrystallized host fragments, though. Two alternative explanations de-serve consideration. Firstly, the apparent initial stagnation in grain size can simply be an effect of the convolution between the resolution limit of the EBSD analysis and the
5
true grain size distribution (indeed the majority of distributions decreases monotonically as expected for this type of resolution issue). The peaks of the distributions come close to or exceed the limit of resolution only for extended annealing at high temperature. For short durations and/or low temperature only the tail of the distributions is sampled. Secondly, continuous nucleation would also lead to an initial absence of growth since
10
the distribution functions would be continuously reloaded at their small-size end. Yet, we consider a significant continuous nucleation rate during annealing unlikely, because the “nuclei” in this type of recrystallization phenomena are actually formed during the deformation stage.
5.3 Kinetics of static recrystallization
15
Recrystallization from the deformed microstructure resembles a phase transformation (here the replacement of deformed material by grains with smaller dislocation density) involving overlapping and concurrent processes of nucleation, growth and impinge-ment. Transformation kinetics is frequently modeled relying on the so-called Johnson-Mehl-Avrami-Kolmogorov (JMAK) equation (e.g. Johnson and Mehl, 1939; Christian,
20
2002, Liu et al., 2004). Below we firstly apply previously presented versions of the JMAK equation to our data before deriving an extended version that accounts for the time dependence of the driving force for growth. The complexities of the spacial distri-bution of recrystallization features in heterogeneously deformed materials as the peri-dotite samples of this study cannot be accounted for in this modeling.
SED
5, 463–524, 2013Deformation and recrystallization of
olivine
C. A. Trepmann et al.
Title Page
Abstract Introduction
Conclusions References
Tables Figures
◭ ◮
◭ ◮
Back Close
Full Screen / Esc
Printer-friendly Version Interactive Discussion
Discussion
P
a
per
|
Dis
cussion
P
a
per
|
Discussion
P
a
per
|
Discussio
n
P
a
per
|
5.3.1 Conventional Avrami-analysis
For site saturation or continuous nucleation and isothermal conditions, the formation of new grains can be modeled by the conventional JMAK-kinetics equation
XV(t)=XA(t)=1−exp
−(ktranst)n (3)
whereXV(t) andXA(t) denote transformed volume and area fractions,t time, andnis
5
typically called the Avrami-exponent. The exponent depends on the dimensionality of growth and the rate-controlling process (e.g. interface vs. volume diffusion). Parameter ktrans is a rate constant assumed to have an Arrhenius-type temperature dependence, i.e.ktrans=ktrans,0exp(−Qtrans/RT) with an effective activation energy Qtrans that is not an activation enthalpy of a single atomistic process but reflects nucleation and growth
10
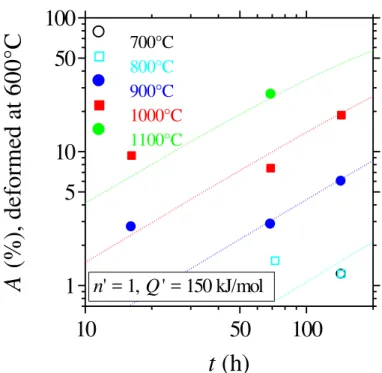
processes. At face value, our data suggest an Avrami-exponent close to 1 at least for extended annealing (Fig. 6) and an effective activation energy of∼150 kJ mol−1rather
independent of the temperature at which the deformation took place preceding the annealing stage.
An Avrami-exponent as low as 1 is at odds with the microstructural observation that
15
growth of grains occurs rather randomly in three dimensions. Spacial distribution of severely damaged material may reduce the dimensionality of growth to some extent but the very width and volume of the highly damaged zones clearly exceeds that of quasi-one-dimensional features. Such growth geometry is associated withn=3 and 4 for site saturation and continuous nucleation, respectively. Exponents also depend on
20
the process that controls the transfer of atoms from deformed grains to recrystallized grains (interface kinetics vs. diffusion kinetics) but we suppose that the growth of re-crystallized grains is diffusion controlled. Recent modifications of the JMAK-equation considered complex nucleation scenarios (Kempen et al., 2002; Liu et al., 2004) and yield time dependent exponents and activation energies. We however consider that
25
SED
5, 463–524, 2013Deformation and recrystallization of
olivine
C. A. Trepmann et al.
Title Page
Abstract Introduction
Conclusions References
Tables Figures
◭ ◮
◭ ◮
Back Close
Full Screen / Esc
Printer-friendly Version Interactive Discussion
Discussion
P
a
per
|
Dis
cussion
P
a
per
|
Discussion
P
a
per
|
Discussio
n
P
a
per
|
5.3.2 Extension of Avrami-analysis for time dependent growth rate
We consider the situation that all nuclei are already formed before the heat treatment started but account for the time dependence of the growth rate of nuclei ˙G, or their boundary velocityv(t)=G. Then, the transformed volume fraction evolves according˙ to
5
XV(t)=1−exp
−f N
t
Z
0
v(τ)dτ
3
(4)
where f denotes a shape factor and N the number of nuclei present (see also Luo, 2012). The exponent of 3 represents three-dimensional growth. For simplicity we consider isotropic growth of spherical particles, i.e. f =4π/3. The positive ar-gument of the exponential function in (4) represents the extended volume ratio, i.e.
10
XV(t)=1−exp
−Xext
withXext=Vext/V.
In the context of static recrystallization of deformed materials, the driving force for grain boundary migration is the difference in dislocation density of the growing nuclei and their environment, the deformed material. We may assume that the dislocation density of the growing nuclei remains negligible during progressing annealing since
15
static annealing excludes further deformation. Thus, the current dislocation densityρ(t) (note, for the sake of presentational simplicity we drop the index “rec” for the size of recrystallites and the index “def” for the dislocation density of deformed material used in Eq. (1) in the following) of the relics of deformed material determines the driving force (reduction in free energy due to consumption of dislocations by moving grain
20
boundaries, i.e.F = ∆G)
F(t)≃ − γ
d(t)+µb 2ρ(t).
(5)
SED
5, 463–524, 2013Deformation and recrystallization of
olivine
C. A. Trepmann et al.
Title Page
Abstract Introduction
Conclusions References
Tables Figures
◭ ◮
◭ ◮
Back Close
Full Screen / Esc
Printer-friendly Version Interactive Discussion
Discussion
P
a
per
|
Dis
cussion
P
a
per
|
Discussion
P
a
per
|
Discussio
n
P
a
per
|
χ >0. Here, we further rely on the standard linear relation between velocity and driving force (e.g. Ballufi et al., 2005)
v(t)=mgbF(t)≃χ mgbµb2ρ(t) (6)
in which the mobilitymgb= ΩD/δRT (with molar volume Ω, grain boundary diffusion coefficient D=D0exp(−Hgg/RT), and grain boundary width δ) assuming that the
ki-5
netics of boundary migration can be described by an intrinsic boundary mobility in-dependent of the actual driving force. Vandermeer et al. (1997) explicitly showed for copper that the grain boundary mobility does not differ for curvature-driven growth and strain-induced growth.
The next step in our derivation of transformation kinetics is to specify the reduction in
10
dislocation density with time due to recovery. Typically, the rate of change in dislocation density is proportional to some positive power of dislocation density (e.g. annihilation requires encounters of dislocations, the number of encounters is the higher the higher their density; see for example Nes, 1995; Liu and Evans, 1997)
˙
ρ∝ρp. (7)
15
For first (p=1) and second (p=2) order reaction kinetics, integration yields specifically
ρ(t)=ρ0
(
exp (−Bt) forp=1 1
1+K ρ0t forp=2,
(8)
when choosingt0=0 for convenience. The two reaction constants reflect the intrinsic activation of the rate-controlling recovery process, i.e. B=B0exp(−Hρ/RT) and K =
SED
5, 463–524, 2013Deformation and recrystallization of
olivine
C. A. Trepmann et al.
Title Page Abstract Introduction Conclusions References Tables Figures ◭ ◮ ◭ ◮ Back Close
Full Screen / Esc
Printer-friendly Version Interactive Discussion Discussion P a per | Dis cussion P a per | Discussion P a per | Discussio n P a per |
K0exp(−Hρ/RT). The relative extended volume calculates as
Xext=V
ext trans V = 4 3π N V
χ mgbµb2
3
ρ30
t R 0
exp (−Bτ) dτ
!3
forp=1
t
R
0 dτ 1+K ρ0τ
!3
forp=2
(9)
and upon integration one finds the transformation to proceed according to
XV(t)=1−
exp −Aρ 3 0
B3 [1−exp (−Bt)]
3
forp=1
expn−A
K3
ln (1+K ρ0t)
3o
forp=2
(10)
where we introducedA=4πη(χ mgbµb 2
)3/3 with the nucleus densityη=N/V.
5
In contrast to the classical JMAK theory the extended volume may reach a limit of
lim
t→∞XV(t)=1
− exp −Aρ 3 0 B3
forp=1
expn−A
K3
o
forp=2
(11)
when the driving force is lost due to recovery before the recrystallization came to com-pletion (Fig. 14). Substantial recrystallization occurs in a rather limited window of about one order of magnitude in dimensionless time. The associated characteristic
recrys-10
SED
5, 463–524, 2013Deformation and recrystallization of
olivine
C. A. Trepmann et al.
Title Page
Abstract Introduction
Conclusions References
Tables Figures
◭ ◮
◭ ◮
Back Close
Full Screen / Esc
Printer-friendly Version Interactive Discussion
Discussion
P
a
per
|
Dis
cussion
P
a
per
|
Discussion
P
a
per
|
Discussio
n
P
a
per
|
The effective Avrami parameters can be determined according to
n′
= d
dlntln
ln
1 1−XV(t)
and
Q′
=−R d
d(1/T)ln
ln
1 1−XV(t)
.
(12)
After algebraic manipulation, we find the exponent as
n′
=
( 3Bt
exp(Bt)−1 forp=1 3
ln(1+K ρ0t)
K ρ0t
1+K ρ0t forp=2
(13)
and the activation energy as
5
Q′
=3Hgg+(n
′
−3)Hρforp=1, 2 (14)
assuming that the temperature dependence of the diffusion coefficient, i.e. D∝
exp(−Hgg/RT) dominates the temperature dependence of the grain boundary
mobil-ity mgb. Initially, the change in growth rate is negligible and thus the classic Avrami parameters, an effective exponent of 3 and an effective activation energy of 3Hgg, are
10
found. With increasing time recovery becomes rate-relevant. The effective exponent decreases from 3 to 0, for either order but second order kinetics yields a very slow decrease towards the end of the recrystallization process (Fig. 15a). The effective acti-vation energy is ultimately given by the difference 3(Hgg−Hρ) (Fig. 15a). Thus, even for a very simple nucleation scenario as considered here (site saturation), effective Avrami
15
parameters can be significantly time dependent when the driving force for growth ex-hibits a temporal evolution. Thus, small Avrami exponents do not necessarily indicate a low dimensionality of growth. Effective activation energies are not easily interpreted either, owing to the two fundamental thermally activated processes that contribute to the kinetics of recrystallization, boundary migration and recovery.
SED
5, 463–524, 2013Deformation and recrystallization of
olivine
C. A. Trepmann et al.
Title Page
Abstract Introduction
Conclusions References
Tables Figures
◭ ◮
◭ ◮
Back Close
Full Screen / Esc
Printer-friendly Version Interactive Discussion
Discussion
P
a
per
|
Dis
cussion
P
a
per
|
Discussion
P
a
per
|
Discussio
n
P
a
per
|
5.4 Quantitative analysis
Thanks to the large number of studies on various aspects of the kinetics of deforma-tion and recovery processes operative in olivine aggregates one can actually attempt a quantitative analysis of the extended Avrami equation presented above. Instead of performing a numerical parameter search by an inversion procedure or the like, we
5
rather investigate the basic relations among the involved model parameters and their general capability of modeling our observations. This strategy is motivated by the sig-nificant non-linearity of the multi-parameter problem. The questions that we want to answer are which requirements are posed on the involved kinetics parameters for the basic observations to be in accord with model predictions and whether these
require-10
ments are compatible with currently available constraints on the involved parameters. The basic observation that we consider is the combined occurrence of effective Avrami parameters,n′∼1 andQ′∼150±50 kJ mol−1, at recrystallized volume fractions
ofXV ∼1. We do face the issue here that volume ratios should probably be calculated relative to a volume representing deformed material rather than the entire sample
vol-15
ume but the distinction of reference is of subordinate relevance for our order of magni-tude analysis. SolvingXV(t0.1)=0.1 according to Eq. (10) for the timet0.1at which 10 % recrystallization is reached and then analyzingn′
(t0.1) gives the following approximate constraints on the involved kinetics parameters:
B A1/3ρ
0
≃0.84
ln
1 0.9
1/3
≃1.8 forp=1and (15)
20
K
A1/3 ≃2.8
ln
1 0.9
1/3
≃6.0 forp=2. (16)
Furthermore, the effective activation energy provides a constraint on the relation be-tween the activation enthalpies of grain boundary migration and recovery for n′
SED
5, 463–524, 2013Deformation and recrystallization of
olivine
C. A. Trepmann et al.
Title Page
Abstract Introduction
Conclusions References
Tables Figures
◭ ◮
◭ ◮
Back Close
Full Screen / Esc
Printer-friendly Version Interactive Discussion
Discussion
P
a
per
|
Dis
cussion
P
a
per
|
Discussion
P
a
per
|
Discussio
n
P
a
per
|
150 kJ mol−1
∼3Hgg−2Hρ. (17)
Finally, we require that for the investigated temperature range recrystallization actually occurs on laboratory time scales, i.e. the characteristic time of transformation ought to be
5
trec= 1 A1/3ρ
0
∼105±1s (18)
for first and second order kinetics.
The time of occurrence of recrystallization provides a direct constraint on the order of magnitude of grain-boundary mobility, i.e.mgb∼3.4×10
−19±1
m4J−1s−1/χ. This es-timate seems to range at the lower end of (or actually falls short of) previously reported
10
values for grain-boundary mobility (Fig. 16a). Yet, apart from uncertainties in the es-timates of nucleus density and initial dislocation density (lower than assumed values in either of the two lead to larger values in predicted grain-boundary mobility), driving-force parameterχ as well as grain-boundary energyγ play crucial roles in this compar-ison. Experimentally determined grain-growth constants have to be converted to
mobil-15
ity using a geometrical constant as well as grain-boundary energy, i.e.mgb=kgg/8γ. In particular the early phases of the recrystallization process may involve subgrains with interfacial energies orders of magnitude smaller than the assumed value of 1 J m−2 valid for large-angle grain boundaries. The mobility would be correspondingly larger.
Various constraints on grain boundary mobility in olivine aggregates are available.
20
We focus on the grain growth law reported by Karato (1989), the range of mobility pre-sented in the review by Evans et al. (2001), and a recent quantitative estimate derived from analyzing piezometric relations of olivine aggregates (Hackl and Renner, 2013). For the temperature range of our experiments a spread of 10−18 to 10−11m4J−1s−1is indicated (Fig. 16a). The corresponding activation enthalpies are∼160 kJ mol−1 and
25