www.atmos-chem-phys.net/12/6609/2012/ doi:10.5194/acp-12-6609-2012
© Author(s) 2012. CC Attribution 3.0 License.
Chemistry
and Physics
Observations and modelling of microphysical variability,
aggregation and sedimentation in tropical anvil cirrus
outflow regions
M. W. Gallagher1, P. J. Connolly1, I. Crawford1, A. Heymsfield2, K. N. Bower1, T. W. Choularton1, G. Allen1, M. J. Flynn1, G. Vaughan1, and J. Hacker3
1Centre for Atmospheric Science, SEAES, University of Manchester, UK 2NCAR, P.O. Box 3000, Boulder, CO, 80307-3000, USA
3School of the Environment, Flinders University, GPO Box 2100, Adelaide 5001, Australia
Correspondence to:M. W. Gallagher ([email protected])
Received: 28 July 2011 – Published in Atmos. Chem. Phys. Discuss.: 22 August 2011 Revised: 8 June 2012 – Accepted: 18 June 2012 – Published: 26 July 2012
Abstract. Aircraft measurements of the microphysics of a
tropical convective anvil (at temperatures∼ −60◦C) form-ing above the Hector storm, over the Tiwi Islands, North-ern Australia, have been conducted with a view to determin-ing ice crystal aggregation efficiencies from in situ measure-ments. The observed microphysics have been compared to an explicit bin-microphysical model of the anvil region, which includes crystal growth by vapour diffusion and aggregation and the process of differential sedimentation.
It has been found in flights made using straight and level runs perpendicular to the storm that the number of ice crys-tals initially decreased with distance from the storm as ag-gregation took place resulting in larger crystals, followed by their loss from the cloud layer due to sedimentation. The net result was that the mass (i.e. Ice Water Content) in the anvil Ci cloud decreased, but also that the average particle size (weighted by number) remained relatively constant along the length of the anvil outflow. Comparisons with the explicit microphysics model showed that the changes in the shapes of the ice crystal spectra as a function of distance from the storm could be explained by the model if the aggregation effi-ciency was set to values ofEagg∼0.5 and higher. This result
is supported by recent literature on aggregation efficiencies for complex ice particles and suggests that either the mecha-nism of particle interlocking is important to the aggregation process, or that other effects are occuring, such as enhance-ment of ice-aggregation by high electric fields that arise as a consequence of charge separation within the storm.
It is noteworthy that this value of the ice crystal aggre-gation efficiency is much larger than values used in cloud resolving models at these temperatures, which typically use E∼0.0016. These results are important to understanding how cold clouds evolve in time and for the treatment of the evolution of tropical Ci in numerical models.
1 Introduction
The microphysical properties of Ci, such as the number, size and shape of ice crystals within them, are central to their ra-diative properties. Consequently, it has been suggested the representation of ice clouds is a key factor to reduce uncer-tainties in the prediction of climate change (Mitchell et al., 2008). Mitchell et al.’s study, which utilised a GCM, sug-gested that the areal Ci coverage and therefore their net ra-diative properties calculated by the GCM are sensitive to the ice crystal number concentrations within the Ci, both of these showing a global change of 5.5 % and a change of−5 W m−2
respectively for only moderate changes in the assumed ice PSD within the GCM.
It is known that the ice crystal number concentration and hence the size and fall-speed of the ice crystals within Ci clouds are strongly affected by the formation rates of ice crystals at the temperatures in which the Ci are formed. In the case of anvil Ci a large proportion of ice may be trans-ported from lower levels by convection. Ice formation rates within the Ci are affected by homogeneous or heterogeneous nucleation on particles that reside in the UTLS and also by the kinetic limitation of the growth of small ice crystals once nucleation has occurred. There has been a proliferation of studies into both of these processes over the past 10-20 years (M¨ohler et al., 2003, 2006; Connolly et al., 2009b; Cziczo and Abbatt, 2001; Archuleta et al., 2005; Lohmann et al., 2008, to name but a few).
Less studied, although still of recognised importance to the ice crystal number concentrations and fall-speed of ice particles, are the processes of aggregation and sedimenta-tion within Ci clouds. Perhaps this has been because ice-aggregation was long thought to be an inefficient process at temperatures below ∼ −30◦C (Hosler et al., 1957). How-ever, it is clear from the First ISCCP and EMERALD cam-paigns that both mid-latitude and tropical Ci outflow do con-tain many ice-aggregates (Kajikawa and Heymsfield, 1989; Gallagher et al., 2005b; Connolly et al., 2005a). Although ice-aggregates were noted in the tropical Ci outflow study of Connolly et al. (2005a), they could not determine whether the aggregation occurred within the Ci in situ or whether the ag-gregates formed at higher temperatures and were detrained.
Here we present a case study of the microphysical varia-tion observed within Ci generated in tropical anvil outflow, which enables us to advance the question of whether ice-aggregation occurs efficiently within tropical anvil outflow. We also present data to show and discuss the transition of the outflow Ci to background conditions and, upon further cooling, the regeneration of the Ci by what may be otherwise classified as in situ Ci formation processes.
2 Background
In general previous studies (e.g. Whiteway et al., 2004a) have focused on two different types of Ci cloud: thin semi-laminar Ci associated with in situ formation by synoptic and mesoscale processes; and those originating from deep con-vection, which form a Ci outflow close to the tropopause.
Tropical anvil Ci form at the top of deep (Cb) clouds, con-sisting initially of ice “debris”, that spreads out laterally from the convective storm cells, with the larger ice particles be-ing removed rapidly by sedimentation. Further sedimentation and possibly aggregation then dominate the removal of ice number in the anvil downwind of the convective centre. In the tropics these anvils give way to new in situ generated Ci at the tropical tropopause and form extremely widespread cloud layers of several hundreds to thousands of kilometres in ex-tent, thus contributing to large-scale radiative effects (Collins
et al., 1996) and transitioning to in situ generated Ci. It is of relevance, therefore, to review the conceptual view of in situ generated Ci before looking at tropical anvil outflow Ci.
2.1 In situ generated cirrus
The prevalent conceptual model of in situ generated Ci has been well described by Heymsfield and Michelsen (1995); Heymsfield and McFarquhar (2002) in which three distinct layers are identified. This conceptual model was based origi-nally on in situ Ci ice particle size distribution measurements made during the FIRE-I experiment (e.g. Gultepe and Starr, 1994) using aircraft Lagrangian spiral descents and in the FIRE-II experiment using balloon-borne ice crystal replica-tors (Miloshevich and Heymsfield, 1997). It was observed that average ice crystal sizes increased steadily from near cloud top towards cloud base. From the observed vertical dis-tribution of ice crystal PSD and detailed photographs of their habits it was inferred that these Ci can be represented, con-ceptually, by the following three layers with broadly distinct characteristics:
– Layer 1: The “nucleation layer” in the uppermost part of the cloud is composed of small ice crystals, or proto-crystals, typically proto-bullet rosettes. In this layer ice production occurs when the RH exceeds some critical value necessary for ice nucleation. Ice crystals in this layer are often up to a few tens of micrometers in size;
– Layer 2: The “Growth layer” which is much thicker and comprised of ice crystals which present pristine habits due to sufficient ice super-saturation (Sice) that allows
sustained ice crystal growth to large sizes, typically sev-eral hundreds of microns in length, but sometimes ex-ceeding 1-2 mm;
– Layer 3: The “Sublimation layer” where conditions of ice sub-saturation (Sice<1) cause sublimation and
eventually complete evaporation of the ice crystals falling from the layer above. In this layer ice crystals often present as rounded forms and are more difficult to classify than those in layer 2.
If we consider the nucleation layer there is evidence from controlled lab studies replicating conditions near the TTL, that, depending on the vertical velocity and actual tempera-ture profile, the nucleation could be either discrete or stochas-tic (Broadley et al., 2012). In this case polycrystal habit for-mation will occur presenting mainly as pristine bullet rosettes or less frequently hexagonal plates. The thickness of layer 3 depends on the IWC and the PSD near the base of layer 2 as well as the RH and temperature profiles below layer 2.
in studies of Ci formed in low updraught regions, e.g. frontal Ci in the sub-tropical UTLS (e.g. during the EMERALD-I project; Gallagher et al., 2005a).
2.2 Tropical anvil outflow
Observations during the EMERALD-II campaign (and oth-ers) have shown anvil Ci to consist of many plate-like aggre-gate crystals, that tend to arrange in chains (Connolly et al., 2005a). The linear shape of the ice particle aggregates has led to the suggestion that the electric field enhances the length of time that the crystals come into contact, following which the process of sintering (e.g. Hobbs, 1965) can take place and form a strong bond between the two ice crystals. If true this is an important mechanism affecting the lifetime of Ci; how-ever, laboratory measurements of the bonding between two ice spheres suggests that aggregation does not happen at such cold temperatures (Hosler et al., 1957), which are typical of the tropical tropopause.
The dynamical structure of thunderstorm outflow anvils is of relevance and ha s been discussed extensively (e.g. Lilly, 1988). Its evolution is described as a two-stage process. The initial outflow region is analogous to a wake collapse phenomenon with the addition of differential heating pro-vided by infra-red radiation, whereby an approximately uni-formly buoyant cold air intrusion into a stably stratified layer takes place. Vertical constraint of the intruding plume by the local environmental stability leads to its external collapse. The wake formed by the collapsing intruding plume flat-tens and spreads horizontally, the expansion slowing as the flow stabilises. Internal collapse of the near isotropic turbu-lence within the plume also leads to transformation of tur-bulent energy into larger scale wave motion dominated by two-dimensional turbulence as the plume flattens.
However, much of the uncertainty in models of storm out-flow development and influences on radiative forcing cen-tre on whether the subsequent mixed layer can fully develop before most of the ice within it has precipitated out (Lilly, 1988). Starr and Cox (1985) suggest precipitation is impor-tant for the plume development and radiative heating impact, reducing the optical path and hence radiative effect. However it can also produce below cloud evaporative cooling main-taining downward growth (an effective dehydration mecha-nism, Danielsen, 1982), but reducing turbulent energy gener-ation. Thus, after moving away from the convective core the turbulence within the Ci outflow tends to decay away.
Microphysically, in comparison to in situ generated Ci the initial anvil Ci at and near the top of a Cb outflow presents a larger range and variation in ice crystal sizes and shapes due to the influence of aggregation following heterogeneous ice nucleation in the convective cell up-draughts. However, it is very difficult to sample these regions in situ with sufficient detail (Takahashi, 1995; Boussaton et al., 2004).
There is also evidence, as the anvil Ci start to thin out and transition to the background environment, that upon further
cooling new in situ Ci, as described in Section 2.1, may be generated. The extent to which new ice particle nucleation and growth contributes to the outflow structure has not been examined in detail, particularly the interaction with environ-mental air in the lateral parts (i.e. “wings”) of the anvil re-gion.
3 Description of experimental flights and environment
We present in situ airborne microphysical measurements conducted as part of the ACTIVE experiment, during a typ-ical “Hector” deep convective storm which formed over the Tiwi Islands (Bathurst and Melville Islands), to the North of Darwin, Australia (12.47◦S, 130.85◦E). The case presented
(AE13) is from 9 December 2005, which is during the Aus-tral summer and was in the pmonsoon period for that re-gion. The meteorological, as well as regional climate, context of the experiment in which this case study was conducted is comprehensively described by Vaughan et al. (2008). A statistical analysis of the thermodynamic characteristics of Hector storms in this region during this period can also be found in May et al. (2009), while the aerosol conditions in the local vicinity of Hector during this period were relatively homogeneous (Allen et al., 2008). In addition, CRM studies of Hector from the ACTIVE campaign are described by Zhu et al. (2012).
The ACTIVE experiment was explicitly designed to study the transport of water vapour, aerosols and chemicals into the tropical UTLS focusing on the inflow and outflow of deep tropical convective systems as a mechanism generating this transport. However, in situ cloud microphysical measure-ments were also conducted to delineate the anvil cloud extent and to place new aerosol particle nucleation processes in con-text. The full experimental design, the study region and de-tails of the aircraft platforms as well as the instruments used are described in detail by Vaughan et al. (2008).
During flight AE13, the Hector storm anvil Ci existed mainly between 11.5 and<15 km altitude. A series of pene-trations were made by the ARA high altitude Egrett aircraft between 14:30 and 17:00 local time during the anvil devel-opment. Penetrations were conducted perpendicular to the storm outflow region (see Figs. 1 and 2) and confined to a near constant altitude, 12.5–13.25 km, with average temper-atures of−58◦C. This represents mainly the base of the
Fig. 1.Cirrus penetration flight tracks 1 to 4 during case study AE13 (on 2005/12/09). The flight track is shown on a map of the Darwin region and Melville and Bathhurst islands in the Beagle Gulf. Darwin city is labelled in red. The aircraft flight tracks are colour coded according to the IWC (g m−3) that was estimated from the CIP probe. Wind-barbs show the wind direction to be easterly and∼15−25 m s−1at the altitude of the aircraft when it was making the cloud penetrations.
the aircraft at the sampling altitude were reported to be con-stant easterlies at 15–20 m s−1whilst in the inflow region of
the storm, NE of the islands, the flow was reported to be ap-proximately NE. The observations here represented Ci ages ranging from 1–3 h subsequent to storm initiation.
The Hector storm and its development on this day is shown in the corresponding MTSAT-1R image in Fig. 2, which is centred on the Darwin study region. Examination of the brightness temperature variation through a sequence of such images revealed evidence of convectively generated gravity waves (associated with deep convection observed upwind) propagating to the West and SW of the storm centre as high-lighted in Fig. 2. There is also evidence of some convective regeneration leading to convective turrets within the anvil outflow in Fig. 2. This may influence the subsequent anal-ysis to some extent, which is described below. One of the noteworthy features of the outflow on this occasion is the large scale horizontal wave structure in the outflow leading to transverse asymmetry in the delineated anvil Ci. Towards the end of the experiment a second weaker storm developed to the south over Charles Point and the Beagle Gulf, to the West of Darwin but the outflow Ci there remained separate from Hector.
3.1 Instrumentation
The instruments used to determine the Ci bulk and micro-physical properties in this study were; a CPI probe (Model Version 003, Stratton Park Engineering Company, SPEC, USA) (see e.g. Lawson and Baker, 2006); a Cloud, Aerosol and Precipitation Spectrometer (CAPS, manufactured by Droplet Measurement Technology, DMT), described by
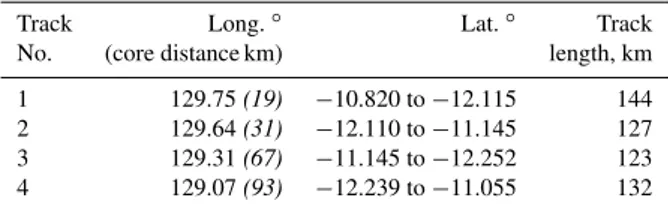
Table 1.Track Longitude, Latitude and Track lengths.
Track Long.◦ Lat.◦ Track
No. (core distance km) length, km
1 129.75(19) −10.820 to−12.115 144
2 129.64(31) −12.110 to−11.145 127
3 129.31(67) −11.145 to−12.252 123
4 129.07(93) −12.239 to−11.055 132
Baumgardner et al. (2001); and a CDP (CDP-100, Version 1, DMT).
− − − 14:00
−
−
− − −
− 14:30
− −
−
−
− − 15:00 −
−
−
−
− − 15:30 − −
−
−
−
− 16:00
−
− − − −
− 16:30− −
−
−
− − 17:00 − −
−
−
− − 17:30 −−−
Fig. 2.MTSAT 1R image showing a Hector storm developing, north of Darwin and the Ci outflow for the ACTIVE case study of AE13 on 2005/12/09 from 03:33–06:16 UTC. Melville and Bathurst islands are highlighted and the flight track of the Egrett (with times) is shown in red. Also visible from the satellite image were gravity waves propagating out from the convective region (highlighted in yellow). These gravity waves are not the subject of this study.
small ice particles within the uncertainty constraints of the particle refractive index and shape. CAPS also houses a hot-wire liquid water content probe, but this was not used in this study due to its focus on the ice phase. The CDP is an open path version of the cas which covers the size range between 2–50 µm.
The SPEC CPI probe records 256 level grey scale CCD images of ice crystals with dimensions in the range∼10– 1800 µm. An algorithm was developed to correct for over sizing due to particles lying outside the depth of field of the instrument and for quantifying the probe sample volume, which is particle size dependent, as described by Korolev (2007) and Connolly et al. (2007). The probe sample vol-ume may also depend on other factors such as inefficiencies in the particle detection and camera triggering system due to misalignment although this can be overcome by operating the instrument in the absence of the detection system and us-ing so-called “continuous trigger” mode whereby the camera is allowed to “free-run”. The inherent resolution of the CCD camera (2.3 µm) in the CPI limits the accuracy of habit iden-tification to particles with dimensions greater than∼40 µm in size. Whilst capable of providing high resolution 256 grey scale images of ice particles, useful for identifying ice crystal habits, the major limitation of the CPI is its sample volume, which is typically∼0.0026 l s−1 (maximum) compared to the CAPS CIP25 and similar 2-D imaging probes for which it is typically∼>5 l s−1. This necessitates integrating CPI PSD
measurements over typically 10 second periods in most Ci conditions. However, in conditions when very low
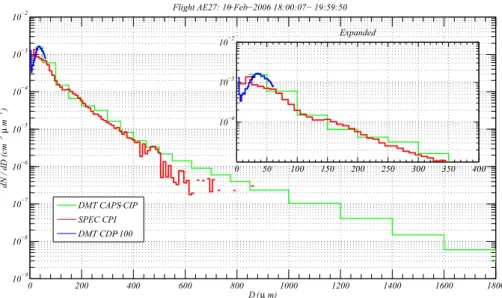
concen-trations of large ice crystals occur (sizes greater than a few hundred µm), averaging times of minutes may be required to reduce statistical counting errors to acceptable levels (see e.g. Baran et al., 2009). To overcome this we use the CAPS- CIP instrument which affords 1 Hz PSD and IWC although for this study 5 s integrations were used. The corrected PSDs, when averaged over individual flight tracks, were found to be in generally good agreement between the two instruments, with slightly poorer agreement in the size rangeD <50 µm andD >200 µm (see Figs. 3 and 7, inset). The reasons for the poorer agreement at the lower size are recognised and thought, in this case, to be due to instrument response times and sample volume uncertainties.
In this work we focus mainly on ice crystal images re-ported by the CPI and IWC and PSD measurements made by the CAPS instrument, which covers the size range between 2 to 1600 µm.
3.2 Data analysis and uncertainties
Ice water contents were computed from the CAPS- CIP PSD, integrated typically over 5 seconds, assuming an ef-fective ice crystal density, ρe, and using the habit depen-dent mass-dimensional relationship, described by Heyms-field et al. (2004). This is of the formm(D)=3.4709D2.6 (withDin microns andm(D)in kg) whereD is the maxi-mum particle dimension. Note that this is valid for particles
0 200 400 600 800 1000 1200 1400 1600 1800 10−9
10−8 10−7 10−6 10−5 10−4 10−3
10−2 Flight AE27: 10−Feb−2006 18:00:07 − 19:59:50
dN / dD (cm
−3µ
m
−1)
D (µ m) DMT CAPS−CIP
SPEC CPI DMT CDP−100
0 50 100 150 200 250 300 350 400
10−4 10−3
10−2 Expanded
Fig. 3.Particle size distribution measurement comparison observed between the DMT CAPS- CIP; the SPEC CPI and the DMT CDP (2< D <62 µm) instruments for particle size range 0< D <1800 µm and 0< D <400 µm (expanded plot). All probes show reasonable agreement; however, the CPI is limited by poor counting statistics at the larger particle sizes (as can be seen in the plot).
classification criteria and methods for calculating ice masses by Heymsfield et al. (2004, 2002) and are summarized for crystal habits relevant to other imaging probes (e.g. CPI) by Baran et al. (2009). The CIP size distributions were used to produce estimates of IWC through the mass vs size relation suggested by Heymsfield et al. (2004):
IWC= N X
1
NiαDiβ (1)
whereNi (m−3) is the concentration in bini,α=3.4709 is the multiplier of the mass-size relation,Di (µm) is the mid-point diameter of bini, andβ=2.6 is the index in the mass size relation. IWC is in kg m−3in this equation.
In addition, five ice crystal habit classification criteria were used to analyse the CPI particle images and are incorporated in analysis software developed by SPEC, Inc. (Lawson and Baker, 2006; Lawson et al., 2006). The individual classifica-tions and criteria are summarized in Baran et al. (2009) along with the associated equations for mass calculation and are: ‘sph’ or spherical particles; “col” or columnar particles; “plt” or plate-like particles; “sir” or small (i.e.D <200 µm) irreg-ular particles; ‘bir’ or big (i.e.D≥200 µm) irregular parti-cles. The variation in particle habits will be presented later in the paper; however, for the most part, the automated classifi-cation scheme determined the crystal shapes to be irregular. This reflected the fact that the crystals have complex growth histories and are also aggregated ice particles.
To identify significant spatial changes in microphysical behaviour the ice crystal PSDs were parameterised using a simple gamma distribution, Eq. (2) (e.g. Field et al., 2007).
dN dD=n0D
µŴexp(−λ
0D) (2)
in this simple parametric equation,N is the ice crystal con-centration (m−3),D(m) the maximum crystal dimension,n0
(m−4) is the so called “intercept” parameter andλ
0(m−1) is
the “slope” parameter which describes the contribution to the particle population by large ice crystals;µŴ is the width of the distribution, which was assumed to be zero in this equa-tion, owing to the fact that the shape of the distribution was approximately exponential, although there was a slight bias to there being more small particles than for a true exponential distribution – Figs. 3 and 7.
For the analysis presented in Sect.4,λ0was determined by
fitting an exponential curve for a size distribution with the same total number and mass concentrations as the data. This resulted in:
λ0=
αN Ŵ (β+
1) M
(1/β)
(3)
whereαandβare constants in the mass-dimension relation-ship,N (m−3) and M (kg m−3) are the number and mass concentrations respectively andŴ (x)is the gamma function. λ0has units of m−1.
10−4 10−3 10−2 10−1 100 101 10−4
10−3 10−2 10−1 100 101
IWC CPI (g m
−3 )
IWC
CPI, L<110
µ
m
(g m
−3
)
Flight AE13: 09−Dec−2005
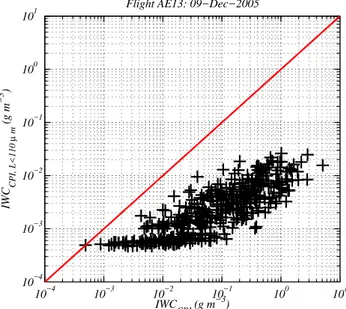
Fig. 4.Relative contribution of small ice crystals (maximum dimen-sion L<110 µm) to total IWC as determined with the SPEC CPI. It can be seen that the contribution from the small crystals is only significant at extremely low total IWC (<0.01 gm−3).
type, configuration and incept date of the instruments which are constantly being improved.
Uncertainties associated with ice PSD measurements in-clude limited sample volumes (e.g. the Cloud Particle Imager Lawson and Baker, 2006) insufficient grey scale informa-tion to correct for depth of field mis-sizing (e.g. CAPS-CIP, Baumgardner et al., 2001) probe dead time, probe triggering efficiency (particularly for small particles) and random col-lection within the instruments depth of field (Korolev, 2007; Connolly et al., 2007). More seriously they can be subject to artefacts, particularly in the small, sub 50 µm size range, due to ice particle shattering on aircraft as well as instru-ment surfaces, which has been demonstrated to be an issue for all such instruments (Korolev et al., 2011). These arte-facts appear to manifest particularly in the presence of signif-icant concentrations of large ice crystals (typically>4 mm). These measurement limitations are still being addressed and steps to minimize them are being generally adopted and de-pend on both operational, instrument and environmental con-ditions (Korolev et al., 2011; Field et al., 2007; Heymsfield, 2007), but they will continue to add to the general uncer-tainty associated with all such in situ measurements of small ice particles for the foreseeable future. The work by Korolev et al. (2011) suggests the CIP, and similar instruments de-spite being open path instruments, also suffer from ice shat-tering artefacts. There has been little quantitative information published on the effect particle shattering has on the CPI.
For the analysis of the ACTIVE experimental data pre-sented here the main assumption is that particle shattering, at least for the ARA aircraft platform, and the instruments used
(CPI and CAPS-CIP), will be limited to particles >50 µm which will have a small influence on the calculation of IWC. This assumption is justified having been demonstrated by a detailed analysis of data from similar CAPS-CIP and CPI in-struments flown on the DoE Proteus aircraft as part of the TWP-ICE experiment (McFarquhar et al., 2007). Figure 4 shows the contribution that ice crystals smaller than 110 µm have towards the total IWC as measured with the CPI. It can be seen that the small ice crystals only significantly con-tribute towards the total IWC when the total IWC is small, and their contribution can be ignored. The TWP-ICE ex-periment was conducted simultaneously with the ACTIVE experiment and flights were often conducted jointly by the two aircraft, and which flew near identical cloud instruments (comparisons between the aircraft are being reported else-where).
Figure 3 demonstrates a typical comparison between the open-path CAPS- CIP instrument on the Egrett (which is as-sumed to be less prone, but not immune, to shattering arte-facts) and the inlet based CPI (assumed to be more prone). The latter instrument, however, appears to be less sensitive (at least for the conditions reported here) to this artefact, likely due to the limited triggering efficiency of its detection system for small particles. It should be noted that the data in this figure have been integrated across a flight to improve sampling statistics and so cover a wide range of PSD condi-tions. Fig. 3 also shows the PSD measured by an open path Mie scattering spectrometer (DMT Cloud Droplet Probe, CDP-100 Version 1-2004, designed for sampling water PSD) mounted directly below the CAPS- CIP instrument, which again, considering the very different operating principles and resolutions, is encouraging, although there is a suggestion that the CPI underestimates concentrations below 50 µm. It is known that version 1 of the CDP suffers from under-counting issues for particle concentrations above approxi-mately 200 cm−3, in water clouds (Lance et al., 2010). These concentrations are much larger than reported in ice clouds. Differences between the CPI and CIP reported concentra-tions can, however, become more pronounced on shorter sampling time-scales depending on the PSD mode size. It is clear from these comparisons that for the conditions typ-ically encountered during ACTIVE the CPI measured PSD also become statistically limited for particle sizes>800 µm whereas the coarser resolution afforded by the CAPS- CIP (15 µm) will add to its uncertainties for small particles. We will expect the CPI PSD to be statistically less reliable for particle dimensionsD >100 µm if using<1 min integration periods compared to the CAPS- CIP and this limitation was mitigated in the subsequent analysis by optimizing the inte-gration time for the CPI. The effect of these different probe issues on uncertainty in deriving values ofλ0 (in Eq. 2) is
4 Results-microphysical horizontal structure variability
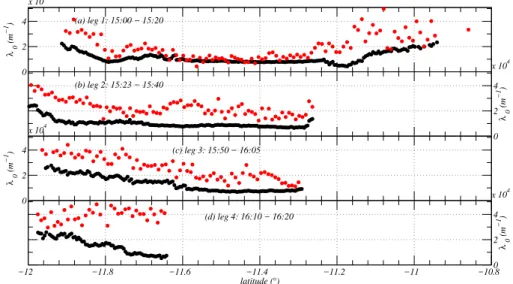
The spatial variation in observed PSD characteristics within the outflow region was investigated by examining the time histories of IWC (g m−3, derived using Equation 1) andλ0
(m−1) across each track along with the ice crystal habits pre-sented by the CPI images as a function of increasing down-wind distance from the convective core, taken from flight tracks transverse to the outflow (see Figs. 1 and 2). Fig-ure 5a–d and 6a–d show IWC andλ0 respectively, for each
flight leg as a function of latitude, and increasing distance) from the storm centre. Figure 5, show a general decrease in IWC with increasing distance due to ice loss by aggrega-tion and sedimentaaggrega-tion. Figures 6 show that, on average,λ0
does not change appreciably with increasing distance from the storm. This is due to the competing effects of aggrega-tion (producing larger particles) and sedimentaaggrega-tion (remov-ing the larger particles) on the evolv(remov-ing PSD although there was significant variability along the flight tracks.
Figures 5 and 6 suggest that there is a significant lateral shift in the core outflow region due to advection. Indeed there may have been two distinct outflow regions generated, as ev-ident by the drop in IWC, but this could also be due to the larger crystals falling out of the middle of the cloud. To ac-count for this when comparing with model predictions later we have computed average values of IWC andλ0within±
0.2◦ of latitude of the central outflow region to the south, and taken the core region as being represented by the peak in the IWC. This peak was also confirmed by the CPI measure-ments. As shown later this region was dominated by large ag-gregated ice crystals and the averaged values should be rel-atively unaffected by other processes such as re-nucleation which appears to occur and contribute to a greater extent in some regions of the outflow, as discussed later.
Flight leg 1, 19 km from the storm centre, displayed the highest IWCs, with median values>1 g m−3across the cen-tral outflow region although with low values of n0 (not
shown). Relatively speaking,λ0 (the slope of the
distribu-tion) is high when there are lots of small particles in the dis-tribution and low when there are more larger particles. It can be inferred that, sinceλ0is low in leg 1 (Fig. 6a), the
con-centrations of small ice crystals (at least within the detec-tion limits of the instruments) appear to contribute very lit-tle to the overall PSD. The PSDs in this region were clearly dominated by large complex aggregates comprised mainly of hexagonal plates (see Fig. 8a). These large aggregates even-tually sediment out downwind of the storm in the core region as can be seen by the slight increase inλ0with distance in
Figure 6a–d. In the lateral edges of the outflow there is some evidence thatλ0(andn0) increases as evaporation occurs at
the cloud edges. Most of the core region ice appears to have been precipitated within a distance of 30 km. Within track 2, IWCs peaked at>1 g m−3but showed greater variability. n0values (not shown) remained reasonably consistent across
the outflow (albeit with small scale variations) as did values of λ0 downwind of the outflow.λ0 did show enhancement
in several regions within track 4. In these regions the PSDs were dominated by higher concentrations of small ice crys-tals, which presented as small poly-cryscrys-tals, or proto-bullet rosettes (where in situ nucleation occurs) although this did not enhance concentrations appreciably in this case.
The mean PSDs of legs 1 to 4 from the CAPS-CIP are given in Fig. 7 and an inter-comparison of the CAPS-CIP and CPI PSDs from leg 1 is given in the inset plot of Fig. 7, which shows the probes to agree for L>200 µm although the CPI is statistically limited at larger sizes due to its small sample vol-ume as discussed previously. Another point worth mention-ing is that the exponential function did not fit the data well over the whole size distribution. When fitted to the whole size distribution the curve is biased to fitting the smaller sizes of the distribution. A similar fit was performed forD≥250 µm and is also shown in the inset plot of Fig. 7. At first glance one might expect that modified gamma distributions with a slight negative exponent may better fit the data; however, on closer inspection it became apparent that the size distri-butions represent two distinct regions of the cloud: the dis-tribution with high slope represents the cloud edges, where there are many small particles; whereas the distribution with a more shallow slope represents the cloud interior where the distribution is broader. Hence we did not try to produce better fits for this reason.
On inspection of the PSD in Fig. 7 it can be seen that, at all sizes, the number of particles decreases with distance from the core. Whilst aggregation may act to reduce the num-bers of small particles in the distribution, it would also be ex-pected to increase the numbers of large particles in the distri-bution; however, it must be recognised that the large particles may also sediment out of the cloud. Hence it would appear that both aggregation and sedimentation is occurring within the Ci outflow.
4.1 Habit variation
Images of the ice crystals recorded by the CPI corresponding to each flight leg are now considered in more detail. As dis-cussed the CPI processing software, CPIview, produces an automated habit classification of the ice crystal habit, in this instance: “sph”, “col”, “pla”, “sir” and “bir”. These are plot-ted in Fig. 8a–d for each successive flight leg. The images are presented in a matrix plotted as a function of latitude (◦)
0 1 2
IWC (g m
−3
) (a) leg 1: 15:00 − 15:20
0 1 2
IWC (g m
−3
)
(b) leg 2: 15:23 − 15:40
0 1 2
IWC (g m
−3
) (c) leg 3: 15:50 − 16:05
−12 −11.8 −11.6 −11.4 −11.2 −11 −10.80
1 2
IWC (g m
−3
)
(d) leg 4: 16:10 − 16:20
latitude (°)
Fig. 5.IWC (g m−3) determined by CIP (black) and CPI (red) across each flight leg 1–4,(a)–(d)as a function of increasing distance from the storm centre. There is a general decrease in IWC with distance as well significant lateral shift in core outflow. Note that the differences between the two probes arise because the CPI does not sample the large particles (due to poor sampling statistics) and the CIP does not sample the smaller particles (due to probe resolution).
0 2 4
x 104
λ0
(m
−1
) (a) leg 1: 15:00 − 15:20
0 2 4 x 10⁴
λ0
(m
−1
)
(b) leg 2: 15:23 − 15:40
0 2 4
x 104
λ0
(m
−1
) (c) leg 3: 15:50 − 16:05
−12 −11.8 −11.6 −11.4 −11.2 −11 −10.80
2 4 x 10⁴
λ0
(m
−1
)
(d) leg 4: 16:10 − 16:20
latitude (°)
Fig. 6.The derivedλ0(m−1) for each leg using both the CIP (black) and the CPI (red) as a function of latitude with each flight leg as a function of increasing distance from the storm (a)-(d). In generalλ0stays approximately constant, on average, with distance from the storm.
Note that differences inλ0between the two probes arise because of their different size-ranges (see Fig. 5 and text for discussion).
edges; however, at distances far from the core, where IWC was low, there is evidence of some ice particle nucleation.
The habit of the ice crystals in these transition regions is very different to those in the centre of the outflow, and present as small polycrystalline or proto-bullet rosettes which are clearly imaged by the CPI, most of which are <100 µm, although some have grown to significant sizes hav-ing fallen from higher in the cloud. However these crystals appear to have undergone very little, if any, aggregation. The patterns and extents of these zones are particularly evident in
0 200 400 600 800 1000 1200 1400 1600 1800 10−8
10−7 10−6 10−5 10−4 10−3 10−2 10−1
D (µ m)
dN/dD (cm
−3
µ
m
−1
)
0 200 400 600 800 1000 1200 1400 1600 180010
−8
10−7 10−6 10−5 10−4 10−3 10−2 10−1
Leg 1: 15:00 − 15:20
Leg 2: 15:23 − 15:40
Leg 3: 15:50 − 16:05
Leg 4: 16:10 − 16:20
Leg 1: 15:00 − 15:20 All: n
0 = 4.45× 10 9
m−4, λ
0=1.12× 10 4
m−1 D>250µ m: n
0 = 0.33× 10 9 m−4, λ
0=0.47× 10 4 m−1
CPI data
Fig. 7.Particle size distributions as determined with the CAPS-CIP for legs 1 to 4. Inset, CAPS-CIP size distribution for leg 1, showing exponential fits for all particles (black dashed-dot line) and also for particles withD≥250 µm (dashed black line). CPI size distributions are shown for comparison in red, showing exponential fits for all particles (black dashed-dot line) and also for particles withD≥250µm (dashed black line).
It is interesting that although the overall concentration of large aggregates decreases they still persist even as far down-stream as track 4, some 134 km. In addition, overallλ0
re-mains relatively constant (see Fig. 6). However, the reduc-tion in large aggregate contribureduc-tions after 20 km becomes clear, leading to a gradual decrease in IWC (Fig. 5). Figure 7 shows the CIP averaged number size distribution for each flight track as a function of distance from the storm centre and confirms this is the case.
If we consider the main processes governing new nucle-ation of ice particles in the anvil environment then key to this will be the precipitation of the larger ice-aggregates, so that, upon subsequent cooling, an increase in ambient ice super-saturation can be realised in the region depleted of ice-aggregates. This would subsequently allow ice nucle-ation by the freezing of haze. In this case the cooling may be due to the lifting associated with gravity waves (noted in Fig. 2), or for example through radiative destabilisation of the anvil (Ackermann et al., 1988). This would lead to both an increase in n0 in such regions coupled with
even-tual recovery inλ0through further aggregation. These
parti-cles, again due to the increased super-saturation, eventually grow into larger bullet-rosettes that are more characteristic of mature Ci e.g. as seen in frontal Ci. Fig. 10 shows de-tailed images of the complex chain aggregates of hexago-nal plates observed in similar anvil outflow which should be compared with the pristine ice crystal habits (mainly large bullet rosettes) recorded in typical frontal Ci, Fig. 11 (The bullet-rosettes in Fig. 11 were observed over Adelaide, Aus-tralia, during the EMERALD-I experiment, Whiteway et al., 2004b; Gallagher et al., 2005a).
Observations within tropical anvil clouds have noted many aggregates of ice crystals often form in linear chains (Con-nolly et al., 2005b). It is thought that a large majority of these aggregates originate within the storm, where tempera-tures are high enough for the cohesive properties of ice to be favourable. It is also thought that aggregation of the ice crys-tals may be enhanced by the electric field that is present due to the charge separation mechanism in thunderstorms. Davis (1964) calculated that gravitational settling would be the dominant collision mechanism for two conducting spheres, charged or uncharged, of mass similar to that of a typical cloud particle. Saunders and Wahab (1975) hypothesized that the electric field may enable two ice crystals to come together for long enough for them to sinter (Hobbs, 1965).
Observations from the ACTIVE project also show clear evidence of larger aggregates occurring downwind of the main area of convection of the Hector thunderstorm, thus suggesting that significant aggregation may occurwithinthe Ci itself. The temperature of the Ci investigated is approxi-mately−60◦C but it was previously thought that aggregation
would not be very efficient at these temperatures. If signifi-cant aggregation does occur at these temperatures it is im-portant to quantify as it may be an imim-portant contributory mechanism in determining Ci lifetime. Also worthy of men-tion, but not wholly relevant to this study was the fact that, on occasion in localised regions, bullet rosette type crystals were also observed in the outflow Ci.
100µm 100µm 100µm 100µm 100µm
(a) Leg 1
100µm 100µm 100µm 100µm 100µm
(b) Leg 2
100µm 100µm 100µm 100µm 100µm
(c) Leg 3
100µm 100µm 100µm 100µm 100µm
(d) Leg 4
Fig. 8.CPI unprocessed images recorded during cloud penetrations 1 to 4 perpendicular to the storm outflow with increasing distances, 19, 31, 67 and 93 km, figures(a)to(d)respectively, from the storm—see Table 1 for flight leg numbers and Figs 1 and 2 for the location of the aircraft during those legs. The crystal images observed are represented in a matrix with the horizontal axis split into 5 latitude bands of width 0.2◦, perpendicular to the outflow direction. The vertical axis is sorted as a function of the maximum ice crystal size (from 5 to∼1120 µm) observed in each latitude bin. The size scale at the top of each column represents 100 µm.
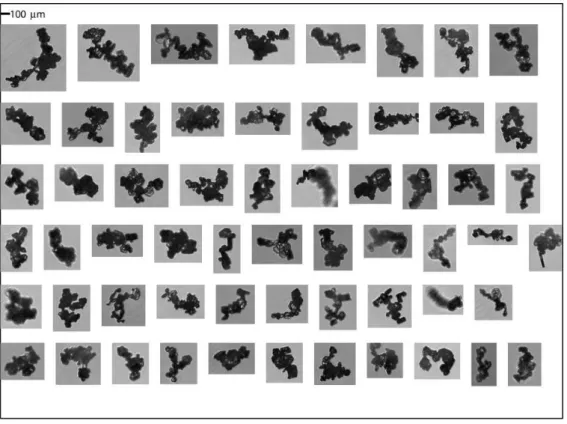
Fig. 10.Close up view of typical complex chain aggregates of hexagonal plates observed within a Hector storm outflow (temperatures
T <−50◦C) during the EMERALD-II experiment (Connolly et al., 2007).
Ci has to become relatively thin, due to the fall out of larger aggregates and (ii) some reasonable uplift must be present, (e.g. due to the presence of gravity waves).
4.2 Nucleation at the cloud edges?
Images of the ice particles in the Ci along the flight track show that the most prevalent types are aggregates of plates and columns (Fig. 8), which is consistent with Fig. 9, which shows ‘sir’ followed by “bir” being the dominant habits. The formation of these ice crystals likely occurred at the level where homogeneous freezing of pure water takes place (e.g. −36◦C Pruppacher and Klett, 1997) and quickly re-sulted in conditions close to ice saturation within the Ci cloud. There is evidence of additional vertical motion in the Ci, both from the in situ measurements and from the satel-lite imagery (Fig. 2), where gravity waves are observed. In the thick cloud close to the convection this does not result in any further nucleation of particles, because the ice present keeps the supersaturation in check; however, in leg 2, close to the cloud edge, the cloud becomes thin enough so that ver-tical motion can result in supersaturation and nucleation of existing aerosol particles at this level (as described by Koop et al., 2000, and others). The evidence for this is that the habit of these crystals, bullet-rosettes, is consistent with in situ growth of the ice crystals at this temperature (Bailey and Hal-lett, 2004). These habits were observed at the edges of the cloud during leg 2 (see Fig. 12). They are remarkably simi-lar to the crystals observed in frontal Ci during EMERALD-I (shown in Fig. 11); however, they did not appear to affect the concentration of ice crystals significantly during this case study.
Again, worthy of mention is that some of these bullet-rosette crystals appeared to be aggregated (see fifth image along top of Fig. 12, from left), suggesting that aggregation was actually occurringwithinthe Ci.
5 Model study
The evolution of the ice crystal PSDs within the axial re-gion of the anvil outflow was simulated using an explicit bin-aerosol-ice-microphysical model, based on the ACPIM. A description of the original model can be found in Con-nolly et al. (2009a) so only the key features relevant to this study will be repeated briefly here. The model incor-porates an aerosol and cloud particle moving centre multi-bin structure developed by Jacobson (2005) with mass con-servative, explicit liquid-ice, ice-ice collision, coalescence, riming and aggregation processes. Aggregation is described with the stochastic collection equation (see Pruppacher and Klett, 1997) and was solved using the algorithm based on Bott (2000), but adapted to be 2-moment (i.e. to carry both mass and number). The kernel applied was the gravitational
kernel described by Hall (1980): k(x, y)=Eagg
π 4(x+y)
2|u(x)−u(y)|
(4) wherex andy are the diameters of two particles,u(x), is the terminal fall speed versus diameter relation andEagg is
the aggregation efficiency – assumed to be a constant in this study – which is the product of the collision efficiency and the sticking efficiency. The ice mass-size relation used in the model follows Heymsfield et al. (2004) for consistency with the way the CPI and CIP observational data were treated, as described above, viz withmin kg andDin metres. In this study the terminal fall-speed versus diameter relation is as-sumed to be a power-law (i.e.vt=aDb). There are uncer-tainties in representing the fall-speeds in this way and sev-eral values of the parametersa andb have been published to date. In this study the sensitivity to the choice of terminal fall-speed relation is examined by performing model simula-tions with the parameters from both Ferrier (1994) and Mu-rakami et al. (1993). These were chosen because the Ferrier (1994) relation does not have much dispersion in velocities with size, whereas the Murakami et al. (1993) relation has more dispersion; hence, we would expect more aggregation in the Murakami et al. (1993) velocity-size relation. The Fer-rier (1994) relation is:
vt(D)=71.3×D0.664×
ρ
0
ρ 0.5
(5) whereρ0=1.2 kg m−3andρis the ambient air density. The
Murakami et al. (1993) relation is: vt(D)=700×D1×
ρ
0
ρ 0.35
(6) Condensation is treated explicitly in the model, whilst ice crystal growth and habits are treated using the model of Chen and Lamb (1994); however, due to complexities with initiisation ice crystals were assumed to be quasi-spherical, al-beit having a mass-dimension relation as described above. Ice nucleation can be represented in several different ways, either using the singular freezing hypothesis approach, us-ing the equations described by Connolly et al. (2009a), or a traditional stochastic nucleation approach. However, here the focus on the process of aggregation and its sensitivity to the aggregation efficiency,Eagg, within the axial region of the
anvil outflow. It is assumed contributions to the evolution of the PSD due to other processes in this core region, such as new particle nucleation, will be negligible. The model was run in both bin and bulk modes and compared with observa-tions; however, it was quickly realised that bin-microphysics was required for adequate comparisons owing to the more realistic treatment of differential sedimentation.
5.1 Model initialisation
100 µm
Fig. 12. CPI images at the edge of the cloud (−11.2≤Lat.≤ −11.1) during leg 2. Note that bullet-rosettes are observed in this region, which suggests that new ice crystals are being nucleated. This occurs in thin cloud and is probably due to the vertical motion from the gravity waves (shown in Fig. 2).
0.25 cm−3 and IWC
initial=1.4 g m−3, assumed to be
expo-nentially distributed in size, as described). Anvil cloud thick-ness was based on a combination of aircraft data, cloud top heights derived from MTSAT-1R (retrieved hourly resolution data provided by P. Minnis, personal communication, 2010) and radar observations, described by May et al. (2009) and was taken to be ∼2 km. The simple conceptual model de-scribed earlier was adopted by assuming uniform ice satura-tion (within layer 2, defined in Secsatura-tion 2) with a below cloud sub-saturated layer. This is justified owing to the large initial number concentrations of ice crystals, which present a large sink to the available water vapour within the anvil. Ice crystal PSD predictions were selected from the model levels corre-sponding to the aircraft cloud penetrations (at∼13 km) and were compared to the observations. The ice crystal aggrega-tion efficiency was varied betweenEagg=0.0 and 1.0 and
the results compared with the in situ aircraft measurements. It is assumed that the case study can be considered as a quasi-Lagrangian one. The sampling times and wind speeds for each leg with a corresponding distance downwind from the first leg were determined to be: Leg 1: ∼15:10; Leg 2:∼15:31, 12 km down wind,∼10 m s−1; Leg 3: ∼15:57, 50 km down wind, ∼24 m s−1; and Leg 4: ∼16:15, 75 km down wind, ∼24 m s−1. The actual horizontal wind speed at the altitude of observation was∼24 m s−1 in the direc-tion the anvil outflow, whereas the assumpdirec-tion that the flight
is Lagrangian would necessitate velocities between the legs of 10, 24 and 24 m s−1. Thus it can be seen that the flight is not strictly Lagrangian; however, another simplifying as-sumption is that the cloud was approximately steady-state, at least on the time scale of the observations, so that the im-portant variable is, therefore, distance downwind of the first flight leg.
5.2 Model Results
The results from the modelling study will now be described.
5.2.1 General features of the simulations
The size distributions measured by the CIP instrument and a mass vs size relation (Heymsfield et al., 2004) were used to produce estimates of IWC as described in Eq. (1).
Figure 13 shows some typical output fields from the 1-D model for Eagg set to both zero (a, c, e) and unity (b,
they sediment out faster. In Fig. 13 f it can be seen that within the cloud, at the flight level (∼13 km) the mass weighted av-erage particle diameter increases at first and then decreases in the case with aggregation. In the case with no aggregation (Fig. 13e), the average particle size reduces significantly at the flight level, which is due to sedimentation of the largest ice crystals.
5.2.2 Comparison of model with observations
The aim of this model study was to try and estimate which value of the aggregation efficiency, Eagg, gives the best
agreement with the observations, bearing in mind the lim-itations of the data and the uncertainties in the approach (see Sect. 3.2). This was done by visually comparing the model results along the flight level with the data from the Lagrangian aircraft case study (Sect. 3). Six values of the aggregation efficiency were used in the model simulations: Eagg= [0.00,0.02,0.50,0.60,0.80,1.00]for two different
values of the terminal velocity relation (Eqs. 5 and 6). The model was set up and run as described in Sect. 5.2.1, sampling the model output along the height of the flight tracks and comparing the averaged ice crystal number con-centrations and ice water contents sampled along the flight tracks with the model for different distances downwind of the initial flight track.
The results of this comparison are shown in Fig. 14a and b, where green lines are runs done with the terminal velocity-size relation described by Eq. (6); the red lines are runs done with the velocity-size relation described by Eq. (5) and; the black circles with error bars are the measurements averaged along the flight tracks. In both the number concentration plot and the ice water content plot (Figs. 14a and b respectively) the runs with the highest concentrations at the end of the run are those with the lowest value ofEagg and vice-versa.
It can be seen that in fact the runs with the terminal ve-locity relation described by Eq. (6) give the least reduction in number concentration when the aggregation efficiency is zero or 0.02, but give the highest reduction in number con-centration when the aggregation efficiency is higher. It can also be seen from Fig. 14b that using this terminal velocity relation (i.e. green lines) results in higher ice water contents in the cloud compared to using Eq. (5) (i.e. red lines). Which is better is open to debate and it shows that the sensitivity to the fall-speed relation is reasonably small. Visually there-fore, it seems that high aggregation efficiencies (Eagg≥0.5)
give the best agreement with the data. It should be noted that once the IWC drops to below ∼0.5 g m−3 no further
evi-dence for aggregation was seen, both in the model and in the data (e.g. in other case studies not shown). This is just be-cause, at such low IWCs, the collision cross section is too low for aggregation to be important.
5.2.3 Best estimate of the aggregation efficiency
In order to summarise Fig. 14 the following residual was cal-culated:
R=X
legs
N
meas−Nmod
Nmeas
2
+
IWCmeas−IWCmod
IWCmeas
2
(7)
where,N and IWC are the ice crystal number concentration and the ice water content respectively, “legs” refers to sum-ming over all flight legs and the subscripts meas and mod refer to values that were measured or modelled respectively. This residual is highest when there is poor agreement and lowest when the agreement is best between measurements and modelled values. The residual is shown, along with error bars representing the inter-quartile range, in Fig. 15. It can be seen that the lowest residuals, or best agreement, between model and data occurs when the aggregation efficiencies are high (i.e.Eagg≥0.5).
6 Discussion
We believe that aggregation efficiencies ofEagg≥0.5
pro-vides the best agreement with the observed data in this case. Further evidence that aggregation was occurring at these cold temperatures is the appearance of newly generated bullet-rosettes that were aggregated to chain aggregate ice crystals (see Fig. 12).
The 1-D layer model, able to capture the sedimentation process, showed that at distances greater than 30 km from the storm, the effects of size dependence on the sedimentation of ice crystals is appreciable in affecting the IWC observed at any particular level, but in order to describe the evolution of ice particle number concentration with distance from the core high values of the aggregation efficiency are required.
It is difficult to adequately model the exact case conditions since not all the required data are available to indicate the variation of the ice crystal size-distribution with height at the initialisation time in the model. For instance if there was less ice mass aloft then this could also explain the rapid change in ice mixing ratio with distance from the storm. However, if there was less ice mass aloft then it would be difficult to ex-plain the variation of ice particle number concentration with distance from the storm core unless ice crystal number con-centrations decreased with increasing height, which, based on knowledge of ice nucleation, is unlikely.
Fig. 13.Contour plots of a typical output from the sedimentation/aggregation model. Left plots are forEagg set to zero “no aggregation”,
whereas right plots are forEaggset to unity.(a)and(b)show the time-height evolution of ice crystal number concentration,N(cm−3);(c)
and(d)show the time-height evolution of ice water content (IWC, g m−3); and(e)and(f)show the time-height evolution of mass weighted mean diameter of the ice crystals in the distributionD(µm). Note that the green, dashed line in(a)is the approximate height of the flight tracks in the case study described, so is where the observations are compared with the model in Fig. 14.
0 0.05 0.1 0.15 0.2 0.25 0.3 0.35
Nice
(cm
−3)
(a) Number concentration along anvil length
−1 0 1 2 3 4 5 6 7 8
x 104
0 0.5 1 1.5
distance (m)
IWC (g
m
−3)
(b) Ice water content along anvil length
v
t: Eq. 4, Ferrier
v
t: Eq. 5, Murakami
E
agg:
0-1
measurements
Fig. 14. (a)The crystal number concentration (cm−3) observed with the CAPS-CIP instrument (black circles with error bars) as a function of distance downwind of the first leg (away from the storm)(b)The IWC (g m−3) inferred from the CAPS-CIP instrument (black circles with error bars) as a function of distance from the main storm. Note that the green dashed lines are sampled from model simulations, that use the terminal velocity relation in Eq. (6), with different values of theEaggat the level of the flight tracks described in Sect. 3. The red dashed
M. W. Gallagher et al.: Aggregation in cirrus outflow 6625 0 0.05 0.1 0.15 0.2 0.25 0.3 N ice (cm −3)
(a) Number concentration along anvil length
−1 0 1 2 3 4 5 6 7 8
x 104
0 0.5 1 1.5 distance (m) IWC (g m −3)
(b) Ice water content along anvil length
v
t: Eq. 4, Ferrier
v
t: Eq. 5, Murakami
E
agg:
0-1
measurements
−0.20 0 0.2 0.4 0.6 0.8 1 1.2
50 100 150 200 250 300 Eagg Residual Murakami (1993)−−v t(D)=700 D
1(
ρ
0ρ
−1)0.35
Ferrier et al. (1994)−−vt(D)=71.3 D0.664(ρ
0ρ
−1 )0.5
Fig. 15.Values of the residual calculated using Eq. 7 for the differ-ent model simulations. Black circles with error bars are for when the terminal velocity relation in Eq. (6) was used in the model, while red circles are for when Eq. (5) was used. In general this shows that the best agreement is found for higher aggregation efficiencies (i.e.Eagg≥0.5).
Recently, Connolly et al. (2012) showed that large aggre-gation efficiencies were associated with ice crystals that had quite complex geometry. In their study dendrites and stellar crystal habits had much higher aggregation efficiencies than simple hexagonal plates or columnar crystals. The reason for this was attributed to the fact that complex geometries have a higher probability of “interlocking” following which they can sinter. Clearly, the ice particles observed in anvil Ci are complex and could conceivably interlock. Further, Mitchell et al. (1996) found from a case study in cirrus clouds that Eagg was∼0.5. While Mitchell et al. (2006) applied a new
snow growth model to calculate, in an observed case domi-nated by dendrites at cloud top,Eagg∼=0.55; in other cases it
wasEagg∼=0.07. S¨olch and K¨archer (2011) had similar
find-ings to that of Mitchell et al. (2006) that in a mid-latitude Ci case the best agreement between model simulations and observations was when high values of the aggregation effi-ciency were used.
This study adds to the latest evidence, which suggests that aggregation is rather efficient at Ci temperatures. When com-pared to values typically assumed in bulk microphysics mod-els at these temperatures (e.g.Eagg∼0.0016) this finding is
significant.
7 Conclusions
Observations of the variation in ice crystal microphysical size distributions in tropical anvil outflow as a function of longi-tudinal and transverse position are presented and compared with an explicit bin-microphysics model scheme. Within the longitudinal or axial outflow region the variation in ice crys-tal PSD is broadly consistent with the model predictions
showing, as expected, that aggregation and sedimentation are the dominant processes leading to the removal of ice tals from the Ci cloud. It was also observed that ice crys-tal nucleation in the outflow margins was occurring, and this was shown by the weak U-shaped profile in the observedλ0
parameter, transverse to the anvil outflow. Higherλ0at the
cloud edges illustrates that the ratio of the concentration of small particles relative to large particles was higher at the cloud edge. This nucleation appeared to exhibit the same habit characteristics of more typical developing high level frontal Ci (Fig. 12). The nucleation of new ice crystals oc-curred mostly well away from the parent cloud and after the anvil had been depleted of a large fraction of its ice water by sedimentation; however, in this case it did not strongly in-crease the number concentrations of ice particles within the cloud. The reasons for this could be that there were not many interstitial aerosols present within the cloud or that the su-persaturation was not able to reach high enough levels for nucleation to be significant.
Based on the comparison between the observed cloud properties and predictions using the model the following has been concluded:
– λ0 remains relatively constant with distance from the
storm, suggesting that there is a balance between fall out of large crystals (which would increaseλ0) and the
gen-eration of new large ice particles by aggregation (which decreasesλ0).
– The modelled aggregation efficiency that is most con-sistent with data isEagg≥0.5
– These values of Eagg are orders of magnitude higher
than those used in typical Large Eddy Model simula-tions at these low temperatures, which, at a tempera-ture of−60◦C, would typically be∼0.0016 (e.g. Fer-rier, 1994).
– Any errors in the horizontal wind speed would change the gradient of the modelled number concentration and IWC vs distance by 20u whereuis the error in the true wind speed (in m s−1). This may alter the best fit of the aggregation efficiency by∼5%, yet still it does not af-fect the preference for highEagg in explaining the
ob-servations.
Acknowledgements. We would like to thank the staff of ARA who operated the Egrett aircraft during ACTIVE. We acknowledge the UK NCAS and the US NCAR for providing instrumentation and technical staff. Funding from NERC is acknowledged for the ACTIVE project under the grant code NE/C512688/1.
Edited by: O. M¨ohler
References
Abbatt, J. P. D., Benz, S., Cziczo, D. J., Kanji, Z., Lohmann, U., and M¨ohler, O.: Solid Ammonium Sulfate Aerosols as Ice Nuclei: A Pathway for Cirrus Cloud Formation , Science, 313, 1770–1773, 2006.
Ackermann, T. P., Liou, K. N., Valero, F. P. J., and Pfister, L.: Heat-ing rates in tropical anvils, J. Atmos. Sci., 45, 1606–1623, 1988. Allen, G., Vaughan, G., Bower, K. N., Gallagher, M. W., Williams, P. I., Flynn, M. J., Hamilton, J., Crosier, J., Connolly, P. J., Coe, H., Choularton, T. W., Allan, J. D., and Lewis, A.: Aerosol and trace-gas measurements in the Darwin area during the wet sea-son., J. Geophys. Res., 113, 19 pp., 2008.
Archuleta, C. M., DeMott, P. J., and Kreidenweis, S. M.: Ice nu-cleation by surrogates for atmospheric mineral dust and min-eral dust/sulphate particles at cirrus temperatures, 5, 3391–3436, 2005.
Bailey, M. and Hallett, J.: Growth Rates and Habits of Ice Crystals between−20◦C and−70◦C, J. Atmos. Sci., 61, 514–544, 2004. Baran, A. J., Connolly, P. J., and Lee, C.: Testing an ensemble model of cirrus ice crystals using midlatitude in situ estimates of ice water content, volume extinction coefficient and the total solar optical depth, J. Quant. Spectrosc. Ra., 110, 1579–1598, 2009. Baumgardner, D., Jonsson, H., Dawson, W., O’Connor, D., and
Newton, R.: The cloud, aerosol and precipitation spectrometer: a new instrument for cloud investigations, Atmos. Res., 59–60, 251–264, 2001.
Bott, A.: A Flux Method for the Numerical Solution of the Stochas-tic Collection Equation: Extension to Two-Dimensional ParStochas-ticle Distributions, J. Atmos. Sci., 57, 284–294, doi:10.1175/1520-0469(2000)057<0284:AFMFTN>2.0.CO;2, 2000.
Boussaton, M. P., Coquillat, S., Chauzy, S., and Gangneron, F.: A New Videosonde with a Particle Charge Measure-ment Device for In Situ Observation of Precipitation Parti-cles, J. Atmos. Ocean. Tech., 21, 1519–1531, doi:10.1175/1520-0426(2004)021<1519:ANVWAP>2.0.CO;2, 2004.
Broadley, S. L., Murray, B. J., Herbert, R. J., Atkinson, J. D., Dob-bie, S., Malkin, T. L., Condliffe, E., and Neve, L.: Immersion mode heterogeneous ice nucleation by an illite rich powder rep-resentative of atmospheric mineral dust, Atmos. Chem. Phys., 12, 287–307, doi:10.5194/acp-12-287-2012, 2012.
Chen, J.-P. and Lamb, D.: Simulation of Cloud Micro-physical and Chemical Processes Using a Multicompo-nent Framework. Part I: Description of the Microphysical Model, J. Atmos. Sci., 51, 2613–2630, doi:10.1175/1520-0469(1994)051<2613:SOCMAC>2.0.CO;2, 1994.
Collins, W. D., Valero, F. P. J., Flatau, P. J., Lubin, D., Grassl, H., and Pilewskie, P.: Radiative effects of convection in the tropical Pacific, J. Geophys. Res., 101, 14999–15012, 1996.
Connolly, P. J., Saunders, C. P. R., Gallagher, M. W., Bower, K. N., Flynn, M. J., Choularton, T. W., Whiteway, J., and Lawson, P.: Aircraft Observations of the influence of electric fields on the aggregation of ice crystals, Q. J. Roy. Meteor. Soc., 131, 1695– 1712, 2005a.
Connolly, P. J., Saunders, C. P. R., Gallagher, M. W., Bower, K. N., Flynn, M. J., Choularton, T. W., Whiteway, J., and Lawson, R. P.: Aircraft observations of the influence of electric fields on the ag-gregation of ice crystals, Q. J. Roy. Meteor. Soc., 131, 1695– 1712, 2005b.
Connolly, P. J., Flynn, M. J., Ulanowski, Z., Choularton, T. W., Gallagher, M. W., and Bower, K. N.: Calibration of the Cloud Particle Imager Probes Using Calibration Beads and Ice Crystal Analogs: The Depth of Field, J. Atmos. Ocean Tech., 24, 1860– 1879, 2007.
Connolly, P. J., M¨ohler, O., Field, P. R., Saathoff, H., Burgess, R., Choularton, T., and Gallagher, M.: Studies of heterogeneous freezing by three different desert dust samples, Atmos. Chem. Phys., 9, 2805–2824, doi:10.5194/acp-9-2805-2009, 2009. Connolly, P. J., M¨ohler, O., Field, P. R., Saathoff, H., Burgess,
R., Choularton, T., and Gallagher, M.: Studies of heterogeneous freezing by three different desert dust samples, Atmos. Chem. Phys., 9, 2805–2824, doi:10.5194/acp-9-2805-2009, 2009. Connolly, P. J., Emersic, C., and Field, P. R.: A laboratory
in-vestigation into the aggregation efficiency of small ice crystals, Atmos. Chem. Phys., 12, 2055–2076, doi:10.5194/acp-12-2055-2012, 2012.
Cziczo, D. J. and Abbatt, J. P. D.: Ice nucleation in NH4SO4,
NH4NO3, and H2SO4aqueous particles: Implications for cirrus
cloud formation, J. Geophys. Res., 28, 963–966, 2001.
Danielsen, E. F.: A dehydration mechanism for the
stratosphere, Geophys. Res. Lett., 9, 605–608,
doi:10.1029/GL009i006p00605, 1982.
Davis, M. H.: Two charged spherical conductors in a uniform elec-tric field: Forces and field strength, Q. J. Mech. Appl. Math., 17, 499–511, 1964.
Ferrier, B. S.: A double-moment multiple-phase four-class bulk ice scheme. Part I: Description, J. Atmos. Sci., 51, 249–280, 1994. Field, P., Heymsfield, A., and Bansemer, A.: Snow size distribution
parameterization for midlatitude and tropical ice clouds, J. At-mos. Sci., 64, 4346–4365, 2007.
Gallagher, M. W., Connolly, P. J., Whiteway, J., Figueras-Nieto, D., Flynn, M., Choularton, T. W., Bower, K. N., Cook, C., Busen, R., and Hacker, J.: An overview of the microphysical structure of cirrus clouds observed during EMERALD-1, Q. J. Roy. Meteor. Soc., 131, 1143–1169, 2005a.
Gallagher, M. W., Whiteway, J., Flynn, M. J., Connolly, P. J., Figueros-Nieto, D., Choularton, T. W., Bower, K. N., Cook, C., Busen, R., and Hacker, J.: An overview of the microphysical structure of cirrus clouds observed during EMERALD-1, Q. J. Roy. Meteor. Soc., 131, 1143–1169, 2005b.
Gultepe, I. and Starr, D.: Microphysical and radiative development of a cirrus cloud during FIRE: implications for dynamical effects, Atmos. Res., 34, 43–52, 1994.
Hall, W. D.: A Detailed Microphysical Model Within a Two-Dimensional Dynamic Framework: Model Description and Pre-liminary Results, J. Atmos. Sci., 37, 2486–2507, 1980.