BGD
2, 1353–1380, 2005Nitrous oxide from European forests
P. Ambus et al.
Title Page
Abstract Introduction
Conclusions References
Tables Figures
◭ ◮
◭ ◮
Back Close
Full Screen / Esc
Print Version
Interactive Discussion
EGU Biogeosciences Discussions, 2, 1353–1380, 2005
www.biogeosciences.net/bgd/2/1353/ SRef-ID: 1810-6285/bgd/2005-2-1353 European Geosciences Union
Biogeosciences Discussions
Biogeosciences Discussionsis the access reviewed discussion forum ofBiogeosciences
Sources of nitrous oxide emitted from
European forest soils
P. Ambus1, S. Zechmeister-Boltenstern2, and K. Butterbach-Bahl3 1
Risø National Laboratory, Biosystems Department (BIO-309), 4000 Roskilde, Denmark
2
Federal Research and Training Centre for Forests, Natural Hazards and Landscape (BFW), Vienna, Austria
3
Karlsruhe Research Centre, Institute for Meteorology and Climate Research, Atmospheric Environmental Research (IMK-IFU), Garmisch-Partenkirchen, Germany
Received: 27 June 2005 – Accepted: 11 August 2005 – Published: 9 September 2005 Correspondence to: P. Ambus ([email protected])
BGD
2, 1353–1380, 2005Nitrous oxide from European forests
P. Ambus et al.
Title Page
Abstract Introduction
Conclusions References
Tables Figures
◭ ◮
◭ ◮
Back Close
Full Screen / Esc
Print Version
Interactive Discussion
EGU Abstract
Forest ecosystems may provide strong sources of nitrous oxide (N2O), which is
impor-tant for atmospheric chemical and radiative properties. Nonetheless, our understand-ing of controls on forest N2O emissions is insufficient to narrow current flux estimates, which still are associated with great uncertainties. In this study, we have investigated
5
the quantitative and qualitative relationships between N-cycling and N2O production in
European forests in order to evaluate the importance of nitrification and denitrification for N2O production. Soil samples were collected in 11 different sites characterized by
variable climatic regimes and forest types. Soil N-cycling and associated production of N2O was assessed following application of 15N-labeled nitrogen. The N2O
emis-10
sion varied significantly among the different forest soils, and was inversely correlated to the soil C:N ratio. The N2O emissions were significantly higher from the deciduous
soils (13 ng N2O-N cm −3
d−1) than from the coniferous soils (4 ng N2O-N cm −3
d−1). Ni-trate (NO−3) was the dominant substrate for N2O with an average contribution of 62% and exceeding 50% at least once for all sites. The average contribution of
ammo-15
nium (NH+4) to N2O averaged 34%. The N2O emissions were correlated with gross
nitrification activities, and as for N2O, gross nitrification was also higher in deciduous soils (3.4µg N cm−3d−1) than in coniferous soils (1.1µg N cm−3d−1). The ratio be-tween N2O production and gross nitrification averaged 0.67% (deciduous) and 0.44%
(coniferous). Our study suggests that changes in forest composition in response to
20
land use activities and global change may have implications for regional budgets of
greenhouse gases. From the study it also became clear that N2O emissions were
driven by the nitrification activity, although the N2O was produced per se mainly from
denitrification. Increased nitrification in response to accelerated N inputs predicted for forest ecosystems in Europe may thus lead to increased greenhouse gas emissions
25
BGD
2, 1353–1380, 2005Nitrous oxide from European forests
P. Ambus et al.
Title Page
Abstract Introduction
Conclusions References
Tables Figures
◭ ◮
◭ ◮
Back Close
Full Screen / Esc
Print Version
Interactive Discussion
EGU 1. Introduction
Nitrous oxide (N2O) is an important trace gas with implications for atmospheric
chem-istry and radiative properties (IPCC, 2001). Several independent studies have demon-strated that N2O is emitted in significant quantities from forest ecosystems (e.g. Ambus and Christensen, 1995; Bowden et al., 1990; Schmidt et al., 1989; Struwe and Kjøller,
5
1994; Papen and Butterbach-Bahl, 1999). In Europe, forest ecosystems cover about 1.9 Mill. km2or ca. 28% of the total land area and may thus have significant importance for European scale N2O budgets. However, the importance of temperate forests for
the atmospheric N2O budget still remains highly uncertain with a 20-fold range in the
emission estimates (IPCC, 2001). Such high uncertainty arise due to a combination
10
of mere factors including lack of experimental data for upscaling, inevitable inaccuracy in flux measurements, and large spatial and temporal variability of fluxes (Kroeze et al., 2003). Moreover, insufficient process understanding for example on the impor-tance of forest type and atmospheric N-deposition is also an impediment to narrow flux estimates (Kroeze et al., 2003; Skiba et al., 1999).
15
Microbial C and N turnover processes, including mineralization, nitrification, denitri-fication and microbial immobilization are the main reason for N2O production and
con-sumption in soils (Conrad, 2002). Therefore, a detailed knowledge of these processes is of fundamental importance to understand the microbially mediated biosphere-atmosphere exchange of trace gases, and to build, parameterize and further improve
20
process oriented models. Such models constitute crucial tools in the upscaling of plot-scale measurements in view of the large spatial and temporal variability of environ-mental conditions in forest ecosystems across Europe, and as tools to predict future N trace gas emissions from forest soils (Butterbach-Bahl et al., 2004).
The exchange of N2O between soils and the atmosphere depends specifically on
25
BGD
2, 1353–1380, 2005Nitrous oxide from European forests
P. Ambus et al.
Title Page
Abstract Introduction
Conclusions References
Tables Figures
◭ ◮
◭ ◮
Back Close
Full Screen / Esc
Print Version
Interactive Discussion
EGU (NO−3). In contrast, denitrification is a reductive process, which mainly occurs in oxygen
depleted soil zones. Under anaerobic conditions, some microbes use NO−3 and NO−2 as alternative electron acceptors, thereby reducing NO−3/NO−2 sequentially to NO, N2O
and finally to N2(Conrad, 2002). Although nitrification and denitrification are
character-ized by different environmental controls and have optima under different environmental
5
conditions, it is well known that both processes may occur simultaneously in the soil, thus giving rise to duplicate sources for N2O (Davidson, 2000).
The importance of other soil processes in the production of N2O, including any role of dissimilatory nitrate reduction to ammonium, heterotrophic nitrification by fungi and anaerobic oxidation of NH+4, remains poorly known, (e.g. Dalsgaard et al., 2003; Wolf
10
and Brumme, 2002; Wrage et al., 2001).
In this experiment, we have investigated the quantitative and qualitative relation-ships between N-cycling and N2O production in European forests in order to
evalu-ate the importance of nitrification and denitrification for N2O production. Soil samples
were collected in 11 different sites characterized by variable climatic regimes and
for-15
est types, and incubated in the laboratory under controlled environmental conditions. Soil N-cycling and associated production of N2O was assessed following application of 15
N-labeled nitrogen as tracer.
2. Materials and methods
2.1. Study sites and sampling
20
The study included 11 different forest sites situated across Europe from Finland in the north to Italy in the south, and from Scotland in the west to Hungary in the east. Main botanical characteristics are listed in Table 1 and soil characteristics are compiled in Table 2. Undisturbed soil samples were collected at each site in response to pre-defined conditions with respect to soil temperature to ensure identical preincubation
25
tem-BGD
2, 1353–1380, 2005Nitrous oxide from European forests
P. Ambus et al.
Title Page
Abstract Introduction
Conclusions References
Tables Figures
◭ ◮
◭ ◮
Back Close
Full Screen / Esc
Print Version
Interactive Discussion
EGU perature and moisture conditions. This procedure allowed to identify to which extent
differences in chemical and biological conditions among the sites would lead to diff er-ent N2O emission rates. At least two sampling occasions were considered for each
site, i.e. at the onset of the growing season and at the end of the growing season, which subsequently will be mentioned as the spring time and autumn time samplings,
5
respectively. The spring sampling took place when average soil temperature (5 cm depth) exceeded 8◦C and the autumn sampling took place when soil temperature had decreased to below 5◦C. In the Hyyti ¨al ¨a and Sorø sites, two additional samplings were conducted in early summer (June) and late summer (September), respectively. In the San Rossore site a spring time sample was not achieved until June.
10
At each sampling, 16 intact soil cores, 5 cm diam., were collected from the top 0– 10 cm soil after removal of the litter layer by pushing down 10 cm long PVC-cylinders sharpened at the bottom end. The cores were gently excavated, sealed firmly by wrap-ping with Parafilm and then shipped in a cool box to the laboratory by overnight carrier.
2.2. Incubation
15
Upon arrival to the laboratory, the samples were stored in a cold room (5◦C) until incu-bation was initiated, within one week. Incuincu-bation included a two-step procedure. Firstly, the soil water content was adjusted to a pF value of 2.36. The Parafilm® was removed and the cores wrapped at the bottom by a cotton cloth and then gently wetted with 40 ml of deionised water. Subsequently a 230 cm water suction was applied to the bottom of
20
the cores achieved by placing them in an elevated sandbox for 60 h at 5◦C. After equi-libration of the soil water content, the cores were re-sealed at the bottom. Then, three quadruplicate sets of cores were treated with different combinations of nitrog15 en-riched substrates prior to incubation for N2O flux measurements and gross N-cycling assay. In treatmentA15N-enriched NH+4 was added as a 15(NH4)2SO4solution with 2
25
atom% excess (APE)15N; in treatmentN 15N-enriched NO−3 was added as a K15NO3
sub-BGD
2, 1353–1380, 2005Nitrous oxide from European forests
P. Ambus et al.
Title Page
Abstract Introduction
Conclusions References
Tables Figures
◭ ◮
◭ ◮
Back Close
Full Screen / Esc
Print Version
Interactive Discussion
EGU ject to immediate extraction for dissolved inorganic N to assess start values. A fourth
treatment constituted a zero N control by adding deionised water. The solutions were applied in six 1-ml doses providing 300µg N core−1 and a homogeneous distribution of the applied N was ensured by injecting slowly in synchrony with the vertical 0–8 cm travel of a side hole needle facilitated by the use of a precision liquid processor
(Hamil-5
ton Microlab 500). The cores were then incubated in individuality at 15◦C for 48 h in a 2-l gas tight Kilner jar fitted with a rubber septum in the lid for headspace gas sampling by syringe and needle. A small beaker with water in the jars served to prevent evap-oration losses from the cores. Two gas samples were removed from the headspace at 0, 24 and 48 h, respectively, for subsequent analysis of headspace N2O
concentra-10
tions and15N enrichments of N2O. A 5-ml sample was transferred to a pre-evacuated 3-ml Venoject® blood-collecting tube for the N2O concentration measurements, and a
120-ml sample was transferred to a pre-evacuated crimp-sealed 100-ml serum bottle for determination of15N content in the N2O. Prior to each sampling, the Kilner jars were pressurized with an equal amount of N2to maintain atmospheric headspace pressure.
15
2.3. Analysis
The soil cores were analyzed for inorganic N contents and15N enrichments two hours and 48 h after the label was applied. The soil was removed from the PVC cylinder, mixed thoroughly by hand and sieved to pass a 2-mm mesh. Subsamples of 20 g were suspended in 100 ml of 1M KCl and shaken for 1 h prior to filtration and analysis of
20
inorganic N and15N.
Gross N turnover rates were calculated based on the15N-isotope pool dilution princi-ple using the analytical equations of Kirkham and Bartholomew (1954). Gross rates of N mineralization were obtained from the isotopic dilution of the NH+4 pool in treatment
A. Gross rates of nitrification were obtained from the isotopic dilution of the NO−3 pool
25
BGD
2, 1353–1380, 2005Nitrous oxide from European forests
P. Ambus et al.
Title Page
Abstract Introduction
Conclusions References
Tables Figures
◭ ◮
◭ ◮
Back Close
Full Screen / Esc
Print Version
Interactive Discussion
EGU The contribution of NH+4 to N2O production (Fa) was achieved in treatment A by
the use of the linear mixing model Fa=(NOe−NIe)/(AMe−NIe), where NOe, NIe and AMe are the atom%15N enrichments of N2O, NO−3 and NH+4, respectively. NOe was calculated from the paired measurements of N2O concentration and15N enrichments in the incubation jar. NIe and AMe were calculated as the average between the NO−3 and
5
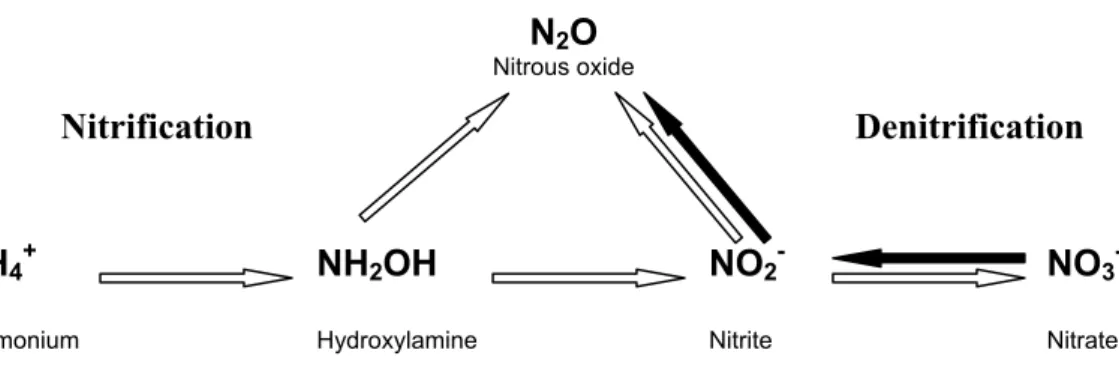
NH+4 enrichments, respectively, observed at the onset and at the end of the incubations. The Fa-value was calculated under the assumptions that labeled NH+4 and labeled NO−3 were the only sources for N2O as illustrated in the simple, conceptual model pictured in Fig. 1. The contribution of NO−3 to the N2O production (Fn) was evaluated from the
results of experimentN by the approach Fn=NOe/NIe.
10
Concentrations of N2O were measured by gas chromatography (Shimadzu GC 14B,
Kyoto, Japan) with electron capture detection. The15N content of N2O was analysed
using a Finnigan MAT PreCon unit (ThermoFinnigan, Bremen, Germany) interfaced with a GC coupled in continuous flow-mode to a Finnigan MAT Delta PLUS isotope ratio mass spectrometer (IRMS). Briefly, using a double hole needle and He carrier the
15
sample in the 100-ml serum bottle was purged through a chemical trap of Mg(ClO4)2
and Ascarite (KOH) for removal of water and CO2, respectively, and the sample N2O was then concentrated cryogenically (liq. N2) before injection into the GC.
Soil extracts were analysed for concentrations of NH+4 and NO−3 on a Bran+Luebbe AutoAnalyzer 3 system (Bran+Luebbe, Norderstedt, Germany). To determine the15N
20
enrichments of NH+4 and NO−3, the content of each component in an 80-ml portion of the KCl extract was concentrated on acidified filter paper prior to analysis (Sørensen and Jensen, 1991).
Soil total N and15N was determined in finely ground 40-mg portions of air-dried soil samples. Dried filter papers and soil samples were wrapped in tin cups followed by
25
analysis on a CE 1110 elemental analyser (ThermoFinnigan, Milan, Italy) coupled in continuous flow mode to the IRMS.
BGD
2, 1353–1380, 2005Nitrous oxide from European forests
P. Ambus et al.
Title Page
Abstract Introduction
Conclusions References
Tables Figures
◭ ◮
◭ ◮
Back Close
Full Screen / Esc
Print Version
Interactive Discussion
EGU The sites differed considerably in bulk densities (Table 2) and to facilitate
compar-isons between sites data are given on basis of soil volume. Statistical evaluation of the data was undertaken using S-PLUS® (Insightful Corporation, Seattle, USA). Two-sample population means were compared using t-tests. Main effects of site and time were evaluated by analysis of variance (ANOVA). Where the main effects were
signif-5
icant, multiple-means comparisons were done by the Tukey critical point calculation to determine differences in response factors. Single linear regression and stepwise multiple linear regression analysis was used to describe the effect of single or multiple variables upon response variables. Data were assumed normally distributed except for N2O fluxes, which were log-transformed before evaluation. All tests were performed at
10
the 5% probability level.
3. Results
3.1. Site characteristics
The 11 sites included in this study represented seven different major tree species, comprising both deciduous and coniferous forest types (Table 1), which were
dis-15
tributed on five different soil textures ranging from sand to loam (Table 2). Except for the Achenkirch site, which was located on limestone (Schindlbacher et al., 2004), all sites were characterized by acidic pH-values (Table 2). The H ¨oglwald and Achenkirch spruce soils revealed notably high organic C contents of 12.5% and 14.1%, respec-tively. For the remaining soils organic C ranged between 1.2% and 6.9% (Table 2).
20
The soil moisture adjustments prior to the incubations combined with the subsequent substrate additions resulted in soil water filled pore spaces (WFPS) ranging from 38% in the sandy San Rossore soil to 73% in the sandy loam soil of Nyirjes (Table 2).
Soil inorganic nitrogen contents varied between sampling times in three of the sites (Table 3). Between the sites, NH+4 was uniform in the spring, whereas in the autumn
25
BGD
2, 1353–1380, 2005Nitrous oxide from European forests
P. Ambus et al.
Title Page
Abstract Introduction
Conclusions References
Tables Figures
◭ ◮
◭ ◮
Back Close
Full Screen / Esc
Print Version
Interactive Discussion
EGU Glencorse whereas in the autumn soil NO−3 in Bosco negri exceeded most other sites
(P<0.001 for all effects). The early summer and late summer samplings in Hyyti ¨al ¨a and Sorø showed that the two sites differed in NH+4 in the late summer, but otherwise remained similar.
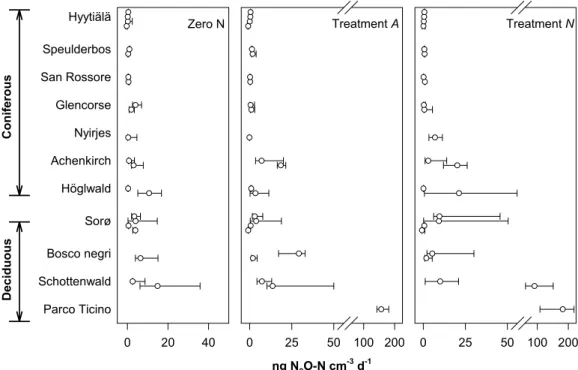
3.2. Emissions of N2O from soil columns
5
During the 48 h incubation time, the forest soil columns emitted N2O at median val-ues ranging from <0.5 ng N2O-N cm−3d−1 in the Hyyti ¨al ¨a soils to about 15 ng N2 O-N cm−3d−1in soil from the Schottenwald beech forest (Fig. 2). Sampling time had no influence on the N2O activity except for the H ¨oglwald site, where N2O emission was
greater in the autumn than in the spring (P<0.05). Addition of the NH+4 and NO−3
sub-10
strates roughly doubled the N2O activity, independent of substrate form, when all sites
and sampling times are combined (Fig. 2). However, due to the prevalent scatter in data the N effect was only significant in the Nyirjes soil in the autumn where activity peaked at 7 ng N2O-N cm
−3
d−1 after NO−3 additions and in the H ¨oglwald soil in the spring where activity peaked at 0.9 ng N2O-N cm
−3
d−1upon NH+4-addition.
15
The N2O emission varied significantly among the different forest soils both under
zero N conditions as well as for the nitrogen amended soil columns (P<0.001). This site related effect on N2O emissions remained significant also when the asymptotic
high values for the Parco Ticino (Fig. 2) was removed in the ANOVA. The average N2O
emission in the zero N samples was inversely correlated (P<0.05) to the soil C:N ratio
20
(Table 1), but did not correlate with any other of the soil variables listed in Tables 2 and 3. The N2O emissions from the zero N samples were significantly (P<0.01) higher from
the deciduous soils (13 ng N2O-N cm−3d−1) than from the coniferous soils (4 ng N2 O-N cm−3d−1). A similar effect of forest type was also significant (P<0.05) with the NO−3 treated soil columns, and a trend (P<0.06) was evident for the NH+4 treated soils, also
25
BGD
2, 1353–1380, 2005Nitrous oxide from European forests
P. Ambus et al.
Title Page
Abstract Introduction
Conclusions References
Tables Figures
◭ ◮
◭ ◮
Back Close
Full Screen / Esc
Print Version
Interactive Discussion
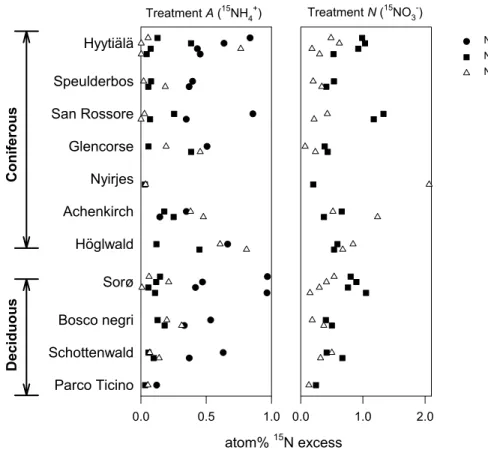
EGU 3.3. Sources for N2O
The data in Fig. 3 shows the average15N enrichments of the inorganic N pools dur-ing the course of the incubation, combined with the15N enrichment of the cumulated N2O. Two days after the15NH+4-labelling (treatmentA) an increase in15NO−3 could be observed for most of the soils indicating that nitrification occurred (Fig. 3). The15N
5
enrichments of the N2O emitted from 15
NH+4-labeled soil columns varied considerably among the different sites. For some sites, e.g. Hyyti ¨al ¨a, Speulderbos (spring), and San Rossore the emitted N2O contained almost no excess
15
N despite significant enrich-ments of both the NH+4 and NO−3 pools. In the remaining sites, the N2O enrichments
were intermediate to the enrichments of the NH+4 and NO−3 pools, apart for three
ob-10
servations (Hyyti ¨al ¨a late summer, Achenkirch autumn and H ¨oglwald autumn) where the N2O
15
N enrichments exceeded the enrichments of both inorganic N pools (Fig. 3). With the15NO−3-labelled soil (treatmentN) no increase in15NH+4 was observed. The
15
N isotopic signature of emitted N2O was less than that of the NO−3-pool to varying degrees indicating variable source strengths of NO−3 for N2O production between the
15
sites. Unexpected high 15N enrichments of N2O were observed at two occasions,
i.e. Nyirjes autumn and Achenkirch autumn (Fig. 3).
The contribution of NH+4 to N2O in experimentAand the contribution of NO −
3 to N2O
in experimentN, calculated from the15N values in Fig. 3, suggests that NO−3 was the dominant source for N2O on most occasions across sampling time and location
(Ta-20
ble 4). The contribution of NH+4 to N2O averaged 34%. Data for the Achenkirch site
showed that the contribution from NH+4 consistently exceeded 50%, which was signifi-cantly (P<0.05) higher than for the other sites except Hyyti ¨al ¨a, Bosco negri and Parco Ticino. In contrast, we found that the contribution of NO−3 to N2O averaged 62% and exceeded 50% in at least one observation in each site, but independent of sampling
25
BGD
2, 1353–1380, 2005Nitrous oxide from European forests
P. Ambus et al.
Title Page
Abstract Introduction
Conclusions References
Tables Figures
◭ ◮
◭ ◮
Back Close
Full Screen / Esc
Print Version
Interactive Discussion
EGU NH+4 and NO−3 to N2O were not influenced by major forest type, i.e. deciduous versus
coniferous.
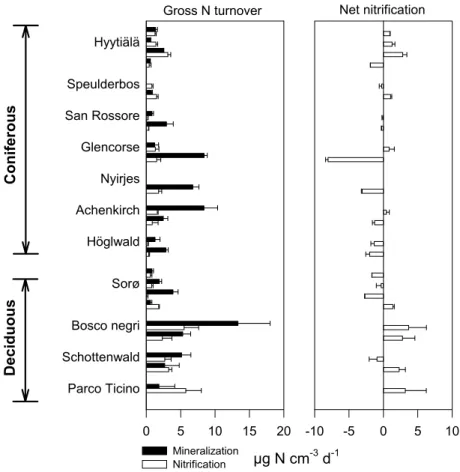
3.4. Gross N cycling rates
Gross N mineralization varied significantly between the sampling sites for both spring-time samples and autumn-spring-time samples, and four sites, i.e. Hyyti ¨al ¨a, Glencorse,
5
Achenkirch, and Sorø, also varied between sampling times (Fig. 4). The lowest gross mineralization, 0.6µg N cm−3d−1, was observed in a coniferous site (Hyyti ¨al ¨a in au-tumn) and the highest, 13.3µg N cm−3d−1, in a deciduous site (Bosco negri in spring). The average coniferous activity of 3.3µg N cm−3d−1, however, did not differ from the average deciduous activity of 4.2µg N cm−3d−1. A step-wise multiple regression
anal-10
ysis with mean gross mineralization rates as response variable and soil physical and chemical characteristics (Tables 2 and 3) as main effects indicated a negative correla-tion with soil total C (P<0.05) and a positive correlation with soil total N (P<0.05).
Gross nitrification rates ranged from <0.1µg N cm−3d−1 to 5.7µg N cm−3d−1, and fluctuated significantly among sites in the spring, but not autumn (Fig. 4). Sampling
15
time fluctuations were evident only at two sites, i.e. Hyyti ¨al ¨a and Sorø, where sampling took place four times during the season. The average coniferous gross nitrification of 1.1µg N cm−3d−1 was significantly (P<0.01) lower than the deciduous activity of 3.4µg N cm−3d−1. Across all sites, the average gross nitrification was inversely corre-lated to the soil C:N ratio (P<0.05).
20
Gross nitrification was generally lower than the gross mineralization. The ratio be-tween gross nitrification and gross mineralization tended to be higher for the deciduous soils (0.83±0.14; n=4±SE) than for the coniferous soils (0.50±0.14; n=7±SE). Varia-tions in the ratio occurred independently of the soil parameters listed in Tables 2 and 3.
25
BGD
2, 1353–1380, 2005Nitrous oxide from European forests
P. Ambus et al.
Title Page
Abstract Introduction
Conclusions References
Tables Figures
◭ ◮
◭ ◮
Back Close
Full Screen / Esc
Print Version
Interactive Discussion
EGU (e.g. Bosco negri) and others a net NO−3 sink (e.g. H ¨oglwald). Net nitrification also
differed significantly (P<0.05) between the coniferous sites (−1.1µg N cm−3d−1) and deciduous sites (1.6µg N cm−3d−1).
Nitrous oxide emissions were not correlated to the gross mineralization rates, neither among all sites, nor within the two forest types (Fig. 5A). However, a trend in the data
5
(P<0.09) indicated a positive relationship between N2O and gross mineralization for the coniferous soils. The N2O emissions correlated significantly (P<0.03) with gross
nitrification activities when all sites were included in the analysis (Fig. 5B). For the individual forest types, however, the N2O emissions were not correlated to gross nitri-fication although a positive trend (P<0.08) was observed for the deciduous soils. In
10
contrast to the relationship with gross nitrification, the N2O emissions were not related
to net nitrification activities, but a positive trend (P<0.08) could be observed for the deciduous soils (Fig. 5C).
4. Discussion
4.1. Impact of forest type and C- and N-pools
15
Nitrogen cycling processes in forest soils is widely believed to be regulated by litter quality parameters such as C:N ratio, contents of N, lignin and phenolic compounds (Venterea et al., 2004). It is also believed that deciduous tree species generally in-crease nutrient cycling and microbial activities compared to coniferous tree species (Menyailo et al., 2002; Smolander et al., 2005). In accordance with this general
per-20
ception, incubation of intact samples from a range of European coniferous and decid-uous forest soils indicated that soils under deciddecid-uous forest types emit more N2O than
soils under coniferous forest types. A similar difference between these two main forest types has also been observed in field studies (Butterbach-Bahl et al., 1997) who found
that a German beech forest emitted approximately twice as much N2O as a spruce
25
BGD
2, 1353–1380, 2005Nitrous oxide from European forests
P. Ambus et al.
Title Page
Abstract Introduction
Conclusions References
Tables Figures
◭ ◮
◭ ◮
Back Close
Full Screen / Esc
Print Version
Interactive Discussion
EGU may emit more N2O compared with soils under coniferous forests (Menyailo and Huwe,
1999; Menyailo et al., 2002).
We also observed that the N2O production was inversely correlated to the C:N ratio
of soil carbon and nitrogen pools. This observation suggests that not only the chem-ical quality of the litter input, but also external factors, such as nitrogen deposition,
5
which may have a long-term cumulated effect on the soil C:N ratio constitute impor-tant proxy controllers for the N2O production across European forest sites. Lovett et al. (2004) found that standard measures of litter quality (e.g. N, lignin, and phenolic contents) could not explain mechanisms of control on forest N cycling and suggested that external factors may play an important role. In line with this, the soil
characteris-10
tics encountered in this study as indices for quality of litter input (Table 2) did not differ between the two major forest types despite the different N2O emission strengths.
The supply of inorganic N, as expressed by gross N mineralization, was also similar in magnitude for the two forest types and did not explain the difference in N2O emis-sions. Gross mineralization in hardwood and Pine stands of Harvard Forest (Venterea
15
et al., 2004) were similar in magnitude to those reported herein and, in agreement with our conclusion, not different between the two forest types. Not surprisingly, however, current gross mineralization increased with increasing total N contents among all sites and decreased with increasing C content. The combined effect of these two parame-ters thus suggests that gross mineralization would increase with a decreasing C:N ratio
20
of the soil organic matter, but in our analysis, this relationship was just about significant (P<0.06).
The extent of nitrification in relation to substrate input, as expressed by the ratio be-tween gross nitrification and gross mineralization, is basically regulated by the compe-tition between heterotrophic and autotrophic NH+4 assimilation (Venterea et al., 2004).
25
agree-BGD
2, 1353–1380, 2005Nitrous oxide from European forests
P. Ambus et al.
Title Page
Abstract Introduction
Conclusions References
Tables Figures
◭ ◮
◭ ◮
Back Close
Full Screen / Esc
Print Version
Interactive Discussion
EGU ment with observations in other studies suggesting that nitrification increases with
de-creasing C:N ratio below a threshold value of 22–25 (Lovett et al., 2004). The current C:N ratios were almost all below this threshold.
4.2. Sources of N2O
Although N2O production was correlated with gross nitrification activity, the current data
5
do imply that nitrification activity per se was not responsible for the N2O formation in most of the sites. Exceptions to this were the Achenkirch and H ¨oglwald sites, where all the N2O was derived directly from NH+4 under nitrifying conditions. However, both of
these sites were also capable for producing N2O entirely from NO−3 under similar soil moisture conditions. There is no obvious reason to explain why these two spruce sites
10
in particular exhibited the capability to switch between N2O production entirely from
nitrification or from denitrification. Common characteristics to the two sites making them distinct from the other sites were a loamy texture with relatively high contents of organic C and N. This environment could sustain not only a high microbial biomass but also probably a greater microbial diversity with the capability of a rapid switch between
15
different pathways for N2O production, i.e. nitrification, denitrification and perhaps also
less well described pathways such as heterotrophic production from NH+4 (Wolf and Brumme, 2002). Data for the Hyyti ¨al ¨a pine soil also suggested a transient production of N2O from NH+4 in August (late summer) that, in combination with a reduced N2O
production from NO−3 at the same time, do imply a shift in N2O production pathway
20
during the season, in accordance with the observations by Wolf and Brumme (2002). One of the most important environmental controls in the partitioning of N2O from
nitrification and denitrification is soil aeration, which mainly is regulated by the soil moisture content. In the current experiment the pre-incubation soil moisture was reg-ulated to pF 2.36, slightly below field capacities, with the aim to promote conditions
25
abundant following rainfall events when peak N2O emissions are anticipated to occur.
BGD
2, 1353–1380, 2005Nitrous oxide from European forests
P. Ambus et al.
Title Page
Abstract Introduction
Conclusions References
Tables Figures
◭ ◮
◭ ◮
Back Close
Full Screen / Esc
Print Version
Interactive Discussion
EGU the Achenkirch and H ¨oglwald spruce sites, however, NH+4 constituted a less significant
source for N2O than NO −
3, indicating that denitrification is the most important process
for N2O production across these European forests. This observation is very much in agreement with previous works by Wolf and Brumme (2002; 2003) who found that den-itrification was responsible for N2O production in German beech forests, and Ambus
5
(1998) finding that denitrification was the only source for N2O in Danish spruce and beech forest stands. MacDonald et al. (1997) also found evidence that denitrification was the source for N2O in Scottish Sitka spruce plantations.
It must be emphasized that the current experiment can not distinguish if the15N2O
generated from 15NH+4 in treatment A was produced as an intermediate in NH+4
ox-10
idation or via nitrification denitrification reduction of nitrite (Fig. 1). In some sites, e.g. Hyyti ¨al ¨a, Speulderbos, and Sorø, labeled N2O was not produced in the presence
of labeled NH+4 in spite of a significant nitrification activity, which do imply that nitrifica-tion denitrificanitrifica-tion did not contribute to the N2O production in these soils. For soils with
modest N2O production from 15
NH+4 it can be argued that all N2O was produced by
ni-15
trification denitrification and that the isotope signal was diluted by unlabeled NO−2 from denitrification reduction of NO−3. However, it is still debatable whether the NO−2 prod-ucts from nitrification NH+4 oxidation and denitrification NO−3 reduction, respectively, do mix in the soil due to diffusional constraints (Russow et al., 2000). In the San Rossore pine stand the lack of15NH+4 derived N2O was very likely due to the limited nitrification
20
capacity (Fig. 4).
The key role of nitrification in the control of N2O production was thus mostly due to
the supply of substrate for denitrification, except for the H ¨oglwald and Achenkirch sites where N2O was produced by either pathway. The ratio between N2O production and gross nitrification averaged 0.67% and 0.44%, respectively, for the deciduous soils and
25
BGD
2, 1353–1380, 2005Nitrous oxide from European forests
P. Ambus et al.
Title Page
Abstract Introduction
Conclusions References
Tables Figures
◭ ◮
◭ ◮
Back Close
Full Screen / Esc
Print Version
Interactive Discussion
EGU 2004). The study by Venterea et al. (2004) suggests that these responses to increased
N deposition may be explained by increased nitrification, although in sites with exces-sive NO−3 consumption the N saturation symptoms will be less apparent (Vervaet et al., 2004). Our study suggests that increased nitrification in response to accelerated N inputs generally may lead to increased N2O emissions from a wide range of European
5
forest ecosystems. The positive relationship between N2O emissions and gross- and
net nitrification observed among the different forest systems is generally also in sup-port of the “hole-in-the-pipe” model proposed by Firestone and Davidson (1989). This conceptual model predicts that nitrogen oxide emissions from ecosystems is related to nitrogen cycling within the system with soil water as the most robust controller in
10
the ratio between produced nitric oxide (NO) and N2O (Davidson et al., 2000). In the current study we attempted to maintain comparable soil moisture conditions across the sites and thereby narrow the NO:N2O ratio and found the relationship between N2O
emission and nitrification to be true across multiple forest ecosystems with variable physical and chemical properties.
15
5. Conclusions and perspective
Nitrous oxide emissions were measured from soil samples collected in 11 different Eu-ropean forests. The data indicate that N2O emission rates are greater from deciduous
forest types compared with coniferous forest types. Changes in forest composition in response to land use activities and global change may thus have implications for
20
regional budgets of greenhouse gases. The result emphasizes the need to include various forest types in field-based experiments on forest N2O fluxes. From the study
it also became clear that N2O emissions were driven by the nitrification activity across
all sites, although the N2O was produced per se mainly from denitrification. Increased nitrification in response to accelerated N inputs predicted for forest ecosystems in
Eu-25
rope may thus lead to increased greenhouse gas emissions from forest ecosystems.
BGD
2, 1353–1380, 2005Nitrous oxide from European forests
P. Ambus et al.
Title Page
Abstract Introduction
Conclusions References
Tables Figures
◭ ◮
◭ ◮
Back Close
Full Screen / Esc
Print Version
Interactive Discussion
EGU
by the European Commission DG Research under the 5th Framework Programme.
References
Ambus, P.: Nitrous oxide production by denitrification and nitrification in temperate forest, grass-land and agricultural soils, Eur. J. Soil Sci., 49, 495–502, 1998.
Ambus, P. and Christensen, S.: Spatial and seasonal nitrous oxide and methane fluxes in
5
Danish forest-, grassland-, and agroecosystems, J. Environ. Qual., 24, 993–1001, 1995. Bowden, R. D., Steudler, P. A., and Melillo, J. M.: Annual nitrous oxide fluxes from temperate
forest in the Northeastern United States, J. Geophys. Res., 95, 13 997–14 005, 1990. Butterbach-Bahl, K., Gasche, R., Breuer, L., and Papen, H.: Fluxes of NO and N2O from
temperate forest soils: impact of forest type, N deposition and of liming in the NO and N2O
10
emissions, Nutr. Cycl. Agroecosys., 48, 79–90, 1997.
Butterbach-Bahl, K., Kesik, M., Miehle, P., Papen, H., and Li, C.: Quantifying the regional source strength of N-trace gases across agricultural and forest ecosystems with process based models, Plant Soil, 260, 311–329, 2004.
Conrad, R.: Microbiological and biochemical background of production and consumption of
15
NO and N2O in soil, in: Trace Gas Exchange in Forest Ecosystems, edited by: Gasche, R., Papen, H., and Rennenberg, H., Kluwer Academic Publishers, Dordrecht, Netherlands, 3–33, 2002.
Dalsgaard, T., Canfield, D. E., Petersen, J., Thamdrup, B., and Acu ˜nja-Gonz ´alez, J.: N2 pro-duction by the anammox reaction in the anoxic water column of Golfo Dulce, Costa Rica,
20
Nature, 422, 606–608, 2003.
Davidson, E. A., Keller, M., Erickson, H. E., Verchot, L. V., and Veldkamp, E.: Testing a concep-tual model of soil emissions of nitrous and nitric oxides, BioScience, 50, 667–680, 2000. Firestone, M. K. and Davidson, E. A.: Microbiological basis of NO and N2O production and
consumption in soil, in: Exchange of Trace Gases between Terrestrial Ecosystems and the
25
Atmosphere, edited by: Andreae, M. O. and Schimel, D. S., John Wiley and Sons Ltd, 7–21, 1989.
BGD
2, 1353–1380, 2005Nitrous oxide from European forests
P. Ambus et al.
Title Page
Abstract Introduction
Conclusions References
Tables Figures
◭ ◮
◭ ◮
Back Close
Full Screen / Esc
Print Version
Interactive Discussion
EGU
J. T., Ding, Y., Griggs, D. J., Noguer, M. van der Linden,, P. J., Dai, X., Maskell, K., and Johnson, C. A., Cambridge University Press, Cambridge, UK and New York, NY, USA, 2001. Kirkham, D. and Bartholomew, W. V.: Equations for following nutrient transformations in soil,
utilizing tracer data, Soil Sci. Soc. Am. Proc., 18, 33–34, 1954.
Kroeze, C., Aerts, R., van Breemen, N., van Dam, D., van der Hoek, K., Hofschreuder, P.,
5
Hoosbeek, M., de Klein, J., Kros, H., van Oene, H., Oenema, O., Tietema, A., van der Veeren, R., and de Vries, W.: Uncertainties in the fate of nitrogen I: An overview of sources of uncertainty illustrated with a Dutch case study, Nutr. Cycl. Agroecosys., 66, 43–69, 2003. Lovett G. M., Weathers K. C., Arthur M. A., and Schultz J. C.: Nitrogen cycling in a northern
hardwood forest. Do species matter?, Biogeochem., 67, 289–308, 2004.
10
MacDonald, J. A., Skiba, U., Sheppard, L. J., Ball, B., Roberts, J. D., Smith, K. A., and Fowler, D.: The effect of nitrogen deposition and seasonal variability on methane oxidation and ni-trous oxide emission rates in an upland spruce plantation and moorland, Atmos. Environ., 31, 3693–3706, 1997.
Menyailo, O. V., Hungate, B. A., and Zech, W.: The effect of single tree species in soil microbial
15
activities related to C and N cycling in the Siberian artificial afforestation experiment, Plant Soil, 242, 183–196, 2002.
Menyailo, O. and Huwe, B.: Activity of denitrification and dynamics of N2O release in soils under six tree species and grassland in central Siberia, J. Plant Nutr. Soil Sc., 162, 533–538, 1999.
20
Papen, H. and Butterbach-Bahl, K.: A 3-year continuous record of nitrogen trace gas fluxes from untreated and limed soil of a N-saturated spruce and beech forest ecosystem in Ger-many 1. N2O emissions, J. Geophys. Res.-Atmos., 104, 18 487–18 503, 1999.
Russow, R., Sich, I., and Neue, H.-U.: The formation of the trace gases NO and N2O in soils by the coupled processes of nitrification and denitrification: Results of kinetic 15N tracer
25
investigations, Chemosphere-Global Change Sci., 2, 359–366, 2000.
Schindlbacher, A. and Zechmeister-Boltenstern, S.: Effects of soil moisture and temperature on NO, NO2, and N2O emissions from European forest soils, J. Geophys. Res., 109, D17302, 2004.
Schmidt, J., Seiler, W., and Conrad, R.: Emission of nitrous oxide from temperate forest soils
30
into the atmosphere, J. Atmos. Chem., 6, 95–115, 1998.
BGD
2, 1353–1380, 2005Nitrous oxide from European forests
P. Ambus et al.
Title Page
Abstract Introduction
Conclusions References
Tables Figures
◭ ◮
◭ ◮
Back Close
Full Screen / Esc
Print Version
Interactive Discussion
EGU
Soil Poll., 116, 89–98, 1999.
Smolander A., Loponen J., Suominen K., and Kitunen V.: Organic matter characteristics and C and N transformations in the humus layer under two tree species,Betula pendulaandPicea abies, Soil Biol. Biochem., 37, 1309–1318, 2004.
Struwe, S. and Kjøller, A.: Potential for N2O production from beech (Fagus sylvaticus) forest
5
soils with varying pH., Soil Biol. Biochem., 26, 1003–1009, 1994.
Venterea, R. T., Groffman, P. M, Verchot, L. V., Magill, A. H., and Aber, J. D.: Gross nitrogen process rates in temperate forest soils exhibiting symptoms of nitrogen saturation, Forest Ecol. Manag., 196, 129–142, 2004.
Vervaet, H., Boeckx, P., Boko, A. M. C., Van Cleemput, O., and Hofman, G.: The role of gross
10
and net N transformation processes and NH+4 and NO−3 immobilization in controlling the mineral N pool of a temperate mixed deciduous forest soil, Plant Soil, 264, 349–357, 2004. Wolf, I. and Brumme, R.: Contribution of nitrification and denitrification sources for seasonal
N2O emissions in an acid German forest soil, Soil Biol. Biochem., 34, 741–744, 2002. Wolf, I. and Brumme, R.: Dinitrogen and nitrous oxide formation in beech forest floor and
15
mineral soils, Soil Sci. Soc. Am. J., 67, 1862–1868, 2003.
BGD
2, 1353–1380, 2005Nitrous oxide from European forests
P. Ambus et al.
Title Page
Abstract Introduction
Conclusions References
Tables Figures
◭ ◮
◭ ◮
Back Close
Full Screen / Esc
Print Version
Interactive Discussion
EGU
Table 1.List of sampling sites with information on geographical location, species composition of tree stands, dominant undergrowth vegetation and forest age. The sites are grouped according to major forest type.
Site (country) Location Tree species Dominant undergrowth Age (yrs) vegetation
Coniferous sites
Hyyti¨al¨a (SF) 61.85◦N 24.28◦E Scots pine Calluna vulgaris; 42 (Pinus sylvestris) Vaccinium sp.
Glencorse (GB) 55.85◦N 2.17◦E Sitka spruce None 19 (Picea sitchensis)
Speulderbos (NL) 52.22◦N 5.65◦E Douglas fir Scattered mosses 41 (Pseudotsuga menziesii)
H¨oglwald (D) 48.50◦N 11.17◦E Spruce (Picea abies) Mosses 110 Achenkirch (A) 47.58◦N 11.65◦E Spruce-beech Carex alba; 127
(Picea abies; Sesleria albicans;
Fagus sylvatica) Melica nutans
Nyirjes (HU) 47.89◦N 19.95◦E Spruce (Picea abies) None 40 San Rossore (I) 43.73◦N 10.28◦E Pine (Pinus pinaster) Pistacia lentiscus; 40
Erica arborea
Deciduous sites
Sorø (DK) 55.48◦N 11.63◦E Beech (Fagus sylvatica) Anemone nemorosa >80 Schottenwald (A) 48.23◦N 15.25◦E Beech (Fagus sylvatica) Allium ursinum, 142
Salvia glutinosa
Bosco negri (I) 45.20◦N 9.07◦E Oak (Quercus robur); Convallaria majalis; >150 Poplar (Populus spp); Anemone nemorosa
Ash (Fraxinus spp)
Parco Ticino (I) 45.20◦N 9.07◦E Poplar (Populus None 13
BGD
2, 1353–1380, 2005Nitrous oxide from European forests
P. Ambus et al.
Title Page
Abstract Introduction
Conclusions References
Tables Figures
◭ ◮
◭ ◮
Back Close
Full Screen / Esc
Print Version
Interactive Discussion
EGU
Table 2.Soil characteristics of the study sites.
Site Soil texture pH %C (dw) %N (dw) C:N BD§(g cm−3) WFPS!(%)
Hyyti ¨al ¨a Sandy loam 3.7 4.3 0.27 16.3 0.71 48±7
Glencorse Silty loam 4.2 4.5 0.32 13.8 0.78 55±11
Speulderbos Sand 3.7 6.9 0.26 26.4 0.85 66±14
H ¨oglwald Loam 3.7 12.5 0.56 22.7 0.33 62±13
Achenkirch Loam 7.0 14.1 0.80 17.8 0.43 68±14
Nyirjes Sandy loam 3.9 4.8 0.27 16.2 0.87 73±21
San Rossore Sand 5.8 2.7 0.08 35.9 0.86 38±8
Sorø Loamy sand 4.5 2.6 0.15 17.7 0.85 58±8
Schottenwald Silty loam 4.2 3.6 0.25 15.0 0.88 58±12
Bosco negri Loamy sand 4.2 5.6 0.42 12.5 0.58 50±12
Parco Ticino Sandy loam 5.9 1.2 0.10 12.0 1.15 70±28
§
Bulk density of incubated soil cores.
!
BGD
2, 1353–1380, 2005Nitrous oxide from European forests
P. Ambus et al.
Title Page
Abstract Introduction
Conclusions References
Tables Figures
◭ ◮
◭ ◮
Back Close
Full Screen / Esc
Print Version
Interactive Discussion
EGU
Table 3.Soil inorganic N contents at each sampling occasion.
Location Sampling time (month) Inorganic nitrogen content (µg N cm−3)
NH+4 NO−3
Hyyti ¨al ¨a Spring (May) 7.7§ 0.3§
Early summer (June) 0 0.7
Late summer (Aug.) 6.4 2.0
Autumn (Nov.) 30.3 0.2
Glencorse Spring (April) 7.1 11.1
Autumn (Dec.) 1.8 5.8
Speulderbos Spring (April) 3.7 0.5§
Autumn (Dec.) 6.1 5.4
H ¨oglwald Spring (April) 0.6 4.2
Autumn (Dec.) 1.1 2.2
Achenkirch Spring (April) 2.6 7.1
Autumn (Nov.) 2.9 1.6
Nyirjes Spring (n.a.) n.a. n.a.
Autumn (Dec.) 1.5 0.5
San Rossore Spring/Summer (June) 0 0.3
Autumn (Jan.) 1.3 0.4
Sorø Spring (May) 0§ 1.4§
Early summer (June) 8.3 0.2
Late summer (Sep.) 0.6 0.8
Autumn (Nov.) 0 1.2
Schottenwald Spring (April) 3.5 6.8
Autumn (Nov.) 0.4 5.5
Bosco negri Spring (May) 2.8 11.3
Autumn (Jan.) 5.3 13.3
Parco Ticino Spring (May) 19.7 11.0
Autumn (n.a.) n.a. n.a.
§
BGD
2, 1353–1380, 2005Nitrous oxide from European forests
P. Ambus et al.
Title Page
Abstract Introduction
Conclusions References
Tables Figures
◭ ◮
◭ ◮
Back Close
Full Screen / Esc
Print Version
Interactive Discussion
EGU
Table 4.The contribution of NH+4 and NO−3 to N2O formation. The numbers are percent of pro-duced N2O derived from15N-labeled NH+4 (treatmentA) and NO−3 (treatmentN), respectively.
Location Sampling time (month) Contribution to N2O (%) 15
NH+4 (treatmentA) 15NO−3 (treatmentN)
Hyyti ¨al ¨a Spring (May) 0 50
Early summer (June) 0 60
Late summer (Aug.) ∼100 19
Autumn (Nov.) 0 88
Glencorse Spring (April) 32 19
Autumn (Dec.) n.a. 53
Speulderbos Spring (April) 0 37
Autumn (Dec.) 40 84
H ¨oglwald Spring (April) 92 100
Autumn (Dec.) n.a. 100
Achenkirch Spring (April) 100 80
Autumn (Nov.) ∼100 ∼100
Nyirjes Spring (n.a.) n.a. ∼100
Autumn (Dec.) n.a. n.a.
San Rossore Spring/Summer (June) 0 33
Autumn (Jan.) 0 19
Sorø Spring (May) 0 62
Early summer (June) 27 47
Late summer (Sep.) 0 40
Autumn (Nov.) n.a. 18
Schottenwald Spring (April) 2 100
Autumn (Nov.) 12 47
Bosco negri Spring (May) 21 45
Autumn (Jan.) 53 69
Parco Ticino Spring (May) 22 53
Autumn (n.a.) n.a. n.a.
BGD
2, 1353–1380, 2005Nitrous oxide from European forests
P. Ambus et al.
Title Page
Abstract Introduction
Conclusions References
Tables Figures
◭ ◮
◭ ◮
Back Close
Full Screen / Esc
Print Version
Interactive Discussion
EGU
Denitrification
Nitrification
N
2O
Nitrous oxide
NO
3
-Nitrate
NO
2
-Nitrite
NH
2OH
Hydroxylamine
NH
4+
Ammonium
BGD
2, 1353–1380, 2005Nitrous oxide from European forests
P. Ambus et al.
Title Page
Abstract Introduction
Conclusions References
Tables Figures
◭ ◮
◭ ◮
Back Close
Full Screen / Esc
Print Version
Interactive Discussion
EGU
Zero N
0 20 40
Parco Ticino Schottenwald Bosco negri Sorø Höglwald Achenkirch Nyirjes Glencorse San Rossore Speulderbos Hyytiälä
Treatment A
ng N2O-N cm-3 d-1
0 25 50 100 200
Treatment N
0 25 50 100 200
Deciduous
C
oniferous
BGD
2, 1353–1380, 2005Nitrous oxide from European forests
P. Ambus et al.
Title Page
Abstract Introduction
Conclusions References
Tables Figures
◭ ◮
◭ ◮
Back Close
Full Screen / Esc
Print Version
Interactive Discussion
EGU Treatment A (15NH4+)
0.0 0.5 1.0
Parco Ticino Schottenwald Bosco negri Sorø Höglwald Achenkirch Nyirjes Glencorse San Rossore Speulderbos Hyytiälä
Treatment N (15NO3-)
atom% 15N excess
0.0 1.0 2.0
NH4 NO3 N2O
Deciduous
C
oniferous
Fig. 3. Nitrogen-15 enrichments of soil NH+4, soil NO−3 and emitted N2O, respectively, after
15
BGD
2, 1353–1380, 2005Nitrous oxide from European forests
P. Ambus et al.
Title Page
Abstract Introduction
Conclusions References
Tables Figures
◭ ◮
◭ ◮
Back Close
Full Screen / Esc
Print Version
Interactive Discussion
EGU Gross N turnover
0 5 10 15 20
Hyytiälä
Speulderbos
San Rossore
Glencorse
Nyirjes
Achenkirch
Höglwald
Sorø
Bosco negri
Schottenwald
Parco Ticino
Mineralization Nitrification
Net nitrification
µg N cm-3 d-1
-10 -5 0 5 10
Deci
duous
Coniferous
BGD
2, 1353–1380, 2005Nitrous oxide from European forests
P. Ambus et al.
Title Page
Abstract Introduction
Conclusions References
Tables Figures
◭ ◮
◭ ◮
Back Close
Full Screen / Esc
Print Version
Interactive Discussion
EGU
(B)
Gross nitrification (µg N cm-3 d-1)
0 1 2 3 4
LOG[ng N
2
O-N cm
-3 d -1]
-1 0 1 2
(A)
Gross mineralization (µg N cm-3 d-1)
0 2 4 6 8 10
-1 0 1 2
(C)
Net nitrification (µg N cm-3 d-1)
-10 -8 -6 -4 -2 0 2 4
-1 0 1 2
Deciduous Coniferous
R2=0.10n.s.
R2=0.22*
R2=0.02n.s.
![Fig. 5. X-Y scatter plots indicating the relationships between LOG[N 2 O emission] and gross N mineralization activity (A), gross nitrification activity (B), and net nitrification activity (C), re-spectively](https://thumb-eu.123doks.com/thumbv2/123dok_br/18392684.357744/28.918.247.462.35.521/indicating-relationships-emission-mineralization-activity-nitrification-nitrification-spectively.webp)
