www.soil-journal.net/1/707/2015/ doi:10.5194/soil-1-707-2015
© Author(s) 2015. CC Attribution 3.0 License.
SOIL
Effect of biochar and liming on soil nitrous oxide
emissions from a temperate maize cropping system
R. Hüppi1,2, R. Felber1, A. Neftel1, J. Six2, and J. Leifeld1
1Climate and Air Pollution Group, Agroscope Institute for SustaInability Sciences, Zurich, Switzerland
2Department of Environmental Science, Institute of Agricultural Sciences, ETH Zurich, Zurich, Switzerland
Correspondence to:R. Hüppi ([email protected])
Received: 1 July 2015 – Published in SOIL Discuss.: 27 July 2015
Revised: 17 November 2015 – Accepted: 30 November 2015 – Published: 15 December 2015
Abstract. Biochar, a carbon-rich, porous pyrolysis product of organic residues may positively affect plant yield
and can, owing to its inherent stability, promote soil carbon sequestration when amended to agricultural soils.
Another possible effect of biochar is the reduction in emissions of nitrous oxide (N2O). A number of laboratory
incubations have shown significantly reduced N2O emissions from soil when mixed with biochar. Emission
mea-surements under field conditions however are more scarce and show weaker or no reductions, or even increases
in N2O emissions. One of the hypothesised mechanisms for reduced N2O emissions from soil is owing to the
in-crease in soil pH following the application of alkaline biochar. To test the effect of biochar on N2O emissions in a
temperate maize cropping system, we set up a field trial with a 20 t ha−1biochar treatment, a limestone treatment
adjusted to the same pH as the biochar treatment (pH 6.5), and a control treatment without any addition (pH 6.1).
An automated static chamber system measured N2O emissions for each replicate plot (n=3) every 3.6 h over
the course of 8 months. The field was conventionally fertilised at a rate of 160 kg N ha−1in three applications of
40, 80 and 40 kg N ha−1as ammonium nitrate.
Cumulative N2O emissions were 52 % smaller in the biochar compared to the control treatment. However, the
effect of the treatments overall was not statistically significant (p=0.27) because of the large variability in the
data set. Limed soils emitted similar mean cumulative amounts of N2O as the control. There is no evidence that
reduced N2O emissions with biochar relative to the control is solely caused by a higher soil pH.
1 Introduction
Agriculture faces major challenges regarding world food security because of climate change, continued population growth and resource-depleting practises (IAASTD, 2009). Accounting for roughly 12 % of anthropogenic greenhouse gas (GHG) emissions per year, agriculture is a sector with a considerable mitigation potential and, at the same time, is highly vulnerable to the consequences of a changing climate (IPCC, 2014). With its 300-fold warming potential compared
to CO2, nitrous oxide (N2O) from soil is a downside of the
large productivity increase in agriculture, mostly due to syn-thetic nitrogen fertiliser application. Reducing agricultural
N2O emissions would reduce the GHG induced radiative
forcing (IPCC, 2014), improve the stability of the
strato-spheric ozone layer (Ravishankara et al., 2009) and reduce agriculture’s energy intensity when achieved with a lower ni-trogen fertiliser use (IAASTD, 2009).
Biochar is produced by thermal decomposition of organic material in a low-oxygen environment, called pyrolysis. This stable charcoal-like material has the potential to contribute to the mitigation of climate change by increasing soil carbon (C) (Lehmann, 2007; Woolf et al., 2010; Lal et al., 2011). In addition, biochar can increase crop yields (Jeffery et al., 2011; Biederman and Harpole, 2013; Crane-Droesch et al., 2013) and reduce water stress, which helps to adapt to cli-mate change (Mulcahy et al., 2013). Its application to soils that have a small cation exchange capacity and low organic carbon content is associated with higher crop yields (Crane-Droesch et al., 2013), with an overall mean response of 10 %
(Jeffery et al., 2011). For fertile, temperate soils improve-ment of soil quality is not key to biochar application. Rather,
biochar effects on soil-borne GHG emissions, N2O in
partic-ular, have become a strong argument for its amendment. Biochar also controls nitrogen (N) cycling (Clough et al., 2013). Biochar can reduce N leaching (Steiner et al., 2008; Güereña et al., 2013) and soil-borne N-containing GHG
(Van Zwieten et al., 2015). Especially N2O emissions from
soil are reduced on average by 54 % in lab studies and 28 % in field measurements (Cayuela et al., 2015). In field situations,
N2O reduction effects are typically difficult to verify because
of less uniform conditions and a large spatial and temporal variability of fluxes (Felber et al., 2013; Schimmelpfennig et al., 2014). A few field experiments indicated an increase in
N2O (e.g., Verhoeven and Six, 2014; Liu et al., 2014), many
showed no significant effects (Karhu et al., 2011; Scheer et al., 2011; Suddick and Six, 2013; Anderson et al., 2014; Angst et al., 2014) while other studies indicated decreasing
N2O emissions (e.g., Van Zwieten et al., 2010; Zhang et al.,
2010; Taghizadeh-Toosi et al., 2011; Felber et al., 2013; Case et al., 2014). Only few studies with biochar have looked at
N2O emissions beyond 120 days (Verhoeven and Six, 2014),
hence there is a large uncertainty about longer term effects of biochar addition.
Biochars are often alkaline and therefore increase soil pH after application (Joseph et al., 2010). Denitrifying
bacte-rial communities have the potential to increase their N2
O-reducing activity with increasing pH, which may reduce N2O
emissions from soils (Cavigelli and Robertson, 2001; Simek and Cooper, 2002; ˇCuhel et al., 2010). Low pH possibly
im-pedes the synthesis of a functional N2O reductase enzyme
(Bakken et al., 2012). Some authors suggest that the elevated
soil pH is responsible for reduced N2O emissions following
biochar application through increased activity of N2O
reduc-ing bacteria (Van Zwieten et al., 2010; Zheng et al., 2012). In contrast, Yanai et al. (2007) argue that the suppression of
N2O emissions by biochar is not through increased N2O
re-duction activity because biochar ash also increases soil pH
but does not reduce N2O emissions. Cayuela et al. (2013)
showed that biochar’s acid buffer capacity was a more impor-tant factor in denitrification than the pH shift in soil. There are indications that biochar enhances nosZ expression, the
gene responsible for the transcription of the N2O reductase
in denitrifying microorganisms (Harter et al., 2014; Van Zwi-eten et al., 2014). This could be a mechanistic link to the
ob-served reduction in N2O emissions through biochar
increas-ing soil pH and microbial activity. In contrast, under condi-tions favouring nitrification and not being as sensitive to pH
as total denitrification, biochar addition increased N2O
emis-sions in the lab (Sánchez-García et al., 2014) and possibly in the field (Verhoeven and Six, 2014).
In this study, we test (i) whether N2O emissions are
re-duced following the application of biochar to soil of a tem-perate maize cropping system and (ii) whether this
possi-ble reduction in N2O emissions is similar when soil pH is
increased by other means. The latter was tested by a treat-ment where limestone was added to increase soil pH to the
same level as that from the addition of 20 t ha−1biochar. N
2O emissions and maize yield were quantified during one grow-ing season in the field.
2 Method
2.1 Field site
The experiment was established on a cropland field near the Agroscope research station in Zurich, Switzerland
(47.427◦N, 8.522◦E, 437 m a.s.l.). The climate is
temper-ate with a mean annual air temperature of 9.4◦C and mean
annual rainfall of 1054 mm (Climate data 1981–2010, Me-teoswiss, 2013 from the MeteoSwiss station Zurich Affoltern 500 m from the experimental site). The field was under con-ventional management with maize in 2013, the year prior to the experiment.
The soil is a clay loam with a particle size distribution of 37 % sand, 27 % silt and 36 % clay. The soil is a Eutric Mollic Gleysol (Drainic) (IUSS Working Group WRB, 2014). The
untreated soil has a pH of 6.3 in water (1:2.5w/v), total
organic carbon content of 26.2 g kg−1, total N of 2.9 g kg−1
and bulk density of 1.3 g cm−3.
2.2 Biochar
Several biochars were screened in advance to pick one with a high liming capacity and with properties in agreement to the guidelines for contents of polycyclic aromatic hydrocarbons (PAHs), C and N of the European Biochar Certificate (EBC, 2012). The chosen biochar was produced in a Pyreg reac-tor (Pyreg GmbH, Dörth, Germany) by Verora in Edlibach ZG, Switzerland in late 2013 (see chapter 30, case study 2 in Lehmann and Joseph, 2015). Pyreg reactors use slow pyroly-sis in a continuous system with an average residence time of circa 25 min and a peak temperature of approximately
650◦C. The feedstock was green waste mainly from tree
pruning. The biochar has the following properties: 64.9 %
to-tal C; 62.1 % Corg, pH 9.8 (1:10 in water); liming capacity
17.2 % CaCO3, 148 m2g−1BET surface area and ash content
20 %. Elemental ratios are 0.11 O/C and 0.33 H/C molar
and 94 C/N by mass. Moisture content at the time of
appli-cation was 12 %. Biochar was sieved<3 mm shortly before
it was spread on the field.
2.3 Experimental setup
Three different treatments were introduced: 20 t ha−1
biochar, control without additions and a limestone treatment to increase the soil pH to the same level as with biochar. The
field was split into 3×3 plots with a size of 2 by 3 m (6 m2
The three different treatments were arranged in a randomised
complete block design with the 3×3 grid accounting for
spa-tial variability. The whole field, including the buffer zones, were planted with maize (Zea mays). Initial pH values were not different among treatment plots (see pH measurement from January 2014 in Fig. 2).
2.4 Field management
The field was ploughed in autumn 2013 after the maize
har-vest. In January 2014, 20 t ha−1 biochar and 2 t ha−1
lime-stone, respectively, were spread on the wet, ploughed field surface. Freshly applied biochar was gently mixed with the first 1–3 cm of soil by hand at the same time. In mid-February 2014, the automated GHG chamber system was installed and in March the field was harrowed by a rototiller to a depth of circa 15 cm. The chamber frames were reset into the soil again and Decagon TE5 temperature and humidity sensors (Decagon Devices Inc., Pullman, WA, USA) were placed at a depth of 8 cm in the centre of each plot. The TE5 sensor measures the volumetric water content in soil by time do-main reflectometry (TDR) at 70 MHz.
In May, potassium (K) and phosphorus (P) fertiliser was
applied at a rate of 41.4 kg P ha−1and 132 kg K ha−1.
Nitro-gen was applied in three portions of 40, 80 and 40 kg N ha−1
on the 26 May, 16 June and 16 July, respectively, as ammo-nium nitrate (LONZA-Ammonsalpeter 27.5 % N). At each
event fertiliser was spread on each plot of 6 m2and chamber
frame of 0.03 m2separately to ensure equal distribution. On
the 5 May, two of the three lime replicates were treated with
another 1 t ha−1of limestone because the pH was not in the
same range as the biochar plots. Maize (Padrino from KWS SAAT AG, Einbeck, Germany) was sown on the 8 May with 0.14 m distance within rows that were 0.6 m apart from each other. For plant protection only one herbicide application was
conducted on the 19 June with 1 L ha−1 Dasul (Syngenta,
Basel, Switzerland), 1 L ha−1Mikado (Bayer CropScience,
Germany) and 1 kg ha−1Andil (Omya AG, Switzerland).
De-spite manual weeding and herbicides a considerable amount of weeds emerged. Plots were harvested on the 13 October.
2.5 Nitrous oxide measurement
N2O and CO2emissions were measured with static chambers
of a fully automated measurement system (Flechard et al., 2005; Felber et al., 2013) consisting of nine stainless steel
chambers (30×30×25 cm). These chambers were placed
on PVC frames inserted 3 cm deep into soil. The frame po-sitions were moved three times during the growing season to obtain a better spatial representation of each plot. After maize had been sown, the chamber positions were between rows and no vegetation was grown within the chamber frame. Each of the nine chamber lids was automatically closed and
opened sequentially (over a period of 3.6 h) allowing N2O
and CO2to accumulate in the chamber headspace for 15 min.
Chamber headspace air was circulated (1 L min−1 air flow)
through an inlet and outlet line from each chamber through polyamide tubes (4 mm I.D.) to the analytical system and back to the chamber headspace after sample analysis. The analytical and chamber control instruments were installed in a nearby field cabin under temperature-controlled air
con-ditioning. N2O concentrations were continuously measured
and stored every minute using a gas filter correlation anal-yser (TEI Model 46c, Thermo Fisher Scientific, Waltham, MA, USA). The gas stream is exposed to infrared light from
specific bands (filtered), both from N2O absorbing and
non-absorbing bands. From this difference a gas specific and concentration-sensitive signal is retrieved. The instruments
linearity is described with±2 % with negligible interference
of H2O, CO2 or CO. CO2 was measured with an infrared
sensor from Liston Scientific Corp. (Irvine, CA, USA). The system was calibrated every 11 h with three different con-centrations from certified gas standards (Carbagas, Rümlang,
Switzerland). The N2O analyser showed a drift with room
temperature variations that the air conditioning could not avoid completely. Hence a temperature correction factor was applied to the raw data from a regression of the device tem-perature with data during calibrations in May. The
tempera-ture correction factor used was about 9.1 ppm per◦C
temper-ature change from the 37◦C device reference temperature.
The mean N2O analyser device temperature in June–July was
37.4±2◦C (±1 SD).
N2O and CO2 fluxes from soil were calculated from
the continuous concentration measurement (resolution 1 per min) when chamber lids were closed. Data from the first 3 min of the total 15 min closure time were omitted from the flux calculation to remove signal noise due to gas ex-change from the system during chamber switching and clos-ing (Felber et al., 2013). The same flux estimation procedure (R-script by R. Fuss on bitbucket.org, see Fuss, 2015) was used as in Leiber-Sauheitl et al. (2014). It is a modification of the HMR package (Pedersen et al., 2010) that chooses between exponential curvature for non-linear chamber be-haviour (Hutchinson-Mosier regression) and robust linear re-gression (Huber and Ronchetti, 1981). The exponential HMR scheme considers non-linear concentration increase in the chamber due to a possibly decreasing concentration gradi-ent, chamber leakage and lateral gas transport. Robust lin-ear regressions provide a more reliable flux estimate for low fluxes when there is a lot of variation due to limited mea-surement precision and outliers. Following the flux script’s recommendation, non-linear HMR was used for 1034 fluxes, whereas for all the other 13 034 fluxes the robust linear re-gression was chosen. The resulting flux estimates from this
procedure were then filtered for implausible large N2O
up-take by soil (i.e. when the ambient N2O concentration
sud-denly drops with increased mixing in the boundary layer).
N2O fluxes smaller than−10 ng N2O m−2s−1(Neftel et al.,
2010) were removed as well as data associated with a likely invalid chamber functioning (i.e. frozen lids) indicated by
CO2fluxes<−0.5 µmol m−2s−1(Felber et al., 2013). From the entire data set of 14 068 fluxes, 302 were rejected due
to the CO2flux threshold and an additional 49 fluxes due to
N2O (2.5 % of the total number of fluxes removed).
Consid-ering a cumulative sum of all fluxes in the data set, filtConsid-ering reduced this number by 0.61 %.
2.6 Yield
The harvest (above-ground biomass) was separated into grain yield (kernels) and by-product (stems, leaves). Cobs were threshed and dried whereas the by-product was weighed freshly on the field, chaffed and a sub-sample was then dried to measure water content and for further plant nutrient anal-ysis. From both grains and by-product, dry matter total N, P, K, Ca and Mg content were measured (FAL, 1996). For
yield based N2O emissions, cumulative N2O emissions in kg
N2O-N ha−1were related to total above-ground biomass dry
matter (DM) yield in t ha−1(see Table 3) and to total
above-ground N uptake in kg N ha−1(see discussion).
2.7 Soil sampling and analysis
Soil samples for pH, ammonium (NH+
4) and nitrate (NO−3)
measurements were taken on the 31 January, 31 March, 26 May, 16 June and 4 September 2014. At each sampling, five randomly distributed soil cores per plot were taken (0– 10 cm) and pooled. Soil pH was determined in moist soil
samples using water at a ratio of 1:2.5w/vand measured
with a PH100 ExStik pH meter (Extech Instruments Corp., Nashua, NH, USA). Soil bulk density was measured on the
27 June at a depth of 3–8 cm using 100 cm3steel cores, 3 per
plot.
For soil NO−
3 and NH+4 concentrations, 20 g of moist soil
were mixed with 100 mL 0.01 M CaCl2 solution. The
sus-pension was shaken for 30 min, filtered and then analysed by segmented flow injection analysis on a SKALAR SANplus analyser (Skalar Analytical B.V., Breda, Netherlands).
2.8 Statistical analysis
The obtained fluxes from the automated chamber system were aggregated to 6 h means producing a regular, smoothed data set. The system was able to measure each chamber three times for every 11 h calibration cycle during regular opera-tions, hence on average 1.6 measurements for each chamber were included in each 6 h mean. Still missing values after this aggregation step were linearly interpolated for each chamber. Treatment averages and standard errors were calculated from the three chambers on the replicated plots. If not indicated
otherwise, treatment means are shown with±1 standard
er-ror (SE).
Statistical analyses were performed with R (version 3.0.1,
The R Project, 2014). Significance level was chosen atp <
0.05 for all procedures, unless indicated otherwise.
Sig-nificant treatment effects for cumulated fluxes were deter-mined using ANOVA from rbase package (treatments:
con-trol, biochar and lime;n=3). Bartlett test of homogeneity of
variances showed conflicting ANOVA assumptions for the cumulative fluxes. This could be improved by log transfor-mation of the flux data.
3 Results
3.1 Environmental field conditions
The year started with above-average temperatures and low rainfall (Fig. 1). End of May to June was dry with high
tem-peratures being on average for Switzerland 1.5◦C above the
1981–2010 norm (Meteoswiss, 2015). The soil’s volumetric water content fell to circa 20 %, inducing high water stress on the young maize seedlings. The lack of soil moisture presumably hampered the dilution of the first application of
40 kg N ha−1in the soil solution. Along with the 2nd N
fer-tilisation the field was therefore irrigated with 33 mm water (shown as green bar in Fig. 1). The summer months July and August were rather cold and wet with daily mean air
temper-atures below 20◦C (Meteoswiss, 2015).
Soil volumetric water content tended to be higher in biochar plots (Fig. 1) with 37 out of 423 (8.7 %) half-daily means showing a statistically significant treatment effect.
3.2 Soil pH and nitrogen
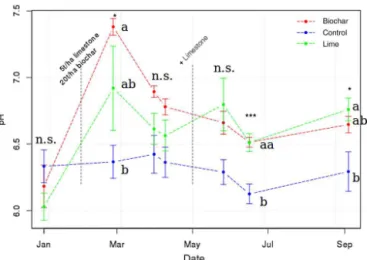
Soil pH increased with limestone and biochar addition by circa 0.4 pH units (Fig. 2). During the time with major emis-sions in June, the pH between control and biochar/lime soils
significantly (p <0.001) increased from 6.1 to 6.5 with. The
initial soil pH was on average 6.3 and not different among treatments. Following biochar application soil pH increased to up to 7.4 whereas with addition of limestone soil pH in-creased to up to 6.9 (averages across replicates). The pH sharply decreased after the initial peak, especially in those two liming plots, which were treated subsequently with
an-other 1 t ha−1 in May. Soil pH of biochar and lime
treat-ments were not significantly different at any sampling time, whereas soil pH of the control treatment was systematically below that of the amended soils.
Mean soil bulk density was not statistically
differ-ent between treatmdiffer-ents (1.31±0.03 g cm−3 in the control,
1.29±0.07 g cm−3in biochar and 1.36±0.04 g cm−3in the
liming treatment).
Soil mineral N was not statistically different between treat-ments at any sampling date (Tables 1 and 2).
3.3 N2Ofluxes
fertilisa-Figure 1.Soil moisture means for each treatment are shown in red, blue and green solid lines with 1 SE as shaded area. Blue bars show the rainfall in mm d−1and the orange line is daily mean air temperature. The green bar indicates the irrigation of 33 mm with the second N
fertilisation.
Figure 2.Soil pH (mean with 1 SE bars) during the time of the
ex-periment. Significant differences (p <0.05) are indicated with stars
according ANOVA test and Tukey Honest Significant Differences (TukeyHSD) are indicated by different letters, n.s.=not significant.
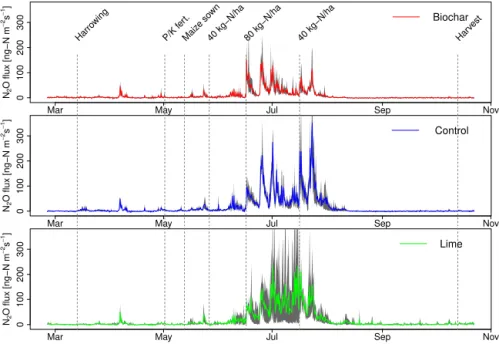
tion event with the highest application rate around early Au-gust. Afterwards, there were only emissions from one of the lime plots but almost none until the end of October from all the other plots. This also corresponds to the low amounts of available soil N, indicating that the plants had taken up most
of it. All treatments revealed similar temporal N2O
emis-sion dynamics but the height of the peaks differed. During peak events emissions from the biochar treatment were often lower than those from the other treatments, especially com-pared to the control. This resulted in an increasing difference
Table 1.Nitrate content (mg NO−
3-N kg−1) in soil during the
ex-periment. Standard error is indicated in brackets.
Date Biochar Control Lime 2014-01-31 2.77 (0.41) 2.92 (0.13) 3.12 (0.25) 2014-03-31 6.26 (0.98) 8.57 (0.77) 8.40 (0.76) 2014-05-26 3.13 (0.36) 7.54 (1.18) 5.86 (1.45) 2014-06-16 9.19 (1.66) 9.38 (3.69) 11.65 (1.24) 2014-09-04 1.30 (0.15) 1.09 (0.21) 1.33 (0.26)
Table 2.Ammonium content (mg NH+
4-N kg−1) in soil during the
experiment. Standard error is indicated in brackets.
Date Biochar Control Lime 2014-01-31 1.11 (0.07) 1.00 (0.12) 0.68 (0.05) 2014-03-31 0.42 (0.24) 0.36 (0.21) 0.25 (0.21) 2014-05-26 0.11 (0.08) 0.12 (0.07) 0.47 (0.40) 2014-06-16 0.45 (0.13) 2.48 (1.80) 1.67 (0.36) 2014-09-04 0.38 (0.33) 0.39 (0.14) 0.16 (0.06)
in cumulative fluxes (Fig. 4) between control and biochar. Mean cumulative emissions for the entire growing season
were 170±16.5, 353±31.7 and 359±164 mg N2O-N m−2
for biochar, control and lime treatments, respectively (see Ta-ble 3 for plotwise results). Relative to the control, mean
cu-mulative N2O emissions were 52 % smaller in the biochar
treatment. The whole treatment effect was, however, not
sta-tistically significant (p=0.26) due to the large variability in
Mar May Jul Sep Nov
0
100
200
300
N2
O
flux [ng−N m
−
2s
−
1]
Harro
win
g
P/K f
ert.
Maiz
e sow
n
40 kg−N/ha 80 kg−N/ha 40 kg−N/ha Harv
est
Biochar
Mar May Jul Sep Nov
0
100
200
300
N2
O
flux [ng−N m
−
2s
−
1]
Control
Mar May Jul Sep Nov
0
100
200
300
N2
O
flux [ng−N m
−
2s
−
1]
Lime
Figure 3.Mean N2O emissions for each treatment (coloured line) with highest and lowest replicate in grey.
Mar May Jul Sep Nov
0
100
200
300
400
500
600
Cu
m
u
la
ti
ve
N
O
fl
u
x
[
m
g
N
O
−
N
m
]
2
2
−
2
Biochar Control Lime
Harro
wing
P/K f
ert.
Maiz
e sow
n
40 kg−N/ha80 kg−N/ha 40 kg−N/ha Harv
est
Figure 4.Mean cumulative N2O fluxes as solid lines. Shaded areas
represent the standard error of the mean from the three replicates (dashed lines) per treatment.
the data set. Emission means from control and lime were very
similar. With lime, N2O emissions were highly variable and
this treatment included both the chamber with the highest and also the one with the lowest cumulative emission.
Alter-natively, we also calculatedpvalues comparing only biochar
and control treatments with a Welch Two-Samplettest. This
resulted in a significant difference (p=0.022). Allpvalues
have to be treated with caution because they were produced with a minimal number of replicates. Furthermore, a large
treatment effect size is not reflected in thepvalue.
N2O emissions per unit N applied calculated from the
160 kg N ha−1 with the mean cumulative emissions during
the growing season, resulted in 1.06 % for biochar, 2.21 % for control and 2.25 % for the lime treatment. Like cumu-lated emissions, these values were not significantly different
among treatments and have the same variance andpvalues.
3.4 Maize yields and plant growth
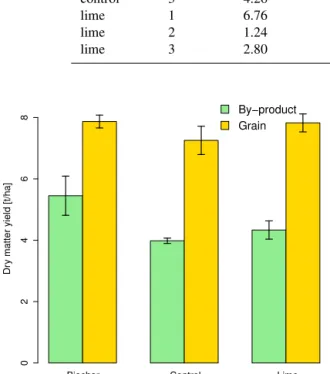
Maize yields were not significantly different between treat-ments, for both grains (product) and by-product (i.e. stems, leaves) (Fig. 5). Nitrogen uptake by maize did not dif-fer among treatments (Fig. 6, Table 3). Table 3 shows
cumulated N2O emissions for each plot and per area
as well as per DM yield. Yield based emissions
(Ta-ble 3) resulted in 0.128±0.010 kg N2O-N per t-DM, for
biochar, 0.319±0.036 kg N2O-N per t-DM for control and
0.306±0.148 kg N2O-N per t-DM for the liming treatment.
Although the yield based emission with biochar is 60 % lower compared to the control, overall there is no significant
treatment effect (p=0.19). There was no difference between
treatments for any of the measured nutrients in the yield (data not shown).
4 Discussion
4.1 N2Oemissions
Our high-frequency automated N2O chamber measurements
give a detailed picture of the emissions from a biochar and
lime field trial. Neither soil NO−
3 nor NH+4 concentrations
can explain N2O emission patterns at any point in time.
Although cumulative N2O emissions were not significantly
magni-Table 3.Cumulated N2O emission per area, above-ground dry matter yield and above-ground plant N uptake for each plot (grains, stems
and leaves).
Treatment Block N2O per area N2O per dry matter yield Above-ground plant N uptake [kg N2O-N ha−1] [kg N2O-N (t-DM)−1] [kg-N ha−1]
biochar 1 1.63 0.112 162
biochar 2 1.99 0.145 142
biochar 3 1.48 0.126 123
control 1 3.06 0.255 143
control 2 3.39 0.325 109
control 3 4.26 0.378 118
lime 1 6.76 0.591 121
lime 2 1.24 0.097 135
lime 3 2.80 0.230 131
Biochar Control Lime
Dr
y
m
a
tt
e
r y
ie
ld
[
t/
h
a
]
0
2
4
6
8 By−product
Grain
Figure 5.Grain yield and by-product biomass production (dry mat-ter yield). Error bars show 1 SE (n=3).
tude of reduction is in agreement with the meta-analysis of Cayuela et al. (2015), who showed a general reduction of
N2O emissions by biochar of 49±5 % (lab and field
exper-iments) but it is larger than the reduction found by the same
authors under field conditions (28±16 %). In our maize field
in the temperate zone, N2O emissions can thus decrease with
biochar addition as much as they have been shown to be re-duced under controlled lab conditions.
Our results show no decrease in N2O emissions when
limestone is used to increase the soil pH to the same level as that with biochar. This finding does not support the
hy-pothesis that biochar’s N2O reduction effect is similar to a
geochemical adjustment of soil pH. However, it must be con-sidered that the large variability among the three replicates hampers the power of this conclusion. A post-hoc power analysis showed a 23.4 % probability of accepting a true al-ternative hypothesis considering the obtained results in
cu-mulative N2O emission. To have at least a power of 80 %
we would have needed 10 replicates for each treatment. The
Biochar Control Lime
Nitrogen uptak
e [kg−N/ha ]
0
20
40
60
80
100
120
By−product Grain
Figure 6.N uptake by grains and by-product (stem, leaves). Error
bars show 1 SE (n=3).
high variability solely in the liming treatment might be due to additional lime application to the field in May 2014 and the high spatial-temporal variability of that soil property in general. The two replicates that received additional limestone
were the ones that emitted more N2O than the other plot.
Hence, instead of reducing emissions by increasing the pH, the additional limestone application could have provoked lo-cal arbitrary disturbance to soil chemistry leading to
emis-sion hotspots. To determine the biochar effect on N2O
emis-sions, we therefore also compared only the biochar and con-trol treatments (see results); according to the analysis of that reduced data set, the cumulative emissions in the biochar amended plots were significantly lower (by 52 %) than in the control treatment.
Using the same measurement technique, application rate and similar biochar properties Felber et al. (2013) also
re-ported N2O emission reductions, but smaller as compared to
the difference we saw between biochar and control. In line
with our results other field studies have shown significant
reductions in N2O emissions following biochar amendment
(Taghizadeh-Toosi et al., 2011; Liu et al., 2012). A num-ber of studies found no significant effect of biochar addi-tion in the field (Schimmelpfennig et al., 2014; Angst et al., 2014; Scheer et al., 2011; Karhu et al., 2011; Anderson et al., 2014). Often the much higher variability in the field and the low number of replications make it difficult to reproduce reduction effects observed in laboratory studies. In particu-lar, Angst et al. (2014) found no significant difference but there was a tendency for lower emissions with biochar ad-dition, suggesting that the variability in the field was too high to get significant effects. However there are also stud-ies that showed increased emissions from biochar applica-tion in the field (Verhoeven and Six, 2014; Shen et al., 2014). There is a large variability of biochar properties and effect size between these field studies. Since the driving
mecha-nism of how biochar reduces N2O emissions from soil are
still unknown, it can only be shown by meta-analysis that a
low H:Corg ratio seems to beneficial for N2O suppression
(Cayuela et al., 2015).
Biochar has been shown to increase water-holding capac-ity and reduce bulk denscapac-ity (Peake et al., 2014). Mukherjee
et al. (2014) showed that 92 % decrease in N2O emissions
by biochar coincided with reduced bulk density by 13 % and increased soil nanopore surface area by 12 % relative to the control. In our experiment there are some situations where in-creased volumetric water content with biochar coincide with
reduced N2O emissions (Fig. 1 and 2). Although there was
no significant difference in bulk density, supposed increase in nanopore surface provides both suitable pores for water retention and oxygen air. Overall the improved soil aeration by biochar dominates the effect of increased water content and hence does not favour denitrification (Van Zwieten et al., 2010).
Sánchez-García et al. (2014) found that biochar increases
soil N2O emissions produced by nitrification-mediated
path-ways. In our study, the water content (Fig. 1) was high during periods of high emissions, suggesting that during periods of
high water content denitrification dominates the N2O
pro-duction in soil. The high emissions were thus often triggered by large precipitation events. There are many indications
from lab experiments that biochar can reduce N2O
emis-sions in denitrifying conditions at high water content (Yanai et al., 2007; Singh et al., 2010; Felber et al., 2013; Harter et al., 2014). Under denitrification conditions, the pH
be-tween 6 and 8 exerts control over the N2O:N2ratio (Stevens
et al., 1998), especially with a pH of the soil below 7, when
the reduction of N2O to N2 is inhibited by acid conditions
(Simek and Cooper, 2002). Various studies have suggested
that an elevated soil pH is responsible for reduced N2O
emis-sions following biochar application through increased
ac-tivity of N2O reducing bacteria (Van Zwieten et al., 2010;
Zheng et al., 2012). In contrast, Yanai et al. (2007) argued
that the suppression of N2O emissions by charcoal is not
due to increased N2O reduction activity with increased soil
pH because biochar ash increased the pH to the same
de-gree as biochar, but did not reduce N2O emissions. In the
lab, Cayuela et al. (2013) found no N2O mitigation when soil
pH was increased to the same level as biochar did but with
CaCO3addition. They also showed that biochar’s buffer
ca-pacity but not biochar pH was highly correlated with lower
N2O emissions compared to pH-adjusted biochars (Cayuela
et al., 2013). In our case, we used a biochar with rather high
liming capacity (17.2 % CaCO3) and pH (9.8). We can
con-firm that with this kind of biochar N2O emissions can
effec-tively be reduced also in real field conditions, although the high variability in the limed treatments does not allow us to
reject the hypothesis of soil pH being the major driver of N2O
emission reductions.
More recent studies show that biochar enhances nosZ
abundance in soil bacteria, which can lead to lower N2O
emissions (Harter et al., 2014; Van Zwieten et al., 2014).
Some authors relate this enhancement of N2O reducing
bac-teria to biochar’s redox activity that facilitates electron
shut-tling for the sensitive process of N2O reduction (Kappler
et al., 2014; Cayuela et al., 2013). This shuttling might be
the connection between reduced N2O emissions and low
H:Corgratios (Cayuela et al., 2015) in biochar that refers to
condensed aromatic structures and its quinone/hydroquinone moieties being electro-active by allowing electron transfer across conjugated pi-electron systems (Klüpfel et al., 2014). Such high electro-catalytic activity has also been shown in N-doped C nanotube arrays (Gong et al., 2009). Hence, in
con-trast to a promotion of microbial N2O reduction, there is also
the possibility that biochar abiotically reduces N2O through
its electrocatalytic abilities represented by a high
aromatic-ity with low H:Corgratios. Indeed, this is one of the various
abiotic mechanisms that reduce N2O emissions suggested by
Van Zwieten et al. (2015).
4.2 Yield and nutrients
a single rotational application (20 and 50 t ha−1) in a sandy loam under intensive management.
Nitrogen uptake was not changed by biochar or liming. Although there was no significant difference in P uptake between the treatments, by-product material from biochar-treated plots tended to have higher P uptake than the
con-trol (+100 % increase, data not shown). Vanek and Lehmann
(2014) showed significant increase in P availability through enhanced interactions between biochar and arbuscular myc-orrhizas.
Liu et al. (2012) reported a biochar application rate dependent decrease in emission intensity per yield, from
0.17 kg N2O-N t−1 in the control to 0.10 and 0.07 kg N2
O-N t−1 with 20 and 40 t ha−1 biochar applied. For an
agro-nomic assessment of N2O emissions it is most relevant to
relate the cumulative emissions to the yield (Van Groeni-gen et al., 2010). Emissions of the control per above-ground
N uptake (29.6 kg N2O-N (kg N)−1) are much higher than
the reported mean of 8.4 kg N2O-N (kg N)−1 at fertilisation
rates between 180 and 190 kg N ha−1(Van Groenigen et al.,
2010). With biochar however, this number decreases by 60 %, whereas with lime it remains at the level of the control
(p=0.21). Yield-based emissions are a good way to express
biochars effects both on N2O emissions and yield, but the
ex-perimental uncertainties of each data set are also cumulated within this number.
5 Conclusions
We found a 52 % reduction in N2O soil emissions from
biochar compared to control treatment in a maize field trial. This shows that also in temperate, intensive maize cropping
systems under real field conditions, N2O emissions can be
re-duced substantially by biochar. There is no evidence that the reduction with biochar, relative to control, is solely induced by a higher soil pH. The pH hypothesis is thus not supported by our data.
Acknowledgements. We would like to thank Markus Jocher for support with the chamber measurement technique, Martin Zuber and Robin Giger for chemical analysis in the laboratory, Sarah Grimm (ETHZ) for statistical consulting as well as Philipp Walter and Fritz Käser for agricultural field support.
Edited by: K. Kalbitz
References
Anderson, C. R., Hamonts, K., Clough, T. J., and Condron, L. M.: Biochar does not affect soil N-transformations or microbial com-munity structure under ruminant urine patches but does alter rel-ative proportions of nitrogen cycling bacteria, Agr. Ecosyst. En-viron., 191, 64–72, doi:10.1016/j.agee.2014.02.021, 2014. Angst, T. E., Six, J., Reay, D. S., and Sohi, S. P.: Impact of pine chip
biochar on trace greenhouse gas emissions and soil nutrient dy-namics in an annual ryegrass system in California, Agr. Ecosyst. Environ., 191, 17–26, doi:10.1016/j.agee.2014.03.009, 2014. Bakken, L. R., Bergaust, L., Liu, B., and Frostegard, A.: Regulation
of denitrification at the cellular level: a clue to the understanding of N2O emissions from soils, Philos. Trans. B, 367, 1226–1234, doi:10.1098/rstb.2011.0321, 2012.
Biederman, L. A. and Harpole, W. S.: Biochar and its effects on plant productivity and nutrient cycling: a meta-analysis, GCB Bioenergy, 5, 202–214, doi:10.1111/gcbb.12037, 2013. Case, S. D. C., McNamara, N. P., Reay, D. S., Stott, A. W., Grant,
H. K., and Whitaker, J.: Biochar suppresses N2O emissions while maintaining N availability in a sandy loam soil, Soil Biol. Biochem., 81, doi:10.1016/j.soilbio.2014.11.012, 2014. Cavigelli, M. A. and Robertson, G. P.: Role of denitrifier diversity
in rates of nitrous oxide consumption in a terrestrial ecosystem, Soil Biol. Biochem., 33, 297–310, 2001.
Cayuela, M. L., Sanchez-Monedero, M. A., Roig, A., Hanley, K., Enders, A., and Lehmann, J.: Biochar and denitrification in soils: when, how much and why does biochar reduce N2O emissions?,
Scientific Reports, 3, 1732, doi:10.1038/srep01732, 2013. Cayuela, M. L., Jeffery, S., and van Zwieten, L.: The molar
H:Corg ratio of biochar is a key factor in mitigating N2O
emissions from soil, Agr. Ecosyst. Environ., 202, 135–138, doi:10.1016/j.agee.2014.12.015, 2015.
Clough, T., Condron, L., Kammann, C., and Müller, C.: A Review of Biochar and Soil Nitrogen Dynamics, Agronomy, 3, 275–293, doi:10.3390/agronomy3020275, 2013.
Crane-Droesch, A., Abiven, S., Jeffery, S., and Torn, M. S.: Hetero-geneous global crop yield response to biochar: a meta-regression analysis, Environ. Res. Lett., 8, 044049, doi:10.1088/1748-9326/8/4/044049, 2013.
ˇCuhel, J., Šimek, M., Laughlin, R. J., Bru, D., Chèneby, D., Wat-son, C. J., and Philippot, L.: Insights into the Effect of Soil pH on N2O and N2 Emissions and Denitrifier Community Size and Activity, Appl. Environ. Microbiol., 76, 1870–1878, doi:10.1128/AEM.02484-09, 2010.
EBC, H.: European Biochar Certificate – Guidelines for a Sustain-able Production of Biochar, European Biochar Fondation (EBC), Arbaz, Switzerland, available at: http://www.european-biochar. org/en/download (last access: 25 March 2015), 2012.
FAL, R.: Schweizerische Referenzmethoden der Eidgenossischen Landwirtschaftlichen Forschungsanstalten, FAL-Eigenverlag, Zurich, 1996.
Felber, R., Leifeld, J., Horák, J., and Neftel, A.: Nitrous oxide emission reduction with greenwaste biochar: comparison of lab-oratory and field experiments, Eur. J. Soil Sci., 65, 128–138, doi:10.1111/ejss.12093, 2013.
Flechard, C. R., Neftel, A., Jocher, M., Ammann, C., and Fuhrer, J.: Bi-directional soil/atmosphere N2O exchange over two
mown grassland systems with contrasting management
tices, Global Change Biol., 11, 2114–2127, doi:10.1111/j.1365-2486.2005.01056.x, 2005.
Fuss, R.: ecoRoland/gasfluxes, available at: https://bitbucket.org/ ecoRoland/gasfluxes (last access: 24 February 2015), 2015. Gong, K., Du, F., Xia, Z., Durstock, M., and Dai, L.:
Nitrogen-Doped Carbon Nanotube Arrays with High Electrocatalytic Activity for Oxygen Reduction, Science, 323, 760–764, doi:10.1126/science.1168049, 2009.
Güereña, D., Lehmann, J., Hanley, K., Enders, A., Hyland, C., and Riha, S.: Nitrogen dynamics following field application of biochar in a temperate North American maize-based produc-tion system, Plant Soil, 365, 239–254, doi:10.1007/s11104-012-1383-4, 2013.
Harter, J., Krause, H.-M., Schuettler, S., Ruser, R., Fromme, M., Scholten, T., Kappler, A., and Behrens, S.: Linking N2O emis-sions from biochar-amended soil to the structure and function of the N-cycling microbial community, The ISME Journal, 8, 660– 674, doi:10.1038/ismej.2013.160, 2014.
Huber, P. and Ronchetti, E.: Robust Statistics, ser, Wiley Series in Probability and Mathematical Statistics. New York, NY, USA, Wiley-IEEE, 52, 54, 1981.
IAASTD, McIntyre, B. D., Herren, H. R., Wakhungu, R., and Wat-son, R. T.: Agriculture at a Crossroads – International Assess-ment of Agricultural Knowledge, Science and Technology for Development, Synthesis Report, HD1428.I547 2008, IAASTD, Washington DC, available at: http://www.unep.org/dewa/ assessments/ecosystems/iaastd/tabid/%105853/default.aspx (last access: 26 March 2015), 2009.
IPCC: Climate Change 2014: Synthesis Report, Contribution of Working Groups I, II and III to the Fifth Assessment Report of the Intergovernmental Panel on Climate Change, Tech. rep., IPCC, Geneva, Switzerland, available at: https://www.ipcc.ch/ report/ar5/syr/ (last access: 26 March 2015), 2014.
IUSS Working Group WRB: World Reference Base for Soil Re-sources 2014, World Soil ReRe-sources Reports No. 106. FAO, In-ternational soil classification system for naming soils and creat-ing legends for soil maps, Rome, 2014.
Jay, C. N., Fitzgerald, J. D., Hipps, N. A., and Atkinson, C. J.: Why short-term biochar application has no yield benefits: evidence from three field-grown crops, Soil Use Manage., 31, 241–250, doi:10.1111/sum.12181, 2015.
Jeffery, S., Verheijen, F., van der Velde, M., and Bastos, A.: A quan-titative review of the effects of biochar application to soils on crop productivity using meta-analysis, Agr. Ecosyst. Environ., 144, 175–187, doi:10.1016/j.agee.2011.08.015, 2011.
Joseph, S., Camps-Arbestain, M., Lin, Y., Munroe, P., Chia, C., Hook, J., van Zwieten, L., Kimber, S., Cowie, A., Singh, B., Lehmann, J., Foidl, N., Smernik, R., and Amonette, J.: An inves-tigation into the reactions of biochar in soil, Aust. J. Soil Res., 48, 501–515, doi:10.1071/SR10009, 2010.
Kappler, A., Wuestner, M. L., Ruecker, A., Harter, J., Halama, M., and Behrens, S.: Biochar as an Electron Shuttle between Bacteria and Fe(III) Minerals, Environ. Sci. Technol. Lett., 1, 339–344, doi:10.1021/ez5002209, 2014.
Karhu, K., Mattila, T., Bergstroem, I., and Regina, K.: Biochar addition to agricultural soil increased CH4 uptake and water holding capacity – Results from a short-term pi-lot field study, Agr. Ecosyst. Environ., 140, 309–313, doi:10.1016/j.agee.2010.12.005, 2011.
Klüpfel, L., Keiluweit, M., Kleber, M., and Sander, M.: Redox Properties of Plant Biomass-Derived Black Carbon (Biochar), Environ. Sci. Technol., 48, 5601–5611, doi:10.1021/es500906d, 2014.
Lal, R., Delgado, J. A., Groffman, P. M., Millar, N., Dell, C., and Rotz, A.: Management to mitigate and adapt to climate change, J. Soil Water Conserv., 66, 276–285, doi:10.2489/jswc.66.4.276, 2011.
Lehmann, J.: Bio-energy in the black, Front. Ecol. Environ., 5, 381– 387, 2007.
Lehmann, J. and Joseph, S.: Biochar for Environmental Man-agement: Science, Technology and Implementation, Routledge, 2015.
Leiber-Sauheitl, K., Fuß, R., Voigt, C., and Freibauer, A.: High CO2 fluxes from grassland on histic Gleysol along soil car-bon and drainage gradients, Biogeosciences, 11, 749–761, doi:10.5194/bg-11-749-2014, 2014.
Liu, J., Shen, J., Li, Y., Su, Y., Ge, T., Jones, D. L., and Wu, J.: Effects of biochar amendment on the net greenhouse gas emission and greenhouse gas intensity in a Chinese dou-ble rice cropping system, Euro. J. Soil Biol., 65, 30–39, doi:10.1016/j.ejsobi.2014.09.001, 2014.
Liu, X., Zhang, A., Ji, C., Joseph, S., Bian, R., Li, L., Pan, G., and Paz-Ferreiro, J.: Biochar’s effect on crop productivity and the dependence on experimental condition’a meta-analysis of liter-ature data, Plant Soil, 373, 1–12, doi:10.1007/s11104-013-1806-x, 2013.
Liu, X.-Y., Qu, J., Li, L.-Q., Zhang, A.-F., Jufeng, Z., Zheng, J.-W., and Pan, G.-X.: Can biochar amendment be an ecological engineering technology to depress N2O emission in rice paddies? – A cross site field experiment from South China, Ecol. Eng., 42, 168–173, doi:10.1016/j.ecoleng.2012.01.016, 2012.
Meteoswiss: Climate normals Zurich/Affoltern, Tech. rep., Me-teoswiss, Zurich, available at: http://www.meteoschweiz. admin.ch/files/kd/climsheet/en/REH_norm8110.pdf (last access: 12 August 2014), 2013.
Meteoswiss: Climate report 2014, Tech. rep., Meteoswiss, Zurich, available at: http://www.meteoswiss.admin.ch/home/climate/ present-day/climate-reports.html (last access: 20 March 2015), 2015.
Mukherjee, A., Lal, R., and Zimmerman, A. R.: Effects of biochar and other amendments on the physical properties and greenhouse gas emissions of an artificially degraded soil, Sci. Total Environ., 487, 26–36, doi:10.1016/j.scitotenv.2014.03.141, 2014. Mulcahy, D. N., Mulcahy, D. L., and Dietz, D.: Biochar
soil amendment increases tomato seedling resistance to drought in sandy soils, J. Arid Environ., 88, 222–225, doi:10.1016/j.jaridenv.2012.07.012, 2013.
Neftel, A., Ammann, C., Fischer, C., Spirig, C., Conen, F., Emmenegger, L., Tuzson, B., and Wahlen, S.: N2O ex-change over managed grassland: Application of a quan-tum cascade laser spectrometer for micrometeorological flux measurements, Agr. Forest Meteorol., 150, 775–785, doi:10.1016/j.agrformet.2009.07.013, 2010.
Pedersen, A. R., Petersen, S. O., and Schelde, K.: A compre-hensive approach to soil-atmosphere trace-gas flux estimation with static chambers, European J. Soil Sci., 61, 888–902, doi:10.1111/j.1365-2389.2010.01291.x, 2010.
Ravishankara, A. R., Daniel, J. S., and Portmann, R. W.: Ni-trous Oxide (N2O): The Dominant Ozone-Depleting Sub-stance Emitted in the 21st Century, Science, 326, 123–125, doi:10.1126/science.1176985, 2009.
Sánchez-García, M., Roig, A., Sánchez-Monedero, M. A., and Cayuela, M. L.: Biochar increases soil N2O emissions
pro-duced by nitrification-mediated pathways, Soil Process., 2, 25, doi:10.3389/fenvs.2014.00025, 2014.
Scheer, C., Grace, P., Rowlings, D., Kimber, S., and Van Zwi-eten, L.: Effect of biochar amendment on the soil-atmosphere exchange of greenhouse gases from an intensive subtropical pas-ture in northern New South Wales, Australia, Plant Soil, 345, 47–58, doi:10.1007/s11104-011-0759-1, 2011.
Schimmelpfennig, S., Müller, C., Grünhage, L., Koch, C., and Kam-mann, C.: Biochar, hydrochar and uncarbonized feedstock ap-plication to permanent grassland – Effects on greenhouse gas emissions and plant growth, Agr. Ecosyst. Environ., 191, 39–52, doi:10.1016/j.agee.2014.03.027, 2014.
Shen, J., Tang, H., Liu, J., Wang, C., Li, Y., Ge, T., Jones, D. L., and Wu, J.: Contrasting effects of straw and straw-derived biochar amendments on greenhouse gas emissions within dou-ble rice cropping systems, Agr. Ecosyst. Environ., 188, 264–274, doi:10.1016/j.agee.2014.03.002, 2014.
Simek, M. and Cooper, J. E.: The influence of soil pH on deni-trification: progress towards the understanding of this interac-tion over the last 50 years, Euro. J. Soil Sci., 53, 345–354, doi:10.1046/j.1365-2389.2002.00461.x, 2002.
Singh, B., Hatton, B., Singh, B., Cowie, A., and Kathuria, A.: Influ-ence of biochars on nitrous oxide emission and nitrogen leaching from two contrasting soils, J. Environ. Quality, 39, 1224–1235, 2010.
Steiner, C., Glaser, B., Geraldes Teixeira, W., Lehmann, J., Blum, W. E., and Zech, W.: Nitrogen retention and plant uptake on a highly weathered central Amazonian Ferralsol amended with compost and charcoal, J. Plant Nutr. Soil Sci., 171, 893–899, doi:10.1002/jpln.200625199, 2008.
Stevens, R., Laughlin, R., and Malone, J.: Soil pH affects the processes reducing nitrate to nitrous oxide and di-nitrogen, Soil Biol. Biochem., 30, 1119–1126, doi:10.1016/S0038-0717(97)00227-7, 1998.
Suddick, E. C. and Six, J.: An estimation of annual nitrous ox-ide emissions and soil quality following the amendment of high temperature walnut shell biochar and compost to a small scale vegetable crop rotation, Sci. Total Environ., 65, 298–307, doi:10.1016/j.scitotenv.2013.01.094, 2013.
Taghizadeh-Toosi, A., Clough, T. J., Condron, L. M., Sherlock, R. R., Anderson, C. R., and Craigie, R. A.: Biochar Incorpora-tion into Pasture Soil Suppresses in situ Nitrous Oxide Emissions from Ruminant Urine Patches, J. Environ. Quality, 40, 468–476, doi:10.2134/jeq2010.0419, 2011.
Van Groenigen, J. W., Velthof, G. L., Oenema, O., Van Groenigen, K. J., and Van Kessel, C.: Towards an agronomic assessment of N2O emissions: a case study for arable crops, Eur. J. Soil Sci. 61, 903–913, doi:10.1111/j.1365-2389.2009.01217.x, 2010. Vanek, S. J. and Lehmann, J.: Phosphorus availability to beans via
interactions between mycorrhizas and biochar, Plant Soil, 395, 1–19, 105–123, doi:10.1007/s11104-014-2246-y, 2014. van Zwieten, L., Kimber, S., Morris, S., Downie, A., Berger,
E., Rust, J., and Scheer, C.: Influence of biochars on flux of N2O and CO2 from Ferrosol, Aust. J. Soil Res., 48, 555–568, doi:10.1071/SR10004, 2010.
Van Zwieten, L., Singh, B. P., Kimber, S. W. L., Murphy, D. V., Macdonald, L. M., Rust, J., and Morris, S.: An incubation study investigating the mechanisms that impact N2O flux from soil
fol-lowing biochar application, Agr. Ecosyst. Environ., 191, 53–62, doi:10.1016/j.agee.2014.02.030, 2014.
Van Zwieten, L., Kammann, C., Cayuela, M. L., Singh, B. P., Joseph, S., Kimber, S., Donne, S., Clough, T., and Spokas, K. A.: Biochar effects on nitrous oxide and methane emissions from soil, in: Biochar for environmental management: science, tech-nology and implementation, Routledge, New York, 2015. Verhoeven, E. and Six, J.: Biochar does not mitigate field-scale
N2O emissions in a Northern California vineyard: An
assess-ment across two years, Agr. Ecosyst. Environ., 191, 27–38, doi:10.1016/j.agee.2014.03.008, 2014.
Woolf, D., Amonette, J. E., Street-Perrott, F. A., Lehmann, J., and Joseph, S.: Sustainable biochar to mitigate global climate change, Nat. Commun., 1, 56, doi:10.1038/ncomms1053, 2010. Yanai, Y., Toyota, K., and Okazasi, M.: Effects of charcoal addition
on N2O emissions from soil resulting from rewetting air-dried
soil in short-term laboratory experiments, Soil Sci. Plant Nutr., 53, 181–188, doi:10.1111/j.1747-0765.2007.00123.x, 2007. Zhang, A., Cui, L., Pan, G., Li, L., Hussain, Q., Zhang, X., Zheng,
J., and Crowley, D.: Effect of biochar amendment on yield and methane and nitrous oxide emissions from a rice paddy from Tai Lake plain, China, Agr. Ecosyst. Environ., 139, 469–475, doi:10.1016/j.agee.2010.09.003, 2010.
Zheng, J., Stewart, C. E., and Cotrufo, M. F.: Biochar and Nitrogen Fertilizer Alters Soil Nitrogen Dynamics and Greenhouse Gas Fluxes from Two Temperate Soils, J. Environ. Qual., 41, 1361, doi:10.2134/jeq2012.0019, 2012.