Clustering of Preprocessed Web Usage
Data Using ART1 Neural Network and
Comparative Analysis of ART1, K-means
and SOM Clustering Techniques
Yogish H K #1 Dr. G T Raju*2 #
Department of Computer Science and Engineering Bharathiar University Coimbatore, 641046, Tamilnadu, India
1
*2
Department of Computer Science and Engineering RNS Institute of Technology, Bangalore -560061, Karnataka, India
2
Abstract: Web Usage Data is related to web activity. The majority of the techniques that have been used for pattern discovery from Web Usage Data are clustering methods. In e-commerce applications, clustering methods can be used for the purpose of generating marketing strategies, product offerings, personalization and Web site adaptation and also used for preload webpages which are likely to be accessed in near future. A novel Partitional based approach for dynamically grouping Web users based on their Web access patterns using ART1 NN clustering algorithm is presented in this paper.
Keywords —Preprocessing, Clustering , WUM, ART1 NN
I. INTRODUCTION
The exponential growth of the Web in terms of Web sites and their users during the past decade has generated huge amount of data related to the user’s interactions with the Web sites. This data is recorded in the Web access log files of Web servers and usually referred as Web Usage Data (WUD). Web Usage Mining[11](WUM) is the area of Web mining which deals with the application of data mining techniques to extract interesting knowledge from the WUD. As Web sites continue to grow in size and complexity, the results of WUM have become very critical for efficient and effective management of the activities related to e-business, e-education, e-commerce, personalization, Web site design and management, network traffic analysis, and to predict user’s actions. Nevertheless, understanding the needs of their users is vital for the owners of the Web sites in order to serve them better.
The degree of personalization that a Web site offers in presenting its services to users is an important attribute contributing to the site’s popularity. Restructuring the Web site to individual user interests increases the computation at the server to an impractical degree. One way to solve this problem is to group users on the basis of their Web interests and then organize the site’s structure according to the needs of different groups.
Majority of the techniques that have been used for pattern discovery from Web usage data are clustering methods. In e-commerce applications, clustering methods can be used for the purpose of generating marketing strategies, product offerings, personalization and Web site adaptation. A clustering algorithm takes as input a set of input vectors and gives as output a set of clusters thus mapping of each input vector to a cluster. Clusters can be labeled to indicate a particular semantic meaning pertaining to all input vectors mapped to that cluster. Clusters are usually internally represented using prototype vectors that are vectors indicating a certain similarity between the input vectors which are mapped to a cluster. ART1 NN offers an unsupervised clustering approach that adapts to changes in users’ access patterns over time without losing earlier information.
II. PROBLEM FORMULATION
Clustering pertains to unsupervised learning, where the data with class labels are not available. It basically involves enumerating C partitions, optimizing some criterion, over t-iterations, so as to minimize the inter-cluster distance (dissimilarity) or maximize the intra-inter-cluster resemblance (similarity). Let H = {h1, h2…hn} is the
set of all the hosts/users accessing that site. Define a log entry as li =< hi, t, s, refi >, where hi∈ H; t represents
the access time, and s represents the request status, refi represents the referring page and is optional. Let D be the
URLn}, called as base vector. Define a pattern vector for each host hias PH = {P1, P2…Pm}. This is formed by
mapping the access frequency of each URLi in D, to a binary value (0 or 1).
“Given the input binary pattern vector PH which is derived from the entries in the base vector D, the
problem is to group n patterns into C clusters such that the entries within clusters are more similar than across clusters”.
III. THE CLUSTERING MODEL
Fig.1 shows the block diagram of the proposed clustering model. It involves two stages – Feature Extraction stage and the Clustering Stage. First, the features from the preprocessed log data are extracted and a binary pattern vector P is generated. Then, ART1 NN clustering algorithm for creating the clusters in the form of prototype vectors is used.
Fig. 1 Block diagram of proposed clustering model
A. Feature Extraction
The preprocessed Web server log data is filtered to capture access patterns for the hosts whose request constituted most of Web log activities. The remaining hosts are removed because they did not generate enough requests to constitute a group. The entries in the log file are sorted based on the hosts in ascending order of the access time. Then, for each host, the interesting entries are considered based on the access frequency of the URLs. Each host represents a large community of organizationally related users. For example, all requests with the host name burch.berkly.edu represent the requests from students and faculty of Berkley University. For each host H, the feature extractor forms an input binary pattern vector P that is derived from the base vector D. The procedure given in Fig.2 generates the pattern vector which is the input vector for ART1 NN based clustering algorithm.
B. ART1 Neural Network Clustering
ART1 NN clustering can be viewed as a neural implementation of Leader clustering [3,9,12], where the algorithm chooses a leader as a representative (center) of the cluster, such that it is also its member. The algorithm depends on the threshold value to determine whether an object is similar enough to the leader in order to lie in the same partition. If the threshold is large, then more objects are grouped into less number of clusters, and vice versa. The algorithm involves a single database scan, and it is required to store only the leaders (prototype vectors). It is incremental and robust to outliers, but is dependent on the order of pattern presentation. This algorithm found to be suitable for use in large data.
ART1 clustering algorithm is an unsupervised learning algorithm. It is unsupervised in the sense that it establishes the clusters without external interference. It has an advantage that it adapts to changes in user’s Web access patterns over time without losing information about their previous Web access patterns. A prototype
vector represents each cluster by generalizing the URLs most frequently accessed by all cluster members.
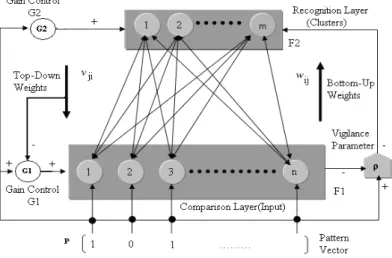
Architecture of the ART1 NN based clustering technique for clustering hosts/Web users is as shown in Fig. 3. It consists of two subsystems:
Procedure Gen_Pattern ( )
Begin
for each pattern vector PH, where H = 1 to n
for each element pi in pattern vector PH, i=1 to m
if URL i requested by the host more than twice
then pi = 1;
else pi = 0; End
Attentional Subsystem: Consists of a comparison network layer F1, a recognition layer F2, and Gain controls G1 & G2. F1 and F2 are fully connected with top-down weights vji and bottom-up weights wij
respectively.
Orientation Subsystem: Consists of the vigilance parameter, ρ which determines the mismatch allowed between the input pattern vectors and the weights connecting F1 and F2.
In the Fig. 3, pattern vector P, represents the access patterns of the host H, and is the input to the comparison layer F1. The vigilance parameter ρ determines the degree of mismatch to be tolerated (threshold or error tolerance). Nodes in Layer F2 represent the Clusters formed. Top-down weights represent the prototype vector after the network is stabilized. The input pattern vector P is presented at the F1 Layer. Gain control G1 is set to 0 to indicate that all nodes in F2 layer are actively competing. Each input vector activates a winner node in the layer F2 that has highest value among the product of input vector and the bottom-up weight vector. The F2 layer then reads out the top-down expectation of the winning node to F1, where the expectation is normalized over the input pattern vector and compared with the vigilance parameter ρ. If the winner and input vector match within the tolerance allowed by the ρ, the ART1 algorithm sets the control gain G2 to 0 and updates the top-down weights corresponding to the winner. If a mismatch occurs, the gain controls G1 & G2 are set to 1 to disable the current node and process the input on another uncommitted node. Once the network is stabilized, the top-down weights corresponding to each node in F2 layer represent the prototype vector for that node.
Fig. 3 Architecture of ART1 NN based Clustering
Table 1. List of various symbols used in the Fig. 3
Short Term Memory (STM) dynamics of F1 and F2 nodes are governed by standard shunting equations of the form [147]:
n , … 1, = i ) (
) 1
( − 1 + − 1 + 1 −
+ −
= i i i i i
i x A x J B C x J
x
ε
and
m , … 1, = j ) (
) 1
( 2 2 2
− +
+ − −
+ −
= j j j j j
j y A y J B C y J
y
ε
Where xi and yjare the neuronal activations of F1 and F2 neurons respectively. A1, B1,C1, A2, B2,C2 are the coefficients and ε, small number which is greater
than zero depicts the fast settling nature of STMs.
+
i
J and J+j
are the net excitatory inputs to nodes i and j of
F1 and F2.
−
i
J
and
−
j
J
are the net inhibitory inputs to nodes i and j of F1 and F2.
For the bottom-up connections,
)) ( )(
(
1 j j ij ij i i
ij K S y E w S x
w = − +
and for the top-down connections,
)) ( )(
(
2 j j ji ji i i
ji K S y E w S x
v = − +
Notice that both equations have a decay term with a target signalSi(xi), gated by an F2 signalSj(yj). Clearly,
if Sj(yj)=0, wij=vji=0 which means that no learning can take place in the instars or outstars of inactive F2 neurons. More on ART1 neural network architecture is provided in [147].
Summary of the steps involved in ART1 clustering algorithm is as follows:
Steps:
1. Initialize the vigilance parameter ρ , 0 ≤ ρ ≤ 1, w = 2/ (1+n), v=1 where w is m × n matrix (bottom-up weights) and v is the n × m matrix(top-down weights), for n-tuple input vector and m
clusters.
2. Binary unipolar input vector p is presented at input nodes. pi={0,1} for i=1,2,..,n
3. Compute matching scores
==
n i i ikk
w
p
y
1 0for k=1,2,…m
Select the best matching existing cluster j with
y
j Max(yk),k 1,2,..,m0 0
= =
4. Perform similarity test for the winning neuron
ρ
>
= 1 1p
p
v
n i i ijWhereρ, the vigilance parameter and the norm
p
1is the L1 norm defined as, 1
p
=
= n i i p1 , if the test
(4.6) is passed, the algorithm goes to step 5. If the test fails, then the algorithm goes to step 6, only if the top layer has more than a single active node left otherwise, the algorithm goes to step 5.
5. Update the weight matrices for index j passing the test (1). The updates are only for entries(i,j) where i=1,2,..,m and are computed as follows
= + n j i ij i ij p t v p t v 1 ) ( 5 . 0 ) ( andvij(t+1) = i
p
vij(t)
This updates the weights of jth cluster (newly created or the existing one). Algorithm returns to step 2. 6. The node j is deactivated by setting yjto 0. Thus this node does not participate in the current cluster
search. The algorithm goes back to step 3 and it will attempt to establish a new cluster different than j
for the pattern under test.
In short, ART1 NN learning performs off-line search through the encoded cluster exemplars and is trying to find close match. If no match is found, a new category is created
IV. EXPERIMENTAL RESULTS
Experiments have been conducted on Web log files of NASA Web site and results shows that the proposed ART1 algorithm learns relatively stable quality clusters compared to K-Means and SOM clustering algorithms. Here, the quality measures considered are functions of average Inter-Cluster and the Intra-Cluster distances. Also used are the internal evaluation functions such as Cluster Compactness (Cmp), Cluster Separation (Sep) and the combined measure of Overall Cluster Quality (Ocq) to evaluate the Intra-Cluster homogeneity and the
Inter-Cluster separation of the clustering results. The complete coding of ART1 neural network clustering algorithm has been implemented in Java. Experimental simulations are also performed using MATLab. Both K-Means and SOM clustering algorithms clusters N data points into k disjoint subsets Sj. The geometric centroid of the data points represents the prototype vector for each subset. SOM is a close cousin of K-Means that embeds the clusters in a low dimensional space right from the beginning and proceeds in a way that places related clusters close together in that space.
C. Performance of ART1 Clustering Algorithm
The performance of ART1 clustering algorithm for clustering the Web requests made by varying number of hosts is provided in the Fig. 4. The value of the vigilance parameter ρ whichcontrols the number of clusters to be formed is varied between 0.3 and 0.5 (for quality clusters). The following observations are made from the experimental results as shown in the Fig. 4.
1. Increasing the value of the vigilance parameter ‘ρ’ increases the number of clusters learnt by the ART1 NN. This will also decrease the size of each cluster. Size is defined as the number of pattern vectors in that cluster. This is called “self-scaling property”.
2. Different orders of presentation of pattern vectors during learning results in different clusters. This property is true for any unsupervised clustering algorithm that is based on one-by-one presentation of the inputs.
3. Lower value of ρ (low degree of similarity) causes more number of hosts to be in one cluster resulting in lesser number of clusters. Higher value of ρ (high degree of similarity) causes smaller number of hosts to be in one cluster causing more number of clusters.
(a) #Hosts: 1000
(c) #Hosts: 500
Fig. 4 Variations in Number of Clusters v/s Vigilance Parameter
D. Average Inter-Cluster Distance
The performance of the ART1 clustering algorithm is compared with that of the K-Means and SOM clustering algorithms for the purpose of evaluation of performance. For comparison, same numbers of clusters are selected corresponding to each ρ in the ART1 results. Fig. 5 shows the variations in the average inter-cluster distances for the three algorithms. It is observed that, average inter-cluster distance of ART1 is high compared to K-Means and SOM when there are fewer clusters, and as the number of clusters increases, average inter-cluster distance of ART1 is low compared to Means and SOM. Also, the average inter-cluster distances of ART1, K-Means and SOM algorithms vary almost linearly with the increase in number of clusters. Thus ART1 algorithm shows better performance for ρ > 0.4.
Fig. 5 Variations in Average Inter-Cluster Distances
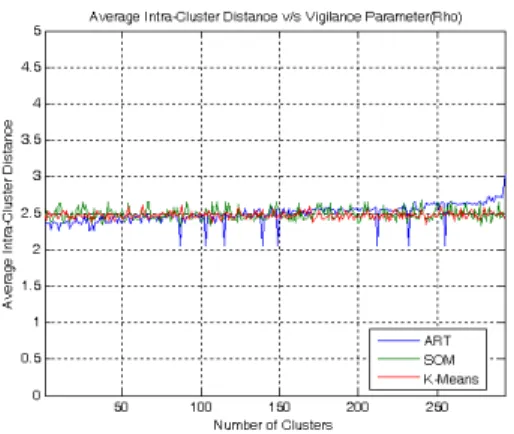
E. Average Intra-Cluster Distance
Fig. 6 Variations in Average Intra-Cluster Distances
F. Cluster Compactness
To evaluate the quality of clustering results, internal quality measures such as Cluster Compactness (Cmp) and Cluster Separation (Sep) are used which are always the quantitative evaluation measures that do not rely on any external knowledge. Cluster Compactness is used to evaluate the intra-cluster homogeneity of the clustering result and is defined as:
= = C i i X v c v C Cmp
1 ( )
) ( 1
Where C is the number of clusters generated on the data set X, v(ci) is the deviation of the cluster ci, and v(X) is the deviation of the data set X given by: ( ) 1 ( , )
1 2 x x d N X v N i i
= =Where d(xi, xj) is the Euclidean distance(L2 norm), is a measure between two vectors xi and xj, N is the number of members in X, and
x
is the mean of X.The smaller the Cmp value, the higher the average compactness in the output clusters. It is observed from the Fig. 7 that Cmp value of ART1 clustering algorithm is small showing higher average compactness compared to SOM and K-Means algorithms. Also, Cmp value of ART1 varies steadily with the increase in number of clusters, where as the Cmp value of SOM and K-Means algorithms are quite constant irrespective of the number of clusters.
Fig. 7 Variations in Cluster Compactness
G. Cluster Separation
Cluster Separation is used to evaluate the intra-cluster separation of the clustering result and is defined as:
= = ≠ − − = C i j c i c C i j j C C x x d Sep 1 2 2 , 1 ) 1 ( 1 2 ) , ( expσ
Where C is the number of clusters generated on the data set X, σ is the standard deviation of the data set X, and d (xci, xcj) is the Euclidean distance, is a measure between centroid of xci and xcj. Similar to Cmp, the
SOM and K-Means algorithms. Also, Sep value of ART1, SOM and K-Means algorithms decreases with the increase in number of clusters.
Fig. 8 Variations in Cluster Separation
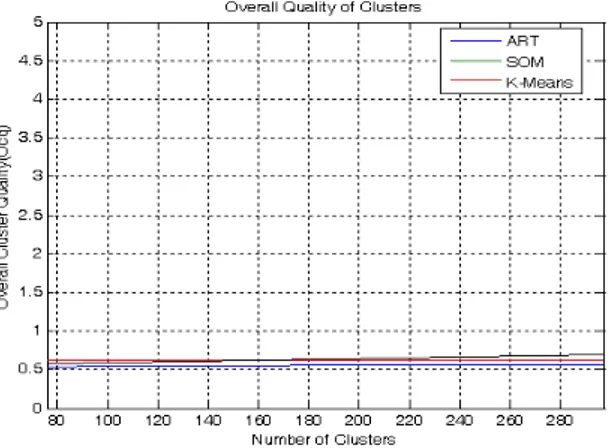
H. Overall Cluster Quality
The Overall cluster quality (Ocq) is used to evaluate both intra-cluster homogeneity and inter-cluster separation of the results of clustering algorithms. Ocq is defined as:
Sep Cmp
Ocq(β)= β ∗ + (1− β)∗
Where β∈ [0, 1] is the weight that balances the measures Cmp and Sep. Aβvalue of 0.5 is often used to give equal weights to the two measures for overcoming the deficiency of each measure and assess the overall performance of a clustering system. Therefore, the lower the Ocq value, the better the quality of resulting clusters. It is observed from Fig. 9 that, the Ocq value of our ART1 clustering algorithm is lower compared to SOM and K-Means indicating the clusters formed by our ART1 NN are with better quality. In ART1, the quality decreases slowly as the number of clusters increases (i.e., beyond the ρ value 0.45) which is quite obvious.
I. Efficiency Analysis
For the efficiency analysis, the time complexity of all the three algorithms are compared with the same number of hosts to be clustered (input) and with same number of clusters (k value in case of SOM and K-Means, ρ value in case of ART1).
Fig. 9 Variations in Overall Cluster Quality
For a ρ value of 0.5, the response time is measured for the three algorithms on different number of hosts (100,250,500, and 1000) as presented in the Fig. 10. It is observed from the Fig. 10 that, for large data set, ART1 takes less time compared to K-Means and SOM, proving ART1 is efficient than SOM and K-Means. The time complexity of ART1 is almost linear logtimeO (n*log2n), whereas the time complexity of K-Means is
Fig. 10 Time Complexity of Clustering Algorithms
V. RELATED WORK
Clustering the users’ navigation patterns is not enough, due to the differences, limitations and diversion of Web-based applications such as e-commerce, to adapt Web sites and to recommend new products to customers Web-based on their navigational behavior or Web based information retrieval, to improve real-time and dynamic data accessing. Understanding how users navigate over Web sources is essential both for computing practitioners (e.g. Web sites developers) and researchers (Berendt and Spiliopoulou, 2000). In this context, Web usage data clustering has been widely used for increasing Web information accessibility, understanding users’ navigation behavior, improving information retrieval and content delivery on the Web.
VI. CONCLUSION
A novel approach for clustering Web users/hosts using ART1 neural network based clustering algorithm has been presented. The performance of ART1-clustering algorithm is compared with the K-means and SOM clustering algorithms. The quality of clusters measured in terms of average intra-cluster distance, average inter-cluster distance, cluster compactness, cluster separation and the overall cluster quality. Overall, the proposed ART1 NN based clustering algorithm performed better in terms of all these measures
REFERENCES
[1] Cadez, I., Heckerman, D., Meek, C., Smyth, P., & White, S. Model-based clustering and visualization of navigation patterns on a Web site. Journal of Data Mining and Knowledge Discovery, 7(4), 2003, pp 399–424.
[2] Chakrabarti, S. Mining the Web. San Francisco: Morgan Kaufman, 2003.
[3] Chen, K., & Liu, L. Validating and Refining Clusters via Visual Rendering. In Proc. of the 3rd International Conference on Data Mining (ICDM 2003), Melbourne, Florida: IEEE, 2003. Pp 501–504.
[4] Pallis, G., Angelis, L., & Vakali, A. Model-based cluster analysis for Web users sessions. In Proc. of the 15th international symposium on methodologies for intelligent systems (ISMIS 2005),Springer-Verlag, Saratoga (NY) USA, 2005, pp 219–227.
[5] Cadez. I,Heckerman,D.,Meek,C.,Smyth,P. and White,S, Visualization of Navigation Patterns on a Web Site Using Model Based Clustering. Technical Report MSR-TR-00-18, Microsoft Research, 2000.
[6] Dempster, A. P., Laird, N. M., & Rubin, D. B. Maximum likelihood from incomplete data via the EM algorithm. Journal of the Royal Statistical Society, 39, 1977, pp 1–22.
[7] Anderson,C. R.,Domingos,P. and Weld,D. S., AdaptiveWeb Navigation for Wireless Devices, In Proc. of the 17th International Joint Conference on Artificial Intelligence (IJCAI-01), 2001, pp 879-884.
[8] R. Krishnapuram, A. Joshi, O. Nasraoui, L. Yi, Low complexity fuzzy relational clustering algorithms for Web mining, IEEE Transactions on Fuzzy Systems 9 (4) 2001, pp 595-608.
[9] Pal, N.R., Bezdek, J.C.,. On cluster validity for the fuzzy c-means model. IEEE Transactions on Fuzzy Systems 3, 1995, pp 370-379. [10] Nasraoui,O.,Krishnapuram,R. and Joshi, A,Relational clustering based on a new robust estimator with applications to Web mining, In
Proc. of the International Conf. North American Fuzzy Info. Proc. Society(NAFIPS 99), New York, 1999, pp 705-709.
[11] Fu,Y., Sandhu, K. and Shih, M. Y, Clustering of Web Users Based on Access Patterns, In Proc. of the 5th ACM SIGKDD International Conference on Knowledge Discovery & Data Mining, Springer: San Diego, 1999
[12] Zhang,T.,Ramakrishnan, R. and Livny, M, BIRCH, an efficient data clustering method for very large databases, In Proc. ACM-SIGMOD International Conference in Management of Data, Montreal, Canada, 1996, pp 103-114
[13] Halkidi,M., Batistakis,Y. and Vazirgiannis,M, On Clustering Validation Techniques, Journal of Intelligent Information Systems, 17(2-3), 2001, pp 107-145.
[14] Paliouras,G., Papatheodorou, C., Karkaletsis, V. and Spyropoulos, C. D, Clustering the Users of Large Web Sites into Communities, In Proc. of International Conference on Machine Learning (ICML),Stanford, California, 2000, pp 719-726