BGD
11, 12295–12321, 2014
Characterization of incubation experiments and
development
S. Huang and P. R. Jaffé
Title Page
Abstract Introduction
Conclusions References
Tables Figures
◭ ◮
◭ ◮
Back Close
Full Screen / Esc
Printer-friendly Version
Interactive Discussion
Discussion
P
a
per
|
Discus
sion
P
a
per
|
Discussion
P
a
per
|
Discussion
P
a
per
|
Biogeosciences Discuss., 11, 12295–12321, 2014 www.biogeosciences-discuss.net/11/12295/2014/ doi:10.5194/bgd-11-12295-2014
© Author(s) 2014. CC Attribution 3.0 License.
This discussion paper is/has been under review for the journal Biogeosciences (BG). Please refer to the corresponding final paper in BG if available.
Characterization of incubation
experiments and development of an
enrichment culture capable of ammonium
oxidation under iron reducing conditions
S. Huang and P. R. Jaffé
Department of Civil and Environmental Engineering, Princeton University, Princeton, NJ 08544, USA
Received: 14 July 2014 – Accepted: 21 July 2014 – Published: 14 August 2014
Correspondence to: P. R. Jaffé ([email protected])
BGD
11, 12295–12321, 2014
Characterization of incubation experiments and
development
S. Huang and P. R. Jaffé
Title Page
Abstract Introduction
Conclusions References
Tables Figures
◭ ◮
◭ ◮
Back Close
Full Screen / Esc
Printer-friendly Version
Interactive Discussion
Discussion
P
a
per
|
Discus
sion
P
a
per
|
Discussion
P
a
per
|
Discussion
P
a
per
|
Abstract
Incubation experiments were conducted using soil samples from a forested riparian wetland where we have previously observed anaerobic ammonium oxidation cou-pled to iron reduction. Production of both nitrite and ferrous iron were measured re-peatedly during incubations when the soil slurry was supplied with either ferrihydrite
5
or goethite and ammonium chloride. Significant changes in the microbial community were observed after 180 days of incubation as well as in a continuous flow mem-brane reactor, using 16S rRNA gene PCR-denaturing gradient gel electrophoresis, 454-pyrosequencing, and real-time quantitative PCR analysis. We believe that one of the dominant microbial species in our system (an unculturedAcidimicrobiaceae
bac-10
terium A6), belonging to theAcidimicrobiaceae family, whose closest cultivated rela-tive isFerrimicrobium acidiphilum(with 92 % identity) andAcidimicrobium ferrooxidans
(with 90 % identity), might play a key role in this anaerobic biological process that uses ferric iron as an electron acceptor while oxidizing ammonium to nitrite. After ammonium was oxidized to nitrite, nitrogen loss proceeded via denitrification and/or anammox.
15
1 Introduction
The conventional removal of nitrogen from soil environments is mineralization (for or-ganic nitrogen), followed by nitrification and then denitrification (Canfield et al., 2010). Saturated anoxic soils are not considered suitable for either aerobic or anaerobic am-monium (NH+4) oxidation because they lack dissolved oxygen or nitrite (NO−2) to serve
20
as electron acceptors by aerobic or anaerobic (anammox) NH+4 oxidizing bacteria, re-spectively. A novel anaerobic NH+4 oxidation process coupled to iron reduction was first noted in a forested riparian wetland in New Jersey (Clement et al., 2005). In this re-action, NH+4 is the electron donor, which is oxidized to NO−2, and ferric iron [Fe(III)] is the electron acceptor, which is reduced to ferrous iron [Fe(II)]. The stoichiometry and
BGD
11, 12295–12321, 2014
Characterization of incubation experiments and
development
S. Huang and P. R. Jaffé
Title Page
Abstract Introduction
Conclusions References
Tables Figures
◭ ◮
◭ ◮
Back Close
Full Screen / Esc
Printer-friendly Version
Interactive Discussion
Discussion
P
a
per
|
Discus
sion
P
a
per
|
Discussion
P
a
per
|
Discussion
P
a
per
|
change in free energy when ferrihydrite is the Fe(III) source is:
3Fe2O3·0.5H2O+10H++NH+4 →6Fe2++8.5H2O+NO−2
(∆Gr≤ −145.08 kJ mol−1) (Eq. (1), Supplementary Information 1.1)
No proven pathway for the oxidation of NH+4 to NO−2 in anaerobic environments has
5
been described in the literature before this process was reported. Using labeled15NH+4 in a microcosm experiment, resulted in the production of 15N2, which conclusively showed that ammonium-N was converted to nitrogen gas (N2) in these sediments under iron reducing conditions (Shrestha et al., 2009). Either this same pathway for NH+4 oxidation, or a very similar one, was also observed in a biological reactor
10
(Sawayama, 2006) and a tropical rainforest soil (Yang et al., 2012), and coined Feam-mox (Sawayama, 2006). These pathways have been reported to oxidize NH+4 to NO−2 (Clement et al., 2005; Shrestha et al., 2009), to nitrate (NO−3) (Sawayama, 2006), or directly to N2(Yang et al., 2012), using Fe(III) as electron acceptor.
Our understanding of the Feammox process is still incomplete, particularly
informa-15
tion about the microorganism(s) responsible for it is lacking. This makes further study into the mechanism of the Feammox process difficult. Here we focus on a series of incubations and establishing a Feammox enrichment culture to identify the microbial community responsible for the process described previously (Clement et al., 2005; Shrestha et al., 2009). Soil samples were collected from the same location and used
20
for laboratory incubation experiments as well as to set up an enrichment system for Feammox in a continuous flow membrane reactor. Various incubation conditions [Fe(III) sources, inorganic carbon content, NH+4 concentration, and acetylene gas (C2H2) as a selected inhibitor] were used to study the Feammox mechanism. Molecular biology methods, such as denaturing gradient gel electrophoresis (DGGE), 454
pyrosequenc-25
BGD
11, 12295–12321, 2014
Characterization of incubation experiments and
development
S. Huang and P. R. Jaffé
Title Page
Abstract Introduction
Conclusions References
Tables Figures
◭ ◮
◭ ◮
Back Close
Full Screen / Esc
Printer-friendly Version
Interactive Discussion
Discussion
P
a
per
|
Discus
sion
P
a
per
|
Discussion
P
a
per
|
Discussion
P
a
per
|
2 Methods
2.1 Sample collection and processing
Soils for all the experiments described in this study were taken from a temperate forested riparian wetland at the Assunpink Wildlife Management Area, New Jersey. Ten soil cores were collected from 10 cm below the surface with polyethylene
col-5
umn containers (8 cm diameter and 30 cm long) and transported to the laboratory within 2 h. The soil pH was between 3.5 and 4.5, and no Manganese oxide was de-tected. The detailed physicochemical characteristic of these wetland soils have been described elsewhere (Clement et al., 2005). Prior to all incubation experiments, soil slurry from the field site was aerated for a month to degrade the labile organic
car-10
bon. After a 30 day aeration treatment, the dissolved organic carbon (DOC) content was stable at 2.06±0.20 mg g−1. Following the aeration treatment, the soil was divided into 400×10 g (air-dry equivalent) subsamples, and added into 50 mL serum vials, with 30 mL deionized water. The soil slurries were purged thoroughly with a CO2: N2 (80 : 20) mixture, resulting in a final pH of∼4 to 4.5. The vials were sealed tightly with
15
rubber stoppers and were stored in an anaerobic glove box for 30 days at ambient temperature to allow for stabilization before starting the incubations.
2.2 Batch incubation experiments
Soil samples were first incubated with different Fe(III) sources to determine which source could be used by the Feammox process: 6-line ferrihydrite (Fe2O3·0.5H2O)
20
or goethite [FeO(OH)] [prepared according to Cornell and Schwertmann, 2003]+NH+4 addition; ferric chloride+NH+4 addition; ferric citrate+NH+4 addition; either only ferri-hydrite or NH+4 addition; and autoclaved soil with ferrihydrite+NH+4 addition (n=30 per treatment). pH was adjusted to 4.5 in the ferrihydrite/goethite augmented samples, and to between 3.5∼4.0 in the ferric chloride/citrate augmented samples. Soil-slurry
25
BGD
11, 12295–12321, 2014
Characterization of incubation experiments and
development
S. Huang and P. R. Jaffé
Title Page
Abstract Introduction
Conclusions References
Tables Figures
◭ ◮
◭ ◮
Back Close
Full Screen / Esc
Printer-friendly Version
Interactive Discussion
Discussion
P
a
per
|
Discus
sion
P
a
per
|
Discussion
P
a
per
|
Discussion
P
a
per
|
and/or 2.00 mmol L−1 NH+4, were incubated in a series of 50 mL vials with an oxygen-free headspace, created by purging with a CO2: N2(80 : 20) mixture. Triplicate samples were collected destructively every two days to analyze iron and nitrogen species.
The second incubation was conducted to extend the anoxic incubation with ferri-hydrite to 180 days, with repeated NH4Cl additions after the NH+4 in solution was
ex-5
hausted. The initial concentration of Fe(III) was 25.0 mmol L−1and 1.00 mmol L−1NH+4 was added on days 4, 24, and 60, furthermore, 0.20 mmol L−1NaHCO3was added on day 50 and day 90 of the incubation. On day 125, incubation vials were divided into two sets to study the effect of different inorganic carbon contents on Feammox. Either 1.20 mmol L−1 or 0.20 mmol L−1 of NaHCO3 plus 2 mmol L−1 of NH4Cl were added to
10
each set. NaHCO3was then added every 10 days, which increased the soil pH to∼5 in the samples amended with 1.20 mmol L−1of NaHCO3. For this incubation, samples were collected every four days. Finally, soil samples collected on day 180 of the incu-bations were used to enrich the Feammox bacteria in a membrane reactor. To study how organic carbon content affects the Feammox bacteria, 1.00 mmol L−1 sodium
cit-15
rate was also supplied on day 125 to four of the 1.20 mmol L−1 NaHCO3 amended samples.
In the third experiment, inorganic nitrogen species were quantified through incuba-tions in the presence of C2H2. Soil slurries were first incubated for 90 days in eighty 50 mL vials, with an initial Fe(III) concentration of 25 mmol L−1. One mmol L−1 NH4Cl
20
and 0.20 mmol L−1NaHCO3 was added on days 24, 60, and 90. After this incubation, 5 mL of pure C2H2gas were added to 40 vials, which resulted in a finial C2H2 concen-tration of 100 µmol L−1. Samples with and without C2H2 were then incubated anaero-bically for 20 days. The headspace gas was sampled every 24 h for N2O analysis, and soil samples were analyzed every two days for Fe and N species.
BGD
11, 12295–12321, 2014
Characterization of incubation experiments and
development
S. Huang and P. R. Jaffé
Title Page
Abstract Introduction
Conclusions References
Tables Figures
◭ ◮
◭ ◮
Back Close
Full Screen / Esc
Printer-friendly Version
Interactive Discussion
Discussion
P
a
per
|
Discus
sion
P
a
per
|
Discussion
P
a
per
|
Discussion
P
a
per
|
2.3 Continuous flow membrane Feammox reactor
Soil samples collected on day 180 from the incubation with ferrihydrite, NH4Cl, and 1.2 mmol L−1NaHCO3additions were inoculated into a continuous flow membrane re-actor (Abbassi et al., 2014), which was operated under anaerobic conditions by con-stantly purging N2trough the reactor’s headspace at a room temperature (25◦C), and
5
with a 48 h hydraulic retention time.
The enrichment medium contained the following components per liter: 177 mg NH4Cl, 77.9 mg (NH4)2SO4, 19.8 mg NaHCO3, 71.0 mg KHCO3, 9.00 mg KH2PO4, 100 mg MgSO4·7H2O, and 60.0 mg CaCl2·2H2O. After autoclaving, 1 mL trace el-ement solution (Van de Graaf et al., 1996) was added to the medium. 50.0 mmol L−1
10
ferrihydrite were added once every two weeks directly into the reactor. To aid in main-taining anaerobic conditions, 0.10–0.20 mmol L−1 sodium citrate was feed to the re-actor about twice per month. pH was controlled at around 4∼5, and dissolve oxygen was<0.1 mg L−1. Samples form the outflow were collected every two days, and sludge samples from reactor were collected and kept at−20◦C for molecular biology analysis.
15
2.4 Chemical analyses
For each sample collection during the incubations, a set of vials was destructively sam-pled in a glove box under oxygen-free conditions and the pH was measured immedi-ately using a pH electrode. An extraction with 0.5N HCl was conducted for 24 h at room temperature to determine acid-extractable Fe(II) and NH+4 concentrations in the
20
soils. Fe(II) was analyzed using the ferrozine assay method (Stookey, 1970; Komlos et al., 2007), and NH+4 was analyzed using a Dionex™ Ion Chromatograph (LC3000) with a CS-16 Colum and a CS-16 guard column (flow rate=1.0 mL min−1, detection limit=0.012 ppm). NO−3 and NO−2 were extracted with DI water for 1 h anaerobically, and measured via Ion Chromatography, using an AS-22 Colum along with an AG-22
25
BGD
11, 12295–12321, 2014
Characterization of incubation experiments and
development
S. Huang and P. R. Jaffé
Title Page
Abstract Introduction
Conclusions References
Tables Figures
◭ ◮
◭ ◮
Back Close
Full Screen / Esc
Printer-friendly Version
Interactive Discussion
Discussion
P
a
per
|
Discus
sion
P
a
per
|
Discussion
P
a
per
|
Discussion
P
a
per
|
used. N2O concentrations were determined on a gas chromatograph Shimadzu 2014 equipped with an electron capture detector.
2.5 DNA and RNA isolation
DNA and RNA samples were extracted from soils collected at the wetland prior to any laboratory incubation, from the samples taken at different time points during the
5
incubation experiments and from the reactor. DNA was extracted from 500 mg soil or sludge samples using the FastDNA® spin kit for soil (MP Biomedicals, USA) as described by the manufacturer, and RNA using the FastRNA®pro Soil Direct Kit. The concentrations were measured using a Nano-drop 2000 spectrophotometer (Thermo Scientific, USA).
10
2.6 PCR-DGGE and 454 pyrosequencing analysis
Bacterial universal 16S rRNA gene primer sets V3-2/V3-3 (Jensen et al., 1998) were used for PCR amplification. DGGE was performed with an 8 % polyacrylamide gel con-taining a gradient from 40 % to 80 % denaturant using the gradient gel electrophoresis system (C.B.S. SCIENTIFIC, USA). The electrophoresis was carried out at 60 V for
15
15 h. After that the gel was stained with 0.1 µL mL−1 SYBR Green I and visualized with an UV transilluminator. All visible bands were excised from the gel and used as templates for re-amplification, using the primer set V3-1/V3-2 (Jensen et al., 1998) and followed by cloning. PCR products were purified via agarose gel extraction and cloned into a pGEM-T vector (Promega). A total of 10 to 30 positive recombinant
20
clones for each band were identified by colony PCR, and were sent for sequencing to avoid erroneous interpretations. DNA sequencing was then conducted by Genewiz, Inc. Bacteria were classified and the phylogenetic tree of Acidimicrobiaceae-related sequences was constructed using the Bayesian inference (Huelsenbeck et al., 2001) (Supplementary Information 1.2). Sequences obtained in this study are available in the
25
con-BGD
11, 12295–12321, 2014
Characterization of incubation experiments and
development
S. Huang and P. R. Jaffé
Title Page
Abstract Introduction
Conclusions References
Tables Figures
◭ ◮
◭ ◮
Back Close
Full Screen / Esc
Printer-friendly Version
Interactive Discussion
Discussion
P
a
per
|
Discus
sion
P
a
per
|
Discussion
P
a
per
|
Discussion
P
a
per
|
firm the changes in the bacterial community, 454 pyrosequencing was performed with samples collected from the incubation on days 0, 30, 90, 160 and from the membrane reactor after 150 days of reactor operation. Domain-specific primers, targeting the V3-V5 region of the 16S rDNA of bacteria were amplified following methods suggested by Pinto et al. (2012)
5
2.7 Quantitative PCR (qPCR) assay
qPCR experiments were carried using a StepOnePlus™ Real-Time PCR System (Life Technologies, USA), represented by 16S rRNA genes, using primer sets 1055f/1392r for total bacteria (Harms et al., 2003), Amx368f/Amx820r for anammox bacteria (Schmid et al., 2000, 2003), acd320f (5’-CGG TCC AGA CTC CTA CGG GA -3’) –
10
432r (5’-GAC AGG GTT TTA CAG TCC GAA GA -3’) which we developed for Aci-dobacteriaceae bacteria, and acm342f (5’-GCA ATG GGG GAA ACC CTG AC -3’) – 439r (5’-ACC GTC AAT TTC GTC CCT GC -3’) which we developed for Acidimi-crobiaceaebacteria (Supplementary Information 1.3). For the detection of denitrifiers and ammonia-oxidizing bacteria, denitrifying functional genes (nirS) and ammonia
15
monooxygenase structural gene (amoA) were quantified with primer sets NirS3/NirS5 (Braker et al., 1998) and amoA-1F/amoA-2R, respectively (Rotthauwe et al., 1997). For DNA quantification, each qPCR mixture (20 µL) was composed of 10 µL of SYBR Premix Ex Taq® II (Takara, Japan), 0.8 µL 10 µM of each primer, and ∼10 ng DNA template. RNA quantification was conducted through a real-time quantitative reverse
20
transcription-PCR (RT-qPCR) analysis, by using the One Step SYBR® PrimeScript® RT-PCR Kit (Takara, Japan) according to the manufacturer’s recommendations. Ther-mal cycling conditions for total 16S rDNA,nirS andamoAgene numbers was initiated for 30 s at 94◦C, followed by 40 cycles of 5 s at 94◦C, 30 s at 57◦C, and 30 s at 70◦C. 16S rDNA numbers of anammox, Acidobacteriaceaeand Acidimicrobiaceae bacteria
25
incuba-BGD
11, 12295–12321, 2014
Characterization of incubation experiments and
development
S. Huang and P. R. Jaffé
Title Page
Abstract Introduction
Conclusions References
Tables Figures
◭ ◮
◭ ◮
Back Close
Full Screen / Esc
Printer-friendly Version
Interactive Discussion
Discussion
P
a
per
|
Discus
sion
P
a
per
|
Discussion
P
a
per
|
Discussion
P
a
per
|
tion was conducted for 5 min at 42◦C to facilitate reverse transcriptase activity. Each assay contained a standard using a serial dilution of plasmids containing specific target genes, independent triplicate templates for each soil sample, and triplicate no template controls (NTC).
3 Results
5
3.1 Change in Fe and N species under different operational conditions
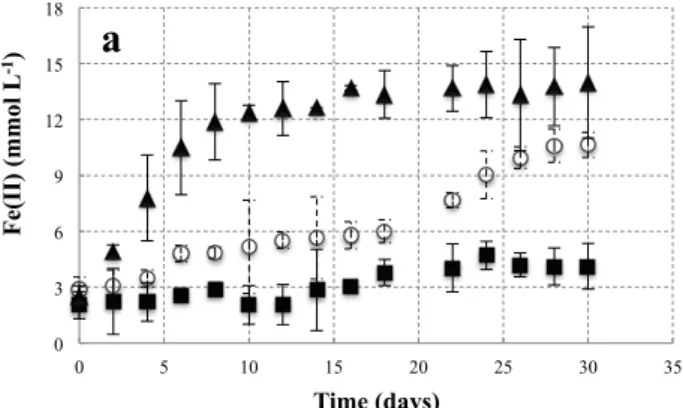
After incubating the pre-treated soil slurry with the four different Fe(III) sources for 30 days, only samples to which either ferrihydrite or goethite had been added showed measurable NH+4 oxidation (Figs. 1 and S1). In samples incubated with ferric citrate and NH4Cl, Fe(III) reduction was much faster than in those supplied with Fe(III) oxides, but
10
the NH+4 concentration remained fairly constant (Fig. 1). No detectable Fe(II) reduction or NH+4 oxidation was found the sterilized soils amended with ferrihydrite and NH4Cl, (Fig. S2). Faster iron reduction and NH+4 removal was observed in ferrihydrite than in goethite-amended sediments (Fig. S1).
Since samples incubated with ferrihydrite and NH4Cl resulted in the fastest NH+4
oxi-15
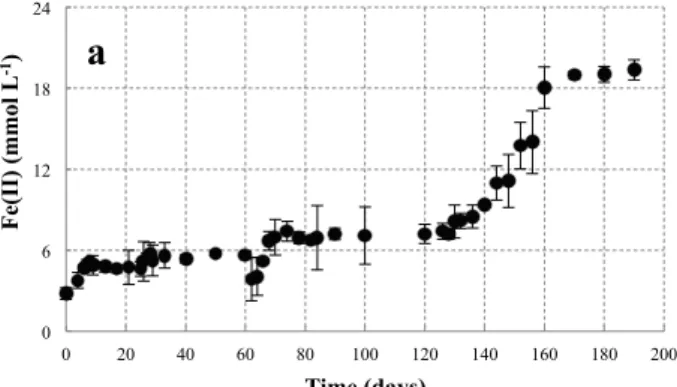
dation, the anaerobic incubation with ferrihydrite was extended to 180 days. Ferrihydrite as the Fe(III) source results in a larger negative∆Gvalue than goethite (Clement et al., 2005). The NH+4 oxidation rate increased as NH4Cl was supplied repeatedly, especially after 125 days of incubation when the NaHCO3 additions were increased from 0.20 to 1.20 mmol L−1 in addition to the 2.00 mmol L−1 NH+4 added. The increased NaHCO3
20
dosing also increased the generation of Fe(II) (Fig. 2a, b). NO−2 appeared within a few days after the addition of NH+4, with a maximum concentration 0.44±0.17 mmol L−1 in the second NH+4 oxidation cycle. NO−2 did not accumulate in the system and was imme-diately consumed after generation (Fig. S3a). NO−3 production showed a similar pattern to that of NO−2 (Fig. S3a), and TN loss similar to the decrease in NH+4 (Fig. S3b). During
BGD
11, 12295–12321, 2014
Characterization of incubation experiments and
development
S. Huang and P. R. Jaffé
Title Page
Abstract Introduction
Conclusions References
Tables Figures
◭ ◮
◭ ◮
Back Close
Full Screen / Esc
Printer-friendly Version
Interactive Discussion
Discussion
P
a
per
|
Discus
sion
P
a
per
|
Discussion
P
a
per
|
Discussion
P
a
per
|
180 days of incubation, the system experienced a loss of TN of 57.2±3.13 mg L−1. The DOC content fluctuated slightly in the early stage of incubation, but overall, the DOC concentration was relatively stable at around 45∼50 mg L−1(Fig. S3b).
A 64.5 % NH+4 removal, between inflow and outflow was achieved in the membrane reactor after 150 days of operation.
5
3.2 Phylogenetic analysis of the microbial community based on 16S rRNA gene
All visible bands observed in the DGGE analysis (significant bands were marked, see Fig. 3) were excised from the gel and sequenced after cloning. Clone libraries from 12 samples resulted in 721 sequences of partial 16S rRNA gene fragments, and six groups of bacteria were classified via a phylogenetic analysis (Tables 1 and S1).
Dur-10
ing this 180 day anaerobic incubation with ferrihydrite and NH4Cl, the microbial com-munities shifted dramatically and the microbial diversity decreased with time (Fig. 3, lane 1–4). Some DGGE bands disappeared gradually with time, such as band A5 and band A7. Band A5, represents a dissimilatory iron-reducing bacteria,Geobacter sp., which existed in this Fe(III)-rich wetland soil and reappeared for a short time during
15
the initial anaerobic incubation. Band A7, represents an ammonia-oxidizing bacterium,
Nitrosomonas sp., which showed a strong presence in the samples at 30 days of in-cubation and was attenuated after longer inin-cubation times. In contrast, DGGE bands A6, A8 and A9 became more significant as the incubation time increased, showing that there were three groups of bacteria dominating in the system after 160 days of
incu-20
bation. Band A6, represents a group of bacteria belonging to the Acidimicrobiaceae
family. Bacteria from theAcidobacteriaceaefamily are represented by band A8. Some species in this family have been described as iron reducers and obligate heterotrophs (Kishimoto et al., 1991; Rowe et al., 2007; Coupland and Johnson, 2008). DGGE band A9 represents bacteria of theRhodocyclaceaefamily. This family contains mainly
den-25
BGD
11, 12295–12321, 2014
Characterization of incubation experiments and
development
S. Huang and P. R. Jaffé
Title Page
Abstract Introduction
Conclusions References
Tables Figures
◭ ◮
◭ ◮
Back Close
Full Screen / Esc
Printer-friendly Version
Interactive Discussion
Discussion
P
a
per
|
Discus
sion
P
a
per
|
Discussion
P
a
per
|
Discussion
P
a
per
|
Microbial communities also differed between samples incubated with various Fe(III) sources, and between samples with or without the addition of inorganic carbon. Sam-ples supplied with either ferric chloride or ferric citrate as the Fe(III) source plus NH+4, and samples supplied with just ferrihydrite and no NH+4, had a decreased diversity in their bacterial communities (Fig. 3, lane 5–7). Samples supplied with both organic
car-5
bon (1.00 mmol L−1sodium citrate) and inorganic carbon (1.20 mmol L−1NaHCO3) had a higher bacterial diversity (DGGE Fig. 3, lane 8).
Changes in the microbial community after 180 days of incubation were also con-firmed via 454-pyrosequencing, and the obvious growth ofActinobacteria, Acidobac-teriaandβ-Proteobacteriagroups (which band A6, A8 and A9 belong to) was
consis-10
tent with the DGGE results, where theActinobacteriacell number increased the most (Fig. 4).Planctomycetes phylum, with which anammox bacteria are affiliated, was de-tected in the first 90 days of incubation, but disappeared or was below detection on day 160.Actinobacteriawere also the dominant species in the Feammox enrichment reac-tor based on the results of the 16S rDNA library obtained via pyrosequencing (Fig. 4).
15
The Acidimicrobiaceae bacterium, represented by band A6, which belongs to the
Actinobacteriaphylum, was the dominant species in the incubation experiments after 180 days of incubation (14.8 % in terms of cell numbers) as well as in the membrane reactor after 150 days of operation (40.2 % in terms of cell numbers). Its similarity to otherAcidimicrobiaceae-related sequences is shown using a phylogenetic tree (Fig. 5).
20
Unlike the bacteria represented by band A8 and A9, which were also found in samples that did not show Feammox transformations, this Acidimicrobiaceae bacterium was only detected in incubations (or reactor) that were augmented simultaneously with fer-rihydrite, NH4Cl, and NaHCO3and have shown Feammox activity (Fig. 3).
3.3 Changes of bacterial abundance and activity during incubations and in the
25
reactor
frag-BGD
11, 12295–12321, 2014
Characterization of incubation experiments and
development
S. Huang and P. R. Jaffé
Title Page
Abstract Introduction
Conclusions References
Tables Figures
◭ ◮
◭ ◮
Back Close
Full Screen / Esc
Printer-friendly Version
Interactive Discussion
Discussion
P
a
per
|
Discus
sion
P
a
per
|
Discussion
P
a
per
|
Discussion
P
a
per
|
ment copies of Acidimicrobiaceae bacteria (DGGE band A6), increased during the incubation, particularly after 90 days. The rRNA numbers increased slowly during the first 3 months and doubled between day 130 and day 140 of the incubation period (Fig. 6). rRNA as a biomarker for changes of protein level, even though not as specific as mRNA, is a good indicator for bacterial activity (Poulsen et al., 1993; Park et al.,
5
2010). The abundance of Acidobacteriaceae bacteria (DGGE band A8), and that of denitrifiers (represented by the number ofnirSgene), increased over the 180 day incu-bation (Fig. S4a, b), although less than the Acidimicrobiaceaebacteria (DGGE band A6). Increase in the denitrifier activity was most likely stimulated by the NO−2 gener-ated via Feammox. The number of the amoA gene, representing the abundance of
10
ammonia-oxidizing bacteria, decreased sharply with time and was hardly detected af-ter 90 days of incubation (Fig. S4d).
In the Feammox reactor, the copy number of Acidimicrobiaceae bacterium A6, Anammox bacteria and nirS gene were 0.37×10⁷, 0.13×10⁶, and 0.92×10⁶copies g−1dw, respectively, while the amoA gene was not detected.
15
3.4 Changes of bacterial abundance and activities with NaHCO3amendment
Abundance and activity ofAcidimicrobiaceaebacteria, represented by band A6, were compared between samples incubated under the same conditions except the amounts of NaHCO3 added (0.20 mmol L−1 vs. 1.20 mmol L−1). From day 125 to day 180 of the incubation, both 16S rRNA gene and rRNA fragment numbers of
Acidimicrobi-20
aceae bacteria were higher in the soils with the higher inorganic carbon content. The 16S rRNA gene copies of samples augmented with 1.20 mmol L−1 NaHCO3 were four times higher than those in samples that had been augmented with only 0.20 mmol L−1 NaHCO3 (Fig. 6). The rRNA copies of theAcidimicrobiaceae bacteria, showed even larger differences in response to the amounts of NaHCO3 added. In the
25
BGD
11, 12295–12321, 2014
Characterization of incubation experiments and
development
S. Huang and P. R. Jaffé
Title Page
Abstract Introduction
Conclusions References
Tables Figures
◭ ◮
◭ ◮
Back Close
Full Screen / Esc
Printer-friendly Version
Interactive Discussion
Discussion
P
a
per
|
Discus
sion
P
a
per
|
Discussion
P
a
per
|
Discussion
P
a
per
|
(day 130 to day 180). However, in the samples to which only 0.2 mmol L−1 NaHCO3 were added on day 125, the rRNA number gradually deceased from 0.29±0.10×10⁵ to 0.19±0.05×10⁵ copies g−1dw during the same 50 days incubation (Fig. 6).
3.5 Nitrogen species changes in samples incubated in the presence of C2H2
C2H2 can inhibit the oxidation of NH+4 to NO−2 under aerobic conditions, and the
re-5
duction of N2O to N2 as well as the anammox pathway under anaerobic conditions (Yoshinari et al., 1977; Jensen et al., 2007; Kartal et al., 2011). To gain further insights into the nitrogen removal process observed, incubations with C2H2were conducted. Af-ter 20 days of incubation, less NH+4 was oxidized in the samples amended with C2H2, compared to those incubated without C2H2(Fig. S5a). NO−2, which is postulated to be
10
the direct product of the NH+4 oxidation, accumulated slowly in the samples incubated with C2H2 (Fig. S5b). NO−3 reached a higher concentration in samples without C2H2 than in samples incubated with C2H2(Fig. S5c). N2O, a product of NO−2 reduction, ac-cumulated in the samples incubated with C2H2, which inhibits the reduction of N2O to N2 (Fig. S5d). Fe(II) production was not much affected by the presence of C2H2, and
15
after 20 days incubation was 4.36±0.72 and 5.71±0.67 mmol L−1in sample incubated with and without C2H2, respectively.
4 Discussion
DGGE band A5 represents dissimilatory iron-reducing bacteria, which appeared for a short time at the beginning of the anaerobic incubation. For longer incubation times
20
these heterotrophic bacteria decreased rapidly (Fig. 3). Over a 25 day incubation pe-riod, more than three times the mass of Fe(II) was produced in samples amended with ferrihydrite and NH+4 as compared to the samples amended only with ferrihydrite, in-dicating that most of the Fe(III) reduction came from the Feammox reaction, and not from dissimilatory Fe(III) reduction (Fig. 1a vs. Fig. S2a).
BGD
11, 12295–12321, 2014
Characterization of incubation experiments and
development
S. Huang and P. R. Jaffé
Title Page
Abstract Introduction
Conclusions References
Tables Figures
◭ ◮
◭ ◮
Back Close
Full Screen / Esc
Printer-friendly Version
Interactive Discussion
Discussion
P
a
per
|
Discus
sion
P
a
per
|
Discussion
P
a
per
|
Discussion
P
a
per
|
Ammonia-oxidizing bacteria represented by DGGE band A7 (Fig. 3), as well as the
amoAgene, decreased after 30 days of incubation (Fig. S4d). Oxygen deficiency was the most likely reason for the decline in ammonia-oxidizing bacteria in this system over time (Laanbroek et al., 1994). This decrease inamoAgene at a time of increasing NH+4 oxidation indicates that aerobic ammonia-oxidizing bacteria were not the drivers of the
5
NH+4 oxidation in the later incubation times.
An uncultured Acidimicrobiaceae bacterium became the dominant species during the 180 day anaerobic incubation period, increasing from 0.92 % on day 0 in terms of cell numbers to 14.8 % on day 160. ThisAcidimicrobiaceaebacterium was only de-tected when NaHCO3was supplied as a carbon source, NH+4 as an electron donor, and
10
ferrihydrite as electron acceptor (Fig. 3). The abundance and activity of this Acidimicro-biaceaebacterium increased along with the Feammox activity during the incubations. During the incubation period its rRNA changed from (0.22±0.01)×105copies g−1dw to (0.28±0.07)×106 copies g−1 dw, indicating a substantial increase in its activity (Fig. 6). In the continuous flow membrane reactor, which had a high NH+4 removal
15
and Fe(III) reduction rate, this Acidimicrobiaceae bacterium was enriched from an initial 14.8 % to 40.2 % after 150 days operation (Fig. 4). These results indicate that thisAcidimicrobiaceaebacterium may play an important role in the Feammox reactions described in this study. According to a phylogenetic analysis, this bacterium has a 92 % identity withFerrimicrobium acidiphilumsp. (Table 1).F. acidiphilum, which belongs to
20
theAcidimicrobiaceaefamily, was first isolated from mine environments (Johnson et al., 2009), andF. acidiphilumstrain T23 is the only pure strain with a comprehensive char-acterization. UnculturedFerrimicrobium sp. has been detected in mine water, but so far not in wetland soils (Gonzalez-Toril et al., 2003; Johnson et al., 2009; Bruneel et al., 2011). Ferrimicrobium sp. is an acidophilic heterotrophic ferrous iron oxidizing
bac-25
BGD
11, 12295–12321, 2014
Characterization of incubation experiments and
development
S. Huang and P. R. Jaffé
Title Page
Abstract Introduction
Conclusions References
Tables Figures
◭ ◮
◭ ◮
Back Close
Full Screen / Esc
Printer-friendly Version
Interactive Discussion
Discussion
P
a
per
|
Discus
sion
P
a
per
|
Discussion
P
a
per
|
Discussion
P
a
per
|
in soil environments (Clark and Norris, 1996; Bond et al., 2000; Hartmann et al., 2009). According to a phylogenetic comparison with similar clones from studies reported in the GenBank (Fig. 5), and taking into account its special growth characteristics (stim-ulated by inorganic carbon, oxidizing NH+4 coupled to Fe(III) reduction), as well as its activity increase with increased Feammox activity, this uncultured Acidimicrobiaceae
5
bacterium A6 is probably a previously unreported species in the Acidimicrobiaceae
family that might be either responsible or play a key role in the Feammox process described here.Acidimicrobiaceae bacterium A6 was more active and the Feammox pathway was faster in samples with higher NaHCO3amendments (Figs. 2 and 6), which indicates that thisAcidimicrobiaceae bacterium is an autotroph. Growth ofnirS gene
10
indicated that denitrification pathways were also active in the incubations described here. NO−2 that was being produced during the anaerobic NH+4 oxidation was reduced to N2by denitrifiers, and NO−2 did not accumulate in the system.
The Feammox reaction studied here proceeded only when iron oxides (ferrihydrite or goethite) were supplied as electron acceptor, whereas samples incubated with
fer-15
ric chloride or ferric citrate as the Fe(III) source showed no measurable NH+4 oxidation (Figs. 1 and S1). Since iron oxides adsorb dissolved Fe(II) that is generated via the Feammox reaction, the concentrations of Fe(II) in solution were below the detection limit through the incubation. The acidic conditions of the incubations, lack of dissolved Fe(II) buildup due to sorption, and rapid removal of NO−2 via denitrification makes the
20
Feammox reaction, as shown in Eq. (1), energetically favorable. Various NH+4 oxidation products, i.e. NO−3, NO−2 and N2, generated through the Feammox process are ther-modynamically feasible, and were reported in different Feammox studies (Sawayama, 2006; Shrestha et al., 2009; Yang et al., 2012). In our incubations amended with C2H2, the product of NH+4 oxidation through Feammox was NO−2. When C2H2 was used to
25
BGD
11, 12295–12321, 2014
Characterization of incubation experiments and
development
S. Huang and P. R. Jaffé
Title Page
Abstract Introduction
Conclusions References
Tables Figures
◭ ◮
◭ ◮
Back Close
Full Screen / Esc
Printer-friendly Version
Interactive Discussion
Discussion
P
a
per
|
Discus
sion
P
a
per
|
Discussion
P
a
per
|
Discussion
P
a
per
|
(oxygen<5 µM, Lam et al., 2007), NH+4 oxidation in the presence of C2H2has never been reported. C2H2 is an inhibitor of ammonia monooxygenase (AMO), and can re-strain aerobic NH+4 oxidizers from using oxygen by binding covalently to AMO (Hynes and Knowles, 1982; Hyman and Wood, 1985; Gilch et al., 2009). C2H2can also inhibit the NH+4-activation step of anammox cells, which use NO−2 as the oxidant (Kartal et al.,
5
2011). Therefore these Feammox bacteria might different from common NH+4 oxidizers, by using an alternative NH+4 oxidation pathway that is not inhibited by C2H2, and AMO might not play a role in Feammox.
The role of anammox during the incubations was also evaluated. During the incu-bations the ratio of NH+4 oxidized to Fe(III) reduced increased gradually from 1 : 1.9 to
10
1 : 5.3, which is close to the stoichiometry of 1 : 6, shown in Eq. (1). This indicates that the Feammox reaction became more dominant in terms of NH+4oxidation after 125 days of incubation due to a relative increase in the activity of the Feammox bacteria. A par-allel pathway to Feammox, such as anammox, could explain the lower stoichiometric ratio, especially at earlier incubation times. In the samples taken before the incubation,
15
0.17±0.05×10⁶copies g−1dw of anammox rRNA gene were found, which decreased to 0.09±0.06×10⁵on day 130 (Fig. S4c). We postulate that anammox was responsi-ble for some initial NH+4 and NO−2 removal, and denitrification became more dominant for NO−2 removal later during the incubation period (Figs. 5 and S4b, c).
The results and analyses described here have shown that a Feammox enrichment
20
reactor has the capacity of oxidize NH+4 coupled to iron reduction under anaerobic con-ditions, and that an uncultured Acidimicrobiaceae bacterium A6, which became the dominant species over time might be responsible for this Feammox reaction. Without access to samples from other reported biological NH+4 oxidation by Fe(III) reducers (Sawayama, 2006; Yang et al., 2012), it is not possible to know if the organisms for
25
BGD
11, 12295–12321, 2014
Characterization of incubation experiments and
development
S. Huang and P. R. Jaffé
Title Page
Abstract Introduction
Conclusions References
Tables Figures
◭ ◮
◭ ◮
Back Close
Full Screen / Esc
Printer-friendly Version
Interactive Discussion
Discussion
P
a
per
|
Discus
sion
P
a
per
|
Discussion
P
a
per
|
Discussion
P
a
per
|
The Supplement related to this article is available online at doi:10.5194/bgd-11-12295-2014-supplement.
Acknowledgements. This research was supported by Project X from Princeton University. We
thank L. Young, J. Stock, A. Mumford and S. Zhang for technical assistance.
References
5
Abbassi, R., Yadav, A. K., Huang, S., and Jaffé, P. R.: Laboratory study of nitrification, denitri-fication and anammox processes in membrane bioreactors considering periodic aeration, J. Environ. Manage., 142, 53–59, 2014.
Bond, P. L., Druschel, G. K., and Banfield, J. F.: Comparison of acid mine drainage microbial communities in physically and geochemically distinct ecosystems, Appl. Environ. Microbiol.,
10
66, 4962–4971, 2000.
Braker, G., Fesefeldt, A., and Witzel, K. P.: Development of PCR primer systems for amplifica-tion of nitrite reductase genes (nirKandnirS) to detect denitrifying bacteria in environmental samples, Appl. Environ. Microb., 64, 3769–3775, 1998.
Bruneel, O., Volant, A., Gallien, S., Chaumande, B., Casiot, C., Carapito, C., Bardil, A.,
15
Morin, G., Brown Jr, G. E., Personné, C. J., Le Paslier, D., Schaeffer, C., Van Dorsselaer, A., Bertin, P. N., Elbaz-Poulichet, F., and Arsène-Ploetze, F.: Characterization of the active bac-terial community involved in natural attenuation processes in arsenic-rich creek sediments, Microb. Ecol., 61, 793–810, 2011.
Canfield, D. E., Glazer, A. N., and Falkowski, P. G.: The evolution and future of earth’s nitrogen
20
cycle, Science, 330, 192–196, 2010.
Clark, D. A. and Norris, P. R.:Acidimicrobium ferrooxidans gen. nov., sp. nov.: mixed-culture ferrous iron oxidation withSulfobacillusspecies, Microbiology, 142, 785–790, 1996.
Clement, J. C., Shrestha, J., Ehrenfeld, J. G., and Jaffé, P. R.: Ammonium oxidation cou-pled to dissimilatory reduction of iron under anaerobic conditions in wetland soils, Soil Biol.
25
Biochem., 37, 2323–2328, 2005.
BGD
11, 12295–12321, 2014
Characterization of incubation experiments and
development
S. Huang and P. R. Jaffé
Title Page
Abstract Introduction
Conclusions References
Tables Figures
◭ ◮
◭ ◮
Back Close
Full Screen / Esc
Printer-friendly Version
Interactive Discussion
Discussion
P
a
per
|
Discus
sion
P
a
per
|
Discussion
P
a
per
|
Discussion
P
a
per
|
Coupland, K. and Johnson, D. B.: Evidence that the potential for dissimilatory ferric iron re-duction is widespread among acidophilic heterotrophic bacteria, FEMS Microbiol. Lett., 279, 30–35, 2008.
Gilch, S., Meyer, O., and Schmidt, I.: A soluble form of ammonia monooxygenase from Nitro-somonas europaea, Biol. Chem., 390, 863–873, 2009.
5
Gonzalez-Toril, E., Llobet-Brossa, E. O., Casamayor, R., Amann, R., and Amils, R.: Microbial ecology of an extreme acidic environment, the Tinto River, Appl. Environ. Microb., 69, 4853– 4865, 2003.
Harms, G., Layton, A. C., Dionisi, H. M., Gregory, I. R., Garrett, V. M., Hawkins, S. A., Robin-son, K. G., and Sayler, G. S.: Real-time PCR quantification of nitrifying bacteria in a municipal
10
wastewater treatment plant, Environ. Sci. Technol., 37, 343–351, 2003.
Hartmann, M., Lee, S., Hallamand, S. J., and Mohn, W. W.: Bacterial, archaeal and eukaryal community structures throughout soil horizons of harvested and naturally disturbed forest stands, Environ. Microbiol., 11, 3045–3062, 2009.
Huang, S., Chen, C., Yang, X., Wu, Q., and Zhang, R.: Distribution of typical denitrifying
func-15
tional genes and diversity of thenirS-encoding bacterial community related to environmental characteristics of river sediments, Biogeosciences, 8, 3041–3051, doi:10.5194/bg-8-3041-2011, 2011.
Huelsenbeck, J. P., Ronquist, F. R., Nielsen, R., and Bollback, J. P.: Bayesian inference of phylogeny and its impact on evolutionary biology, Science, 294, 2310–2314, 2001.
20
Hyman, M. R. and Wood, P. M.: Suicidal inactivation and labeling of ammonia monooxygenase by acetylene, Biochem. J., 227, 719–725, 1985.
Hynes, R. K. and Knowles, R.: Effect of acetylene on autotrophic and heterotrophic nitrification, Can. J. Microbiol., 28, 334–340, 1982.
Jensen, M. M., Thamdrup, B., and Dalsgaard, T.: Effect of specific inhibition on anammox and
25
denitrification in marine sediments, Appl. Environ. Microb., 73, 3151–3158, 2007.
Jensen, S., Øvreås, L., Daae, F. L., and Torsvik, V.: Diversity in methane enrichments from agricultural soil revealed by DGGE separation of PCR amplified 16 s rDNA fragments, FEMS Microbiol. Ecol., 26, 17–26, 1998.
Johnson, D. B., Bacelar-Nicolau, P., Okibe, N., Thomas, A., and Hallberg, K. B.: Characteristics
30
of Ferrimicrobium acidiphilum gen. nov., sp. nov., and Ferrithrix thermotolerans gen. nov.,
BGD
11, 12295–12321, 2014
Characterization of incubation experiments and
development
S. Huang and P. R. Jaffé
Title Page
Abstract Introduction
Conclusions References
Tables Figures
◭ ◮
◭ ◮
Back Close
Full Screen / Esc
Printer-friendly Version
Interactive Discussion
Discussion
P
a
per
|
Discus
sion
P
a
per
|
Discussion
P
a
per
|
Discussion
P
a
per
|
Kartal, B., Maalcke, W. J., de Almeida, N. M., Cirpus, I., Gloerich, J., Geerts, W., Op den Camp, H. J. M., Harhangi, H. R., Janssen-Megens, E. M., Francoijs, K., Stunnenberg, H. G., Keltjens, J. T., Jetten, M. S. M., and Strous, M.: Molecular mechanism of anaerobic ammo-nium oxidation, Nature, 479, 127–130, 2011.
Kishimoto, N., Kosako, Y., and Tano, T.: Acidobacterium capsulatum gen. nov., sp. nov.: an
5
acidophilic chemoorganotrophic bacterium containing menaquinone from acidic mineral en-vironment, Curr. Microbiol., 22, 1–7, 1991.
Komlos, J., Kukkadapu, R. K., Zachara, J. M., and Jaffé, P. R.: Biostimulation of iron reduction and subsequent oxidation of sediment containing Fe-silicates and Fe-oxides: effect of redox cycling on Fe(III) bioreduction, Water. Res., 41, 2996–3004, 2007.
10
Laanbroek, H. J., Bodelier, P. L. E., and Gerards, S.: Oxygen consumption kinetics of
Nitro-somonas europaeaandNitrobacter hamburgenis grown in mixed continuous cultures at
dif-ferent oxygen concentrations, Arch. Microbiol., 161, 156–162, 1994.
Lam, P., Jensen, M. M., Lavik, G., McGinnis, D. F., Müller, B., Schubert, C. J., Amann, R., Thamdrup, B., and Kuypers, M. M. M.: Linking crenarchaeal and bacterial nitrification to
15
anammox in the Black Sea, P. Natl. Acad. Sci. USA, 104, 7104–7109, 2007.
Park, H., Rosenthal, A., Ramalingam, K., Fillos, J., and Chandran, K.: Linking community pro-files, gene expression and N-removal in anammox bioreactors treating municipal anaerobic digestion reject water, Environ. Sci. Technol., 44, 6110–6116, 2010.
Pinto, A. J. and Raskin, L.: PCR biases distort bacterial and archaeal community structure in
20
pyrosequencing datasets, PLoS One, 7, 43093, doi:10.1371/journal.pone.0043093, 2012. Poulsen, L. K., Ballard, G., and Stahl, D. A.: Use of rRNA fluorescence in situ hybridization
for measuring the activity of single cells in young and established biofilms, Appl. Environ. Microb., 59, 1354–1360, 1993.
Rosenzweig, B. R., Smith, J. A., Baeck, M. L., and Jaffé, P. R.: Monitoring nitrogen loading and
25
retention in an urban stormwater detention pond, J. Environ. Qual., 40, 598–609, 2011. Rotthauwe, J. H., Witzel, K. P., and Liesack, W.: The ammonia monooxygenase structural gene
amoA as a functional marker: molecular fine-scale analysis of natural ammonia-oxidizing populations, Appl. Environ. Microb., 63, 4704–4712, 1997.
Rowe, O. F., Sánchez-España, J., Hallberg, K. B., and Johnson, D. B.: Microbial communities
30
BGD
11, 12295–12321, 2014
Characterization of incubation experiments and
development
S. Huang and P. R. Jaffé
Title Page
Abstract Introduction
Conclusions References
Tables Figures
◭ ◮
◭ ◮
Back Close
Full Screen / Esc
Printer-friendly Version
Interactive Discussion
Discussion
P
a
per
|
Discus
sion
P
a
per
|
Discussion
P
a
per
|
Discussion
P
a
per
|
Sawayama, S.: Possibility of anoxic ferric ammonium oxidation, J. Biosci. Bioeng., 101, 70–72, 2006.
Schmid, M., Twachtmann, U., Klein, M., Strous, M., Juretschko, S., Jetten, M., Metzger, J. W., Schleifer, K., and Wagner, M.: Molecular evidence for genus level diversity of bacteria capa-ble of catalyzing anaerobic ammonium oxidation, Syst. Appl. Microbiol., 23, 93–106, 2000.
5
Schmid, M., Walsh, K., Webb, R., Rijpstra, W. I., van de Pas-Schoonen, K., Verbruggen, M. J., Hill, T., Moffett, B., Fuerst, J., Schouten, S., Damsté, J. S., Harris, J., Shaw, P., Jetten, M., and Strous, M.: Candidatus “Scalindua brodae,” sp. nov., Candidatus “Scalindua wagneri,” sp. nov., two new species of anaerobic ammonium oxidizing bacteria, Syst. Appl. Microbiol., 26, 529–538, 2003.
10
Shrestha, J., Rich, J., Ehrenfeld, J., and Jaffé, P. R.: Oxidation of ammonium to nitrite under iron-reducing conditions in wetland soils: Laboratory, field demonstrations, and push-pull rate determination, Soil. Sci., 174, 156–164, 2009.
Smith, R. L., Buckwalter, S. P., Repert, D. A., and Miller, D. N.: Small-scale, hydrogen-oxidizing-denitrifying bioreactor for treatment of nitrate-contaminated drinking water, Water. Res., 39,
15
2014–2023, 2005.
Stookey, L. L.: Ferrozine-a new spectrophotometric reagent for iron, Anal. Chem., 42, 779–781, 1970.
Van de Graaf, A. A., de Bruijn, P., Robertson, L. A., Jetten, M. S. M., Kuenen, J. G.: Autotrophic growth of anaerobic ammonium-oxidizing micro-organisms in a fluidized bed reactor, J.
Mi-20
crobiol., 142, 2187–2196, 1996.
Yang, W. H., Weber, K. A., and Silver, W. L.: Nitrogen loss from soil through anaerobic ammo-nium oxidation coupled to iron reduction, Nat. Geosci., 5, 538–541, 2012.
Yoshinari, T., Hynes, R., and Knowles, R.: Acetylene inhibition of nitrous oxide reduction and measurement of denitrification and nitrogen fixation in soil, Soil Biol. Biochem., 9, 177–183,
25
BGD
11, 12295–12321, 2014
Characterization of incubation experiments and
development
S. Huang and P. R. Jaffé
Title Page
Abstract Introduction
Conclusions References
Tables Figures
◭ ◮
◭ ◮
Back Close
Full Screen / Esc
Printer-friendly Version
Interactive Discussion
Discussion
P
a
per
|
Discus
sion
P
a
per
|
Discussion
P
a
per
|
Discussion
P
a
per
|
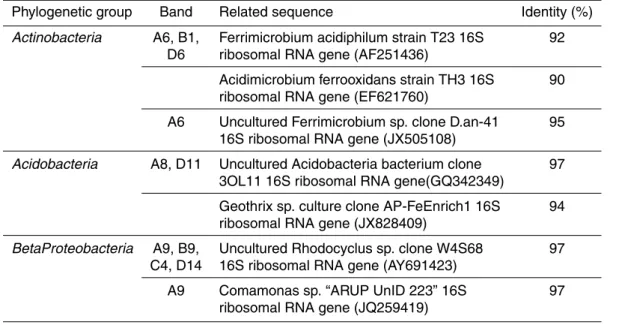
Table 1.Sequence analysis of bands excised from DGGE gels of soil samples with Feammox
Activity.
Phylogenetic group Band Related sequence Identity (%)
Actinobacteria A6, B1, Ferrimicrobium acidiphilum strain T23 16S 92
D6 ribosomal RNA gene (AF251436)
Acidimicrobium ferrooxidans strain TH3 16S 90
ribosomal RNA gene (EF621760)
A6 Uncultured Ferrimicrobium sp. clone D.an-41 95
16S ribosomal RNA gene (JX505108)
Acidobacteria A8, D11 Uncultured Acidobacteria bacterium clone 97
3OL11 16S ribosomal RNA gene(GQ342349)
Geothrix sp. culture clone AP-FeEnrich1 16S 94
ribosomal RNA gene (JX828409)
BetaProteobacteria A9, B9, Uncultured Rhodocyclus sp. clone W4S68 97
C4, D14 16S ribosomal RNA gene (AY691423)
A9 Comamonas sp. “ARUP UnID 223” 16S 97
BGD
11, 12295–12321, 2014
Characterization of incubation experiments and
development
S. Huang and P. R. Jaffé
Title Page
Abstract Introduction
Conclusions References
Tables Figures
◭ ◮
◭ ◮
Back Close
Full Screen / Esc
Printer-friendly Version
Interactive Discussion
Discussion
P
a
per
|
Discus
sion
P
a
per
|
Discussion
P
a
per
|
Discussion
P
a
per
|
0 3 6 9 12 15 18
0 5 10 15 20 25 30 35
F
e(I
I) (mmol
L
-1)
Time (days)
a
0 0.5 1 1.5 2 2.5 3 3.5
0 5 10 15 20 25 30 35
NH
4
+ (mmol
L
-1)
Time (days)
b
Figure 1. Concentration of Fe(II) and NH+4 in incubation with three different Fe(III) sources:
ferrihydrite (), ferric chloride (), and ferric citrate (N). The values represent the mean and
standard error (n=3).
BGD
11, 12295–12321, 2014
Characterization of incubation experiments and
development
S. Huang and P. R. Jaffé
Title Page
Abstract Introduction
Conclusions References
Tables Figures
◭ ◮
◭ ◮
Back Close
Full Screen / Esc
Printer-friendly Version
Interactive Discussion
Discussion
P
a
per
|
Discus
sion
P
a
per
|
Discussion
P
a
per
|
Discussion
P
a
per
|
0 6 12 18 24
0 20 40 60 80 100 120 140 160 180 200
F
e(I
I) (mmol
L
-1)
Time (days)
a
0 1 2 3 4
0 20 40 60 80 100 120 140 160 180 200
NH
4
+ (mmol
L
-1)
Time (days)
b
Figure 2.Concentration of(a)Fe(II) and(b)NH+4 during the 180 day incubation. 25 mmol L−1
Fe(III) was added on day 0. 1.0 mmol L−1NH+4 was added on days 4, 24, and 60. 0.2 mmol L−1
NaHCO3 was added on day 50 and day 90. 1.2 mmol L
−1
+2 mmol L−1of NH4Cl were added
on day 125. The values represent the mean and standard error (n=3).
BGD
11, 12295–12321, 2014
Characterization of incubation experiments and
development
S. Huang and P. R. Jaffé
Title Page
Abstract Introduction
Conclusions References
Tables Figures
◭ ◮
◭ ◮
Back Close
Full Screen / Esc
Printer-friendly Version
Interactive Discussion
Discussion
P
a
per
|
Discus
sion
P
a
per
|
Discussion
P
a
per
|
Discussion
P
a
per
|
Figure 3.Comparison of DGGE analysis profiles of soil communities during anaerobic
incuba-tions. Samples from 0, 30, 90 and 160 days of incubation with ferrihydrite+NH4Cl+NaHCO3
(lane 1–4); 160 days of incubation with only ferrihydrite (lane 5); ferric chloride+NH4Cl (lane 6); ferric citrate+NH4Cl (lane 7); 120 days incubation with ferrihydrite+NH4Cl+NaHCO3+
organic carbon (band 8); ferrihydrite+NH4Cl+organic carbon (lane 9). Samples from 6 and
120 days of incubation without any addition (lane 10 and 11) were use as controls.
BGD
11, 12295–12321, 2014
Characterization of incubation experiments and
development
S. Huang and P. R. Jaffé
Title Page
Abstract Introduction
Conclusions References
Tables Figures
◭ ◮
◭ ◮
Back Close
Full Screen / Esc
Printer-friendly Version
Interactive Discussion
Discussion
P
a
per
|
Discus
sion
P
a
per
|
Discussion
P
a
per
|
Discussion
P
a
per
|
0% 20% 40% 60% 80% 100%
0 30 90 160 Reactor
pe
rc
ent
age
s of t
ot
al
s
eque
nc
es
Unclassilfied bacteria
Verrucomicrobia
Armatimonadetes
Chlamydiae
Fusobacteria
Nitrospira
Planctomycetes
Acidobacteria
Firmicutes
Actinobacteria
Chloroflexi
Bacteroidetes
δ-Protebacteria
γ-Protebacteria
β-Protebacteria
α-Protebacteria
Figure 4.Relative abundance of bacterial phyla for each soil samples during anaerobic
incu-bations (days 0, 30, 90, 160) and enrichment culture from the reactor.
BGD
11, 12295–12321, 2014
Characterization of incubation experiments and
development
S. Huang and P. R. Jaffé
Title Page
Abstract Introduction
Conclusions References
Tables Figures
◭ ◮
◭ ◮
Back Close
Full Screen / Esc
Printer-friendly Version
Interactive Discussion
Discussion
P
a
per
|
Discus
sion
P
a
per
|
Discussion
P
a
per
|
Discussion
P
a
per
|
Figure 5.Phylogenetic tree ofAcidimicrobiaceae-related sequences. The tree was constructed
using the Bayesian inference (BI) method with 16S rRNA gene sequences from DGGE band A6 and bacteria from theAcidimicrobiaceae family from other studies. Sequences determined in this study are in bold. Bootstrap values were based on 1000 replicates each and are shown at the nodes with>50 % bootstrap support. The scale bar represents 10 % sequence divergence.
BGD
11, 12295–12321, 2014
Characterization of incubation experiments and
development
S. Huang and P. R. Jaffé
Title Page Abstract Introduction Conclusions References Tables Figures ◭ ◮ ◭ ◮ Back Close
Full Screen / Esc
Printer-friendly Version Interactive Discussion Discussion P a per | Discus sion P a per | Discussion P a per | Discussion P a per | 32 576 577 578 579 580 581 582 583 584 585 586 587 588 589 590 ◆ ☐ 0 0.4 0.8 1.2 T otal b ac te ri al ab u n d ce ( × 10 8 g -1 d w ) 0 0.2 0.4 0.6
0 30 60 90 130 140 160 180
16S r R N A c op ie s of Ac idi m ic r obi ac e ae b ac te ri u m A 6 ( × 10
7 /
10
6 g -1 d
w
)
Time (days)
Figure 6.Abundance of total bacteria (
ria (◆)
☐
) during 180 days of anaerobic incubation. 16S rRNA gene (
◆
ne (
)
☐
) and RNA (
◆
A (
)
☐
) copy numbers ofAcidimicrobiaceaebacterium A6 in soil samples with 1.20 mmol L−1NaHCO3addition. 16S rRNA gene (
32
◆
ne (
☐
) and RNA ()
32
◆
☐
A (
) copy numbers of bacterium)
A6 with 0.20 mmol L−1NaHCO3addition.