for the Development of Titanium Biomedical Alloys
*e-mail: [email protected]
Potentialities of Some Surface Characterization Techniques for the
Development of Titanium Biomedical Alloys
P.S. Vanzillottaa,G. A. Soaresa*, I. N. Bastosb, R. A. Simãoa, N. K. Kuromotoa, c
aCOPPE/UFRJ, P.O.Box 68505, Rio de Janeiro, 21945-970, RJ, Brazil bIPRJ/UERJ, P.O. Box 97282, 28601-970 Nova Friburgo RJ, Brazil
cPhysics Department, UFPR, Curitiba PR, Brazil
Received: October 2, 2003; March 15, 2004
Bone formation around a metallic implant is a complex process that involves micro- and nanometric interactions. Several surface treatments, including coatings were developed in order to obtain faster osseointegration. To understand the role of these surface treatments on bone formation it is necessary to choose adequate characterization techniques. Among them, we have selected electron microscopy, profilometry, atomic force microscopy (AFM) and X-ray photoelectron spectroscopy (XPS) to describe them briefly. Examples of the potentialities of these techniques on the characterization of titanium for biomedical applications were also presented and discussed. Unfortunately more than one technique is usually necessary to describe conveniently the topography (scanning electron microsocopy, profilometry and/or AFM) and the chemical state (XPS) of the external layer of the material surface. The employment of the techniques above described can be useful especially for the development of new materials or products.
Keywords:titanium, implant surface, characterization techniques
1. Introduction
Metallic implant materials have a significant impact in the biomaterials field, specially in applications requiring me-chanical properties like meme-chanical strength and toughness. Among metallic materials, titanium and titanium alloys are considered the best choice for manufacturing permanent implants. The biocompatibility of titanium is due to the dense and well-adhered oxide layer, which is formed in contact with several environment, like air or water1. Commercially pure titanium and Ti-6Al-4V alloy are the two most com-mon titanium-based implant biomaterials2, although some researchers discuss the potential citotoxicity associated to the vanadium element3.
The osseointegration concept was created by Branemark and since then, researchers all over the world have been trying to develop surfaces which can result into faster bone formation around a metallic implant. These surface treat-ments include mechanical blasting coupled or not, with acid etch4,5, bioactive coatings6-9 and, more recently, ano-dized surfaces10,11.
Besides implant design (macro scale), surface
proper-ties in micro – and nanometric scale can affect bone forma-tion. However, these properties (surface composition, sur-face energy and topography) are interrelated12 and conse-quently it is very difficult to determine how coatings and/or surface modifications affect – as an independent factor – the final result. In the case of anodized titanium, the nature of oxide (thickness, porosity and crystallinity) seems to strongly affect in vivo performance, but the
characteriza-tion of those nanometric layers is not trivial as it involves sophisticated and expensive techniques, like X-ray photo-electron spectroscopy (XPS), atomic force microscopy (AFM), Raman spectroscopy or ellipsometry12.
The biological behavior is determined by using in vitro
(simulated body fluids or cell culture) and/or in vivo tests,
usually employing rabbits or dogs as animal model13. The determination of the osseointegration percentage on in vivo
behavior and the interaction between material surface and cells, although those results can not be directly extrapolated to clinical applications.
Among several techniques capable of investigating dif-ferent aspects of the surface, we have chosen four to de-scribe briefly. They are: electron microscopy, profilometry, atomic force microscopy (AFM) and X-ray photoelectron spectroscopy (XPS). Examples of the potentialities of these techniques on the characterization of titanium biomedical surfaces were also presented and discussed. The choice was made considering the capabilities of these techniques to measure properties related to biocompatibility, and in some cases, by the simplicity of sample preparation.
2. Electron Microscopy
Without considering optical microscopy, electron microscopy – specially scanning electron microscopy (SEM) – is the oldest and more popular technique employed in materials characterization. SEM is used as the first choice to examine a surface material, although sample preparation can introduce some artifacts. With the low-vacuum and en-vironmental microscopes the sample preparation becomes even easier but, in Brazil, there is a limited number of such equipment.
SEM functions by focusing and scanning a relatively high-energy electron beam (usually 15 - 30keV) on a
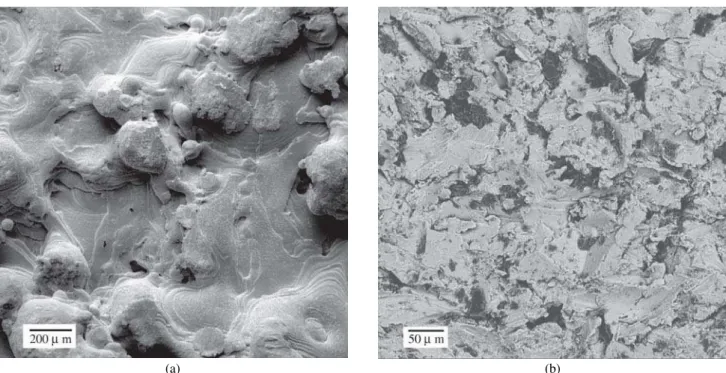
speci-men. The main advantage of SEM is the use of the low-energy secondary electrons (SE), resultant of the sample-beam interaction, to produce images with high focus depth. As only secondary electrons generated near the surface can escape and be detected, SEM can be considered a surface analysis method15 which generates beautiful topographic images. On the other hand, with the use of backscattered electrons (BSE) some topographic details are lost, but high contrast images can be obtained. BSE signal depends on the element atomic number in the analyzed region with brighter area corresponding to higher atomic number ele-ments. This can be useful, for example, to identify contami-nant particles on titanium surface. Figure 1a shows the topo-graphic image of a titanium orthopedic plate coated with titanium by using plasma spray process in order to generate a rough topography, more suitable to osseointegration. Other option to create a rough topography consists in submit me-tallic surface to mechanical blasting, by using aluminum oxide or titanium oxide. In Fig. 1b residual particles of alumina (darker) on a titanium sheet (brighter) were identi-fied. These hard particles come from mechanical blasting with alumina4 and according to some researchers these residues can negatively affect osteoblast proliferation16.
Recently, some authors have also used SEM images to determine the osseointegration percentage, e.g., the contact length of bone-implant interface17-19. For this metallic
im-Figure 1. SEM images using different electron detectors: a) topographic image of a titanium orthopedic plate coated with titanium by plasma spray process. SE image; (50 ×); b) residual particles of alumina (darker) on a titanium sheet (brighter) previously submitted to mechanical blasting with alumina. BSE image; (200 ×).
for the Development of Titanium Biomedical Alloys plants were inserted into rabbit’s tibia, following approved
protocols. After 2-3 months, the animals were sacrificed. Sections of each implant with surrounding bone tissue were removed, fixed, dehydrated and finally embedded in low viscosity resin. These samples can be examined through optical microscopy or more recently by using SEM19. The advantage of the use of SEM, instead of transmission opti-cal microscopy, remains in the fact that, with SEM, the cut of very thin slices is not necessary. By using BSE image a good contrast can be achieved, as shown in Fig. 2, and con-sequently, those images can be easily processed by digital systems19.
Transmission electron microscopy (TEM) or scanning-transmission electron microscopy (STEM) can also be em-ployed in surface characterization. As the preparation of cross-section samples is very laborious, not so much data concerning titanium surface investigation is available in current literature.
Usually electron microscopy is associated with energy dispersive spectrometer (EDS) which provides qualitative or semi-quantitative information concerning elements present in a such region. The collision of the electron beam with sample surface removes some electrons from their positions which is followed by electron transition. Conse-quently, a X-ray emission with characteristic energy related to the transition type occurs. After the collection by spe-cific sensor and the processing of the signal, it is transformed into EDS spectrum. This information is very important for several researches, but this type of analysis is not actually considered a surface technique because X-ray signal is col-lected from depths up to 1 µm, depending on the voltage
and the electron beam diameter utilized20.
While SEM qualitatively describes the surface topogra-phy, it does not provide the quantitative values of the sur-faces. Therefore, profilometry seems to be more conven-ient to quantify topographical parameters.
3. Profilometry
In many applications, topography represents the main external features of a surface. A relatively new and devel-oping field of application of three-dimensional analysis is that of bioengineering, where the surface texture can be very important. Besides its clear influence on mechanical stress distribution in the interface implant-bone, the texture is ex-pected to affect the protein adhesion, the orientation of bone growth and consequently, the clinical performance.
The real surface differs from the nominal one due to the presence of surface texture, flaws and errors of form21. In-deed, these components are linearly overlapped. In this sense, the components of real surface may be classified as: • Roughness - the finer irregularities of the surface tex-ture that usually result from the inherent action of the
production process or material condition;
• Waviness - the more widely spaced component of the surface. Vibrations, workpiece or machine deflections are the common causes for this component;
• Lay - the predominant direction of the surface pat-tern, normally determined by the production method used.
The main procedure to discriminate these components is the choice of adequate cutoff. The cutoff separates rough-ness and wavirough-ness by using proper spatial lengths. The cut-off is expressed in mm and standard values are available elsewhere22. In biomaterial field, roughness gained more at-tention as its spatial scales are closer to the chemical, bio-logical and mechanical process scales that take place on the metallic surface.
Methods of measurements can be classified as contact or non-contact methods, and as three-dimensional (area), 3D, or two-dimensional (profile), 2D procedures. The con-tact equipment uses a stylus that plows through the surface of workpiece. On soft materials, the stylus may produce a visible mark as it is being used. Such mark does not neces-sarily mean that the measurement is incorrect. In these cases, it may be desirable to make supplementary measurement with a non-contact instrument to ascertain that the penetra-tion into the material is small compared to the irregularities being measured23. In general, the equipment for the meas-urement of surface texture encompass full profiling instru-ments, instruments with parameters and limited profile ca-pability, and instruments with parameters only. Therefore,
whenever this non-contact measurement is available, this has to be the chosen technique to evaluate the texture pa-rameters. Otherwise, the non-contact profilometry isn’t available, special care should be taken by the users, since this procedure is influenced by space dimensions and plas-tic deformation. Besides, the statisplas-tical descriptors obtained from profilometry have complex physical meanings not being possible to directly associate them to different ex-perimental techniques. As the plastic deformation produced by the stylus is dependant on surface hardness and the ac-tual local stress one preliminary guide should be the sur-face hardness, but, as yet, the authors of this paper do not know of any published standards that can be based upon. Thus, the contact profilometry is currently used to evaluate the texture of titanium samples as shown in the literature works, in spite of visible deformation on titanium surface. The traditional parameter used to evaluate a surface is a roughness average, Ra. The Ra parameter is the arithmetic average of the absolute values of the profile height devia-tion recorded within the evaluadevia-tion length and measured from the mean line.
This is a 2D parameter and even the simplest equipment provides this parameter. Although the widespread use of Ra, it is not a parameter of merit, and frequently its value does not produce good correlation with the expected bio-logic behavior. In this sense, hip joint surfaces with similar Ra may have different behavior in surgical success21, 15. This situation points out the necessity of other parameters to ex-press correctly the surface nature. Indeed, there are many 2D and 3D parameters to evaluate quantitatively the sur-face, but only a 3D facilities provides information related to all surface, since the real surface of implants are 3D.
The full profiling instrument allows a qualitatively vi-sion of surface and also gives numerical 3D parameters. As an example, Fig. 3 shows a 3D plot of etched titanium alloy after alkali treatment with NaOH aqueous solution at 130 °C for 1 h and subsequent heat treatment at 600 °C for 1 h24.
This procedure is normally used before soaking Ti implant in simulated body fluid to nucleate calcium phosphate24. Therefore, the osseointegration process is improved.
When full profiling instruments are used, the Ra param-eters can be changed to Sa, which corresponds to all sur-face, not only to a single profile. In the present case, where Ti was ground with emery paper and subsequently etched with NaOH, it is possible to note that the attack was suffi-cient to remove the lay left by abrasives. The Sa value is 0.134 µm for this surface. Table 1 shows some 3D
param-eters that can be useful to describe the surface of implants. The evaluation of smoothness of hip prosthesis surfaces requires to be measured down to nanometer level in order to monitor wear and pit distribution, and 3D profilometry are suitable21. Another process that occurs in spatial scale smaller than the current technique cannot be highly corre-lated with the evaluated surface parameters since the di-mensions are not similar. The stylus itself limits the mini-mum size of the irregularities that can be measured. The typical radii of profilometry ranging between 1-10 µm, and
its space resolution is about 1 µm. The atomic force
microscopy has a radius of approximately 100 nm, and spa-tial resolution of 5 nm. These characteristics naturally se-lect the related interface phenomena. The influence of some factors like binding proteins to the surface, ionic leakage and cellular adhesion will result only in good correlation with texture if the geometric scales are similar. For exam-ple, the cell adhesion is better when the peaks are not too high and the valleys are not too deep25. Therefore, to study these specific effects, a technique with higher spatial reso-lution can be more adequate. The AFM – atomic force microscopy is the technique suitable to quantify topogra-phy when spatial scales are small.
4. AFM - Atomic Force Microscopy
Among several probe microscopies, AFM - developed
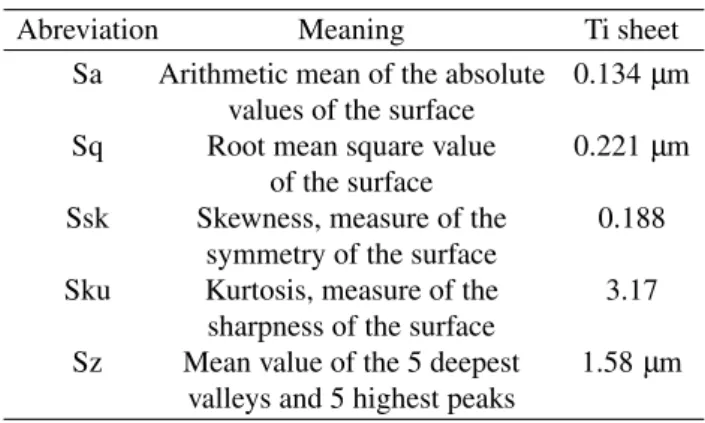
Table 1. Some three-dimension parameters used to describe
sur-faces. The example is referred to the titanium sheet presented in Fig. 3.
Abreviation Meaning Ti sheet Sa Arithmetic mean of the absolute 0.134 µm
values of the surface
Sq Root mean square value 0.221 µm
of the surface
Ssk Skewness, measure of the 0.188 symmetry of the surface
Sku Kurtosis, measure of the 3.17 sharpness of the surface
Sz Mean value of the 5 deepest 1.58 µm
valleys and 5 highest peaks
Figure 3. Three dimensional plot of titanium surface after alkali
for the Development of Titanium Biomedical Alloys around the 90’s - is preferred due to its versatility: the
sam-ple may not be a conductor and it may be examined even in liquid media. The AFM principle is similar to the contact profilometry but works with nanometric tip and a very sen-sitive system resulting in surface investigation in nanometric scale.
Beyond being merely a tool for measuring surface to-pography, AFM has made significant contributions to biomaterials research in areas dealing with structure, prop-erties, dynamics and manipulation26. Interface phenomena like protein adsorption, conformational changes and subse-quent interaction with cellular components could not be observed directly until the advent of the atomic force microscopy27. As it was told before, these mechanisms may explain why one surface treatment can exhibit a perform-ance superior to another. Force detection techniques allow the determination of cell adhesion on metallic surfaces, con-tributing to molecular level studies of individual receptor-ligand binding events27.
AFM images require posterior processing and its analy-sis is not trivial as several parameters (i.e. special tip con-figuration) may affect final result. The surface of the ano-dized titanium sheet was investigated by using AFM. The material investigated consists of commercially pure titanium sheets (20 × 10) mm2 with 0.9 mm of thickness. To attain this effect, the surface of the sample was carefully ground with silicon carbide and polished with alumina plus oxalic acid. After that, half of the sample was coated with enamel to avoid that this region was etched during the electrochemical treatment. Anodizing process was carried out at room temperature (RT) using H3PO4 solution (8%), a platinum counter electrode and applied voltage of 20V for 10 min, resulting in a blue color film28. After anodic etch-ing two different regions could be clearly distetch-inguished on the sample: one containing only polished titanium (with a very thin oxide layer) and the other containing the oxide film electrochemically produced. AFM measurements were performed at RT in air. We used conventionally available Si3N4 tips, spring constant of the cantilever equal 0.6 N/m and imaged the surface in contact mode using a tripot 100 µm scanner.
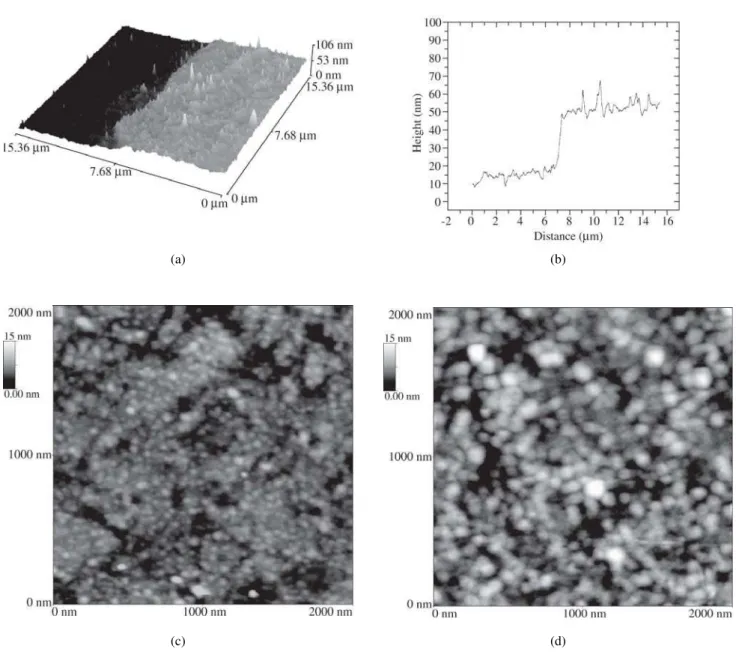
Figure 4a shows a three dimension (3D) view (15 µm ×
15 µm × 100 nm) of the titanium surface and probe the two
regions of the sample. The thickness of the anodized layer was measured by using data obtained from line profiles on the interfacial region, like that showed in Fig. 4b. The me-dium value was around 30 nm which is less than data ob-tained by other authors29,30. Titanium surface with natural oxide film and anodized film has the appearance illustrated in Fig. 4c and 4d, respectively. Figure 4c shows the non-treated titanium surface exhibiting a very thin oxide layer consisting in nanometric grain size oxide. In the anodized film region, an increase in roughness and in grain size of
the oxide layer was observed (Fig. 4d). This result is in good agreement with Bearinger et al.31 who showed that the
ox-ide growth depends on the environment conditions. In the open air, adsorption and nucleation events occur immedi-ately, thereby rapidly creating a few monolayers of titanium oxide on the titanium substrate; upon immersion in ano-dized medium the oxide continues to grow and coalesce.
Unfortunately, neither AFM nor profilometry gives chemical information of the surface, so these techniques must be coupled with chemical investigation in nanoscale, with the use of, for example, the X-ray photoelectron spectroscopy.
5. X-ray Photoelectron Spectroscopy - XPS
X-ray photoelectron spectroscopy (XPS), also called elemental spectroscopy for chemical analysis (ESCA) is a very important technique to identify chemical species on materials surface. This technique is not very popular due to its high equipment cost and because the spectra interpreta-tion is not trivial. The photoelectric effect was described by Einstein in 1905, but the use of XPS for materials charac-terization started only in the 80’s15 and data available are not yet sufficient to identify all spectra unequivocally. The XPS principle is quite similar to the EDS principle, but in-stead of an electron beam, XPS uses a monochromatic low-energy X-ray beam. The interaction between the incident beam and the atoms of the material causes the emission of a core level electron. The XPS detects the kinetic energy of electrons which provides information about the nature and environment of the atom from which it came15. Among the advantages of using XPS for biomaterials characterization, the possibility to analyze samples without particular speci-men preparation may be pointed out. The disadvantages are related to the need of vacuum compatibility, the possibility of sample damage and the difficult of equipment availability. Figure 5 shows the XPS spectrum of a titanium sheet anodized with H3PO4 (8%) solution at 20V for 10 min11. The aim of this surface treatment is to develop a titanium oxide layer as several recent researches consider this sur-face suitable to accelerate osseointegration10,12,29. It is not clear how this kind of surface interacts with biological me-dia, but we have speculated whether phosphorus ions could be incorporated to oxide layer helping the cascade of events that culminate in mature bone. Although this latter infor-mation is not yet confirmed, by XPS analysis we could iden-tify the presence of phosphorus with kinetic energy com-patible with phosphate group32. XPS spectrum can be quan-tified but error is estimated in around 10%.
XPS technique has also been used on investigations con-cerning in vitro behavior of synthetic materials. Since
(a) (b)
(c) (d)
Figure 4. Anodized film produced by electrolytic etch on the half surface of commercially pure titanium sheet: a) 3D view. Darker region corresponds to polished titanium surface; b) Line profile on interfacial region from Fig. 4a; c) Image (2 µm × 2 µm) of natural oxide film; d) Image (2 µm × 2 µm) of anodized oxide film.
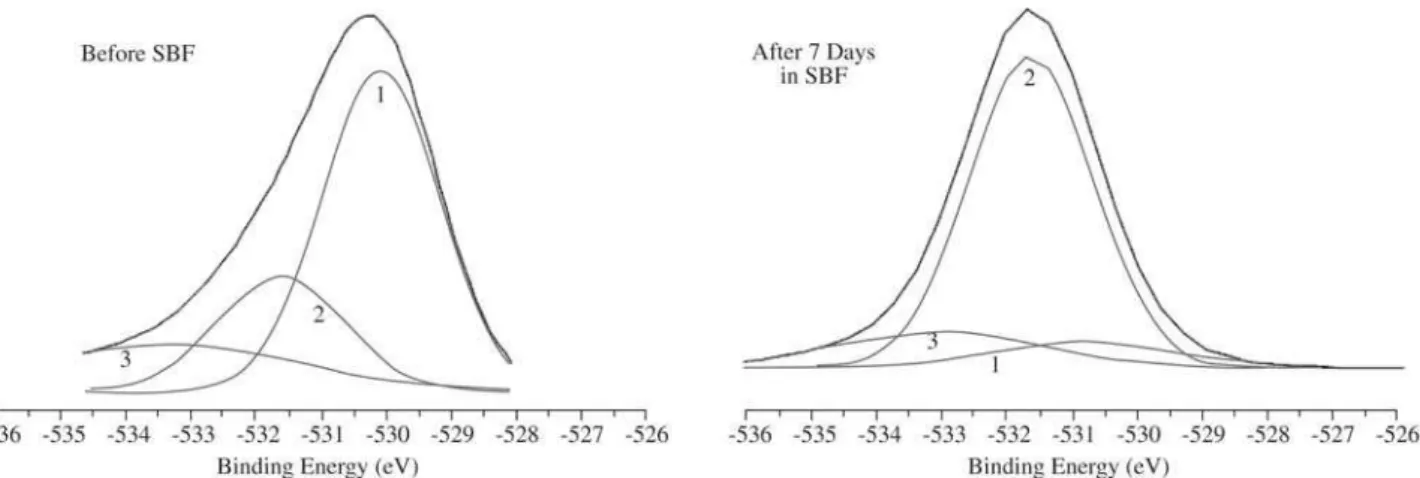
position to a SBF11. The Ti anodized surface exhibits oxy-gen with energy corresponding to a titanium oxide, TiO2. After SBF soaking, the energy of O 1s changed with this value compatible with the oxygen in the phosphate radi-cal. After this time the total calcium content reached 15.5 at. % and the content of P increased from 3.5 (t = 0) to 9.6 at.% (t = 7 days), resulting in a Ca/P ratio (1.61 ± 0.16) compatible with an hydroxyapatite32.
Several other techniques may be employed in biomedi-cal surface characterization. Surface energy is very
impor-vivo success33, these in vitro tests became very popular. This
kind of in vitro test, also called “bioactivity test” consists
for the Development of Titanium Biomedical Alloys tant as it can alter protein configuration and cell
attach-ment and can be determined by contact-angle measure-ments. Unfortunately, no direct correlation between sur-face energy parameters and cell proliferation has already been established. Other sophisticated techniques involv-ing interactions with electrons (Auger electron spectroscopy – AES, electron energy loss spectroscopy – EELS), ions (secondary ion mass spectroscopy – SIMS, ion scattering spectroscopy – ISS) or neutrons (neutron scatter-ing) may be useful. For example, static SIMS is more ad-equate to identify a particular protein configuration than XPS12, although the use of these techniques is not trivial. Consequently, a more fundamental research is necessary to understand the processes occurring at biological interfaces, thus clarifying the role of materials surface on bone forma-tion process.
6. Conclusions
The characterization of materials surface is very impor-tant as initial in vivo response is highly dependent on
sur-face properties. Among the techniques herein discussed, scanning electron microscopy (SEM), profilometry and atomic force microscopy (AFM) are very adequate to in-vestigate materials topography in different scale levels. In order to chemically characterize the outer layers of titanium/titanium alloys surface X-ray photoelectron spectrometry (XPS) is the most appropriate technique. Sum-marizing, the four techniques presented have potentialities to characterize the titanium biomedical alloys in order to improve their subsequent in vivo performance, but more than
one technique is necessary to describe conveniently the material surface.
Acknowledgements
The authors would like to acknowledge the support of CAPES, CNPq, FAPERJ and FUJB. The XPS spectra were obtained in the NUCAT Lab. at PEQ/COPPE/UFRJ. This research is part of the Molecular and Interfaces Nanotechnology Research Network (RENAMI) supported by CNPq.
References
1. Diebold, U., The Surface Science of Titanium Dioxide,
Surf. Sci. Reports, v. 48, p. 53-229, 2003.
2. Steinemann, S.G., Periodontology, v. 17, p. 7-20, 1998.
3. Froes, F.H.; Caplan, I.L., Proceedings of the Titanium-92, San Diego, California, v. 3, p. 2705, 1992.
4. Diniz, M.G.; Soares, G.A.; Coelho, M.J.; Fernandes, M.H., J. Mater. Science: Mater. in Medicine, v. 13,
p. 421-432, 2002.
Figure 6. Anodized titanium sheet before and after immersion for 7 days into SBF around. XPS spectra around O 1s region. 1) O2- ; 2) OH
-or PO43- ; 3) adsorbed water.
Figure 5. XPS general spectrum of a titanium sheet anodized with
5. Wennerberg, A.; Albrektsson, T.; Andersson, B., The In-tern. JOMI, v. 11, n.1, p. 38, 1996.
6. De Groot K.; Wolke J.C.K.; Jansen J.A., J. of Oral Implantology, p. 232-234, 1994.
7. Shi, J.; Ding, C.; Wu, Y., Surface and Coatings Tech.,
v. 137, p. 97-103, 2001
8. Kokubo T.; Miyaji F.; Min-Kim H.; Nakamura T., J. of the American Ceramic Society, v. 79, n. 4, p. 1127-29,
1996.
9. Sena, L.A.; Andrade, M.C.; Rossi, A.M.; Soares, G.A.,
J. Biomed. Mater. Res, v. 60, p. 1-7, 2002
10. Sul, Y.T.; Johansson, C.B.; Petronis, S.; Kroser, A.; Jeong, Y.; Wennerberg, A.; Albrektsson, T.,
Biomaterials, v. 23, p. 491-501, 2002.
11. De Sena, L.A.; Rocha, N.C.C.; Andrade, M.C.; Soares, G.A. Surface and Coatings Technology, v. 166, p.
254-258, 2003.
12. Jones, F.H., Surface Science Reports, v. 42, p. 75-205,
2001.
13. Black, J., Biological Performance of Materials: Fun-damentals of Biocompatibility, Marcel Dekker Inc., New
York, p. 285-329, 1992.
14. Almeida, J.M.V., M.Sc. Thesis, COPPE/UFRJ, Brazil,
2003.
15. Ratner, B.D.; Hoffman, A.S.; Schoen, F.J.; Lemons, J.E., Biomaterials Science: An Introduction to Materials in Medicine, Academic Press, California, USA, p. 23-28,
p. 447-449, 1996.
16. Prado da Silva, M.H.; Soares, G.A.; Elias, C.N.; Best, S.M.; Gibson, I.R.; DiSilvio, L.; Dalby, M.J., J. of Mater Sci.: Mater in Medicine, v. 13, p. 511-519, 2003.
17. Vidigal Jr., G.M.; Sader, M.S.; Soares, G.A., Anais do XVIII CSBMM, Águas de Lindóia, SP, Brazil, p. 09-10,
outubro/2001
18. Brogniez, V.; D’Hoore, W.; Grégoire, V.; Munting, E.,
The Intern. JOMI, v. 15, n. 4, p. 511-518, 2000.
19. Almeida, C.C., M.Sc. Thesis, COPPE/UFRJ, Brazil, 2002.
20. Kestembach, H-J.; Botta F.; W.J., Microscopia Eletrônica de Transmissão e Varredura, Édile Serviços
Gráficos e Editora Ltda., SP., Brazil, p. 104, 1994. 21. Stout, K.J.; Blunt, L.; Int. J. Mach. Tools Manufact.,
v. 35, p. 219-229, 1995.
22. Surface Texture, ASME B46.1-1995 Standard, New York, USA, 1996.
23. Chappard, D.; Degasne, I.; Huré, G.; Legrand, E.; Audran, M.; Baslé, M.F. Biomaterials, v. 24,
p.1399-1407, 2003.
24. Pinto, V.B.B., M.Sc. Thesis, COPPE/UFRJ, Brazil,
2003.
25. Bigerelle, M.; Anselme, K.; Dufresne, E.; Hardouin, P.; Iost, A. Biomolecular Engineering, v. 19, p. 79-83,
2002.
26. Jandt, K.D., Surface Science, v. 491, n. 3, p. 303-332,
2001.
27. Siedlecki, C.A.; Marchant, R.E., Biomaterials, v. 19,
p. 441-454, 1998.
28. Kuromoto, N.K.; Sena, L.A.; Simão, R.A.; Soares, G.A.,
Anais do XIX CSBMM, Caxambu, MG, Brazil, 2003.
29. Velten, D.; Biehl, V.; Aubertin, F.; Valeske, B.; Possart, W.; Breme, J., J. of Biomedical Mater.Research, v. 59,
n. 1, p. 18-28, 2002.
30. Cigada, A.; Cabrini, M.; Pedeferri, P., J. of Mater. Sci-ence: Materials in Medicine, v. 3, p. 408-412, 1992.
31. Bearinger, J.B.; Orme, C.A.; Gilbert, J.L., Surface Sci-ence, v. 491, p. 370-387, 2001.
32. Takadama, H.; Kim, H-M.; Kokubo, T.; Nakamura, T.,
Surface and Tech. of Advanced Materials, v. 2, p.
389-396, 2001.
33. Kokubo, T.; Kim, H.M.; Kawashita, M.; Nakamura, T., in: Bone Engineering, ed. By J.E. Davies, Canada,
p. 190-194, 2000.
34. Casaletto, M.P.; Ingo, G.M.; Kaciulis, S.; Mattogno, G.; Pandolfi, L.; Scavia, G.; Applied Surface Science,