A Work Project, presented as part of the requirements for the Award of a Masters Degree in Economics from the NOVA – School of Business and Economics.
The Influence of Traditional Authority on Voting Behavior in Mozambique
João Leonel Antunes Morgado nº510
A Project carried out under the supervision of: Professor Pedro Vicente
2
Abstract
Local elites in developing African countries, the so-called Traditional Authorities, still hold considerable power over rural communities, namely they are likely to have a decisive influence on their voting behavior. This study measures this influence using data collected through a field experiment for Aker, Collier and Vicente (2011) during the Mozambican elections of 2009 in 161 locations. The results obtained point to a positive correlation between a set of indicators of the power of Traditional Authorities and both voter turnout and the vote for Frelimo, the incumbent.
Keywords: Traditional Authorities, Voting Behavior, Political Economy, Mozambique. 1. Introduction
It is widely accepted that institutions are a relevant factor for economic development. Acemoglu, Johnson and Robinson (2001) argue that worse performing institutions, namely deficiencies on property rights protection, are at the root of the lagging economic performance of developing countries. Democracy is generally believed to be the solution to this problem, assuring the proper functioning of institutions through a system of checks and balances which ensures the accountability of the ones in power. However, even democratic systems are subject to wide range of problems, such as corruption or clientelism, in particular in societies characterized by the low levels of information of their citizens. This seems to be the case in most developing countries where democracy is in place.
Mozambique seems to suit this description. The evolution of democracy in this country, since 1994, has been marked by a sharp reduction in turnout from one election to the other, and by an increasing hegemony of the former single party, Frelimo. Mattes and Shenga (2007) describe the Mozambican society as largely “uncritical” and uninformed, where most citizens seem unable to issue opinions on political matters while the few that can tend to have “extremely positive views”. In such a scenario, electors are highly susceptible of being manipulated or even coerced when it comes to express their will in the defining moments of a democracy, the elections.
3
The present work seeks to assess the influence of local elites on the voting behavior of rural communities. In rural Mozambique, elites are formed by traditional authorities who have responsibility over matters as diverse as the allocation of land, the resolution of conflicts between community members or even the collection of taxes. These figures, banished by Frelimo after the independence of the country in 1975 never disappeared. In fact, during the civil war, the “Chiefs” were among the most important bases of support of Renamo, the opposition movement. Oddly or not, the same party that had banished them in the first place, Frelimo, reinstated their power in 2000, after the particularly disputed elections of 1999. This move was, most likely, a consequence of their influence on the electoral behavior of the respective communities. Notwithstanding, this influence was never quantified. That is precisely the aim of this study.
The data base used for this purpose was collected through the field experiment conducted for Aker, Collier and Vicente (2011) during the general elections of 2009. The experiment comprised three different interventions of voter education, spread across 161 locations (including the control group) in the provinces of Cabo Delgado, Zambezia, Gaza and Maputo-Province. The post-election questionnaire, which is used in this study, included 1154 randomly selected respondents with access to cell-phones (required by the interventions). In this questionnaire, the respondents reported whether they voted or not and the party/candidate in which they voted for (our outcome variables). In addition to this, they were asked to report a wide range of information about the Leaders of their communities (the main explanatory variables). This information included the responsibility of the Leaders over several matters (e.g. land allocation, distribution of food), the repondents’ dependence and agreement with their decisions and whether they usually assisted the community in solving problems, measures which might be understood as proxies of the Chiefs’ power. Additionally, they were asked to report whether they had met the chief or his deputy on election day which are potential measures of the direct interference of the Leaders during the election. Finally, the interviewees were asked how much information about the election they had received from the Chiefs, a measure of the
4
information channeled/controlled by the Leaders. Apart from this data, I also used the official electoral results of these locations as alternative outcome variables.
Two estimation methods were employed to determine the impact of the main explanatory variables, described above, on voting behavior (turnout and voting patterns), Ordinary Least Squares (OLS) and Two Stage Least Squares (2SLS). The application of the second method seeks to solve the problems of endogeneity associated with the use of perception explanatory variables. The instrument used was a measure of war victimization included in the survey, where the respondents reported the political force responsible for the potential death of a relative during the Mozambican civil war. This instrument finds support in Bellows and Miguel (2009) and in Blattman (2009) which provide empirical evidence for a positive correlation between war victimization and political and civic participation. Since the data base did not contain information identifying the Chiefs, they were proxied through the subject with highest social capital in each location.
The estimations obtained through the OLS method point to a positive marginal impact of our indicators on both self-reported and official turnout, ranging from 1 to 5% in the first case and from 5 to 12% in the second. In addition to this, I identified positive marginal effects on the self-reported vote for Frelimo/Guebuza and on their official share of votes per location, ranging from 2 to 8% in the first case and from 2 to 4% in the second. In both cases, I found statistically significant effects for the three types of indicators previously identified, direct proxies of the power of the Chiefs, measures of their interference during the election and indicators of the information they control. Concerning the estimations obtained through the 2SLS method, the marginal impacts found seem disproportionately large (some bigger than 100%), possibly because this group of estimations was obtained using a considerably smaller sample. Nonetheless, the variables representing direct proxies of the power of the Chiefs present robust positive effects on all outcome variables previously mentioned with the exception of official turnout for which no significant impacts were found.
5
The rest of this study is structured as follows. Section 2 presents a brief literature review. Section 3 provides the political and historical context of this work. Section 4 presents the data base while section 5 describes the estimation strategy. Section 6 displays the econometric results and section 7 concludes.
2. Literature Review
This section presents a summary of the literature related to the present study. Many authors from the fields of sociology and anthropology have focused on the topic of African Traditional Authorities even though, few quantitative works have been released on this issue. Baldwin (2012), “Why Vote with the Chief? Political Connections and Public Goods Provision in Zambia” is perhaps one of the few exceptions. This study, based on an experiment randomizing information about the political preferences of the Chiefs across a group of voters, finds that the citizens might vote according to the preferences of the Leaders due to the belief that their communities might benefit in terms of provision of public goods from the relationship existing between the Chiefs and the candidates of their preference.
This work also relates to the literature which explores the problems of fragile democracies, in particular with the studies of explicit electoral problems. Vicente (2010) provides empirical evidence from a field experiment in São Tome and Principe on the effectiveness of vote buying finding that vote buying increases turnout and the vote share of the challenger. Wantchekon (2003) shows, through a field experiment in Benin during the Presidential elections of 2001, that clientelistic “appeals” yield better results on average for all types of candidates, incumbents and challengers. Banerjee, Kumar, Pande and Su (2010) find that a campaign increasing the access of randomized voters to information on the performance of their elected representatives before a Regional election in India decreased the vote share of “worse performing incumbents”, reinforcing the idea that accountability increases with informed voters.
In addition to this, it is associated with the growing literature on social networks, namely the influence of the traditional authorities on voting behavior studied here is likely to be determined by the social connections between the Leaders and the individuals of the respective communities. Nickerson (2008) studies
intra-6
household peer effects on turnout through a randomized “Get Out the Vote” campaign in the US, finding large effects of contagion between targeted and non-targeted individuals. Gine and Mansuri (2011) show that the effects of a randomized door-to-door campaign focused on female turnout are very similar for the neighbors and close friends of the targeted women. Fafchamps and Vicente (2011) find that “kinship ties” are very effective in diffusing the effects of a campaign against political violence to non-targeted individuals and simultaneously in reinforcing the effects among targeted subjects. At last, Fafchamps, Vaz and Vicente (2012), exploring the same field experiment as the present study (Aker, Collier and Vicente, 2011), find that the peer effects of a campaign of voter education may also have a negative impact on political participation possibly due to the induction of free-riding.
Finally, this work is also complementary to the studies about the ethnic “foundations” of political behavior. Posner (2004) provides empirical evidence, using the division of two ethnic groups by the administrative border between Zambia and Malawi as a natural experiment, that “political cleavage” between two different ethnicities is not an intrinsic condition but rather a phenomenon dependent on the “size of these groups relative to the size of the political arena in which they are located”. In the same spirit, Eifert, Miguel and Posner (2010) show that ethnic identification tends to increase with the “proximity” to an election and with the competitiveness of that election, using a broad data base including 10 different African countries.
3. Context
The General Peace Accords reached in Rome, in 1992, between Frelimo (which had lead the country since its independence, in 1975, under a single-party Socialist Regime) and Renamo (the opposition movement supported by the Apartheid and Rhodesian Regimes) would end the armed conflict between these two forces bringing a multi-party political system to the country. Since then, 4 general elections have taken place in Mozambique (1994, 1999, 2004 and 2009), all won by Frelimo. Despite this fact, Frelimo only achieved overwhelming majorities in the elections of 2004 and 2009 (62% and 75% respectively1). The results of the
1
7
first two elections would actually give the impression of a competitive political system, namely in 1999, former President Chissano (from Frelimo) was almost defeated by Afonso Dhlakama (Renamo’s Leader) with a vote share of 52% against roughly 48% obtained by the opposition candidate.
Many factors may have contributed to the radical change observed in Mozambique. Among them, there was drastic reduction of turnout from the first elections to the last two, dropping from an interval of 70 to 90% to roughly 40%. In addition to this, Renamo was clearly harmed by the appearance of MDM (Movimento Democrático Moçambicano), a party born out of the secession of Daviz Simango, mayor of Beira (second biggest city of the country). Finally, the traditional authorities might have had some role in this phenomenon.
As West and Kloeck-Jenson (1999) recognize, the traditional leaders were instrumental to the Portuguese authorities during colonial rule in the collection of taxes and recruitment of labor in the rural areas. Due to this fact, when independence came, Frelimo decided to replace them by a new structure integrated in the spirit of the new socialist state (the so-called “Grupos Dinamizadores”). Nevertheless, the figure of the traditional leaders never “ceased to exist”, most importantly, Renamo, taking advantage of their discontent towards the ruling party, started to use them as base of support in the rural areas they controlled. This state of affairs lasted into the post-war period. As the afore-mentioned study points out, “within the context of the post-war (…) Mozambican state, those identified as traditional authorities (…) associate more easily with Renamo than with Frelimo”. Even though, it did not take long for Frelimo to realize the relevance of the Traditional Leaders within the new multiparty system. Actually, according to West and Kloeck-Jensen, “President Chissano (…) met with groups of former traditional leaders in several (…) Mozambican provinces in the months leading up the 1994 elections”. Moreover, as the same study points out, in June 1995 returning from a meeting with former traditional authorities in Niassa, former President Chissano stated to the press: “We want traditional authority to exist”. Notwithstanding, the most important move to gain the support of the “Chiefs” would only be taken few months after the contested elections of 1999 with
8
the approval of decree 15/2000 in June 2000 reinstating the power of the Traditional Authorities over matters as diverse as the register of the population, the exploitation of land or even granting them a subsidy in exchange for assistance in tax collection just as during colonial times.
4. Data
The data base used for this study consists of the data collected through a household survey for Aker, Collier and Vicente (2011). This study was based on a field experiment conducted during the Mozambican general elections (parliamentary and presidential) of 2009 to measure the impact of electoral education interventions on voting behavior.
The experiment comprised 4 groups of locations (enumeration areas) corresponding to three different treatments and a control group amounting to 161 locations in total. Two surveys were carried in each location, before and after the election (baseline and post-election). The three different interventions consisted of a civic education treatment, based on the distribution of a leaflet from the electoral commission, a treatment based on the distribution of a newspaper containing an electoral education message and on the dissemination of a cell phone hotline to which citizens could report electoral problems.
The 161 enumeration areas were spread across four provinces, Cabo Delgado and Zambezia, in the north of the country, and Gaza and Maputo-Province in the south. The locations targeted by the experiment were selected according to a two-stage clustered representative sampling technique using the 2004 electoral map as the sampling framework (each enumeration area corresponds to a polling location). Clusters of 4 enumeration areas, formed according to geographical proximity, were randomly selected using the number of registered voters in each cluster as weights. In sequence, the treatments were randomly assigned to one enumeration area in each cluster. Since the interventions required the use of cell phones, the polling locations without cell phone coverage were excluded from the pool of locations restricting the final sample. Within each enumeration area the experimental subjects were selected using a “standard household representativeness ( household)”. In addition to this, the targeted individuals were “the household heads
9
or their spouses” with access to a cell phone. In each location, 11 individuals/households were interviewed during the baseline survey amounting to 1766 respondents. The post-election survey targeted the same respondents but due to attrition only 1154 were interviewed.
The present study derives from the data collected through the post-election survey with exception to the demographic information and a measure of individual social capital included in the baseline survey. The post election survey included questions regarding the voting behavior of the respondents (turnout and voting patterns) and, as importantly, questions regarding the influence of the Traditional Leaders on several aspects of the respondents’ lives including their electoral behavior. In particular, the interviewees were asked how much information about the election they had received from the Leaders, how often they asked them for help, how often the Leaders’ had contacted with the respective communities during the year prior to the election, how much their daily life had depended on the Leaders’ decisions and how often they had agreed with the Leaders’ decisions during the same period. In addition to this, the respondents were asked to rate the level of responsibility of the Leaders over seven different matters from land allocation to the distribution of food. Finally, the interviewees were also asked to report whether they had met the Leader or his deputies during the election day and whether any of these persons had summoned them to vote. Some other questions also proved to be useful, namely the respondents were asked to report whether they had lost any relatives during the civil war and the political force responsible for the death. All this questions were answered using “stepwise scales” introduced by the interviewer.
In addition to this data source, I also used the official electoral results specified by enumeration area as alternative outcome variables. This included the share of votes obtained by each candidate/party and the turnout in percentage of total voters.
5. Estimation Strategy
The main purpose of the econometric estimations of this study is to quantify the impact of different measures (proxies) of power of the traditional authorities on the voting behavior of the respective
10
communities. The main idea is that the Traditional Leaders might be interested in increasing turnout and the vote share of a certain political force, due to their political affiliation, a potential clientelistic relation with government officials or even with the purpose of increasing the provision of public goods to their communities by electing a certain candidate. I used two different types of outcome variables, the self-reported voting behavior and the electoral results per enumeration area (all of them are binary). For each type of outcome variable I used a different econometric specification. The specification used for the self-reported outcome variables is described through the following expression:
. (1)
represents the outcome variable at the individual level while is the identifier of the individual. corresponds to the main explanatory variable and is the effect of interest. is a vector of three dummy variables controlling for the three treatments of Aker, Collier and Vicente (2011). is a vector of individual demographic controls. Note that there is no time identifier since all variables correspond to the post election survey, thus there is no time variation.
In the regressions using the electoral results per enumeration area as dependent variable, the main explanatory variables and demographic controls were transformed to reflect the average of the respective location. In addition to this, given that these estimations featured the variation at the location level, a vector containing location controls is also included. The specification corresponding to these regressions is the following:
(2)
represents the outcome variable at the location level while is the location identifier. corresponds to the main explanatory variable and is the effect of interest once again. is a vector of three dummy variables controlling for the three treatments of Aker, Collier and Vicente (2011). is a vector containing the averages of individual demographic controls per location and is a vector of location controls.
11
Two different estimation methods were employed, ordinary least squares (OLS) and two stage least squares (2SLS). The Linear Probability Model (LPM) was preferred over the Logit estimation method despite its well-known shortfalls. The estimations obtained through the LPM model are not only easier to interpret as none of the marginal impacts of the main explanatory variables obtained through this method were bigger than one2 (quite the contrary). In addition to this, intuition does not point to a non-linear relation between the relative power of the traditional leaders and the voting behavior of their communities, if anything the marginal impact should grow with their power not the opposite. Moreover, the heteroskedasticity yielded by this method was corrected in the regressions featuring individual variation using standard errors clustered at the location level correcting as well for the correlation between individuals belonging to the same enumeration area. In the second type of estimations, this problem was solved using robust standard errors. Finally, the LPM also allows comparability with the estimations obtained through 2SLS.
The employment of the 2SLS method is justified by the endogeneity of the main explanatory variables. The endogeneity of the variables of interest might be a consequence of both omitted variable bias and measurement error. On the one hand, there are several factors that may influence the voting behavior of the individuals of the sample that cannot be observed or for which there is no available information. On the other hand, given that the main independent variables are perceptions from the respondents of the survey, the measures are very likely to suffer from response bias. The instrument used finds support in the literature of civil conflict specifically, in Bellows and Miguel (2009) and Blattman (2009). Bellows and Miguel (2009) found that war victims in Sierra Leone, namely individuals that lost relatives during the civil war, “are much more active civic and political participants than non-victims”. Blattman (2009) found that the children “abducted” to Joseph Kony’s army in Uganda are much more likely to vote and perform community leadership roles later on due to the violence they witnessed (perpetrating violence does not have a statistically significant impact). These findings lead me to instrument the several measures of power of the
2
To ensure the robustness of the results obtained, I also estimated them using the logit model obtaining very similar results. These estimations are not presented in this study.
12
traditional leaders through their experience of the civil war. The main hypothesis is that war victimization is positively correlated with the current power of Leaders, as the literature mentioned points out, but not correlated with the voting behavior of the individuals of our sample, respecting the exclusion restriction. Since the survey did not have information identifying the traditional leaders I used the individual with highest social capital in each location as a proxy (when more than one individual shared the highest score I took a simple average). Social capital was measured through the aggregation of three questions in which the respondents were asked to report their role in religious groups, unions and local organizations (the scale went from non-member to leader). The average age of the individuals with the highest social capital per location in 2009 was 40 years old (the median was 38) implying that they were 23 years old on average in 1992 when the civil war ended. In this way, the hypothesis that their leadership positions could have been largely determined previously to the civil war is ruled out reassuring the idea behind the instrument. To measure war victimization I used the answer of these individuals to a question where they were asked to report if they had lost any relative during the civil war and which political force was responsible for the loss. This variable may also be subject to some response bias but since the answers do not imply any rating on a subjective scale it should not be significant.
6. Econometric Results (All tables mentioned in this section may be found in the Appendix) 6.1. Descriptive Statistics
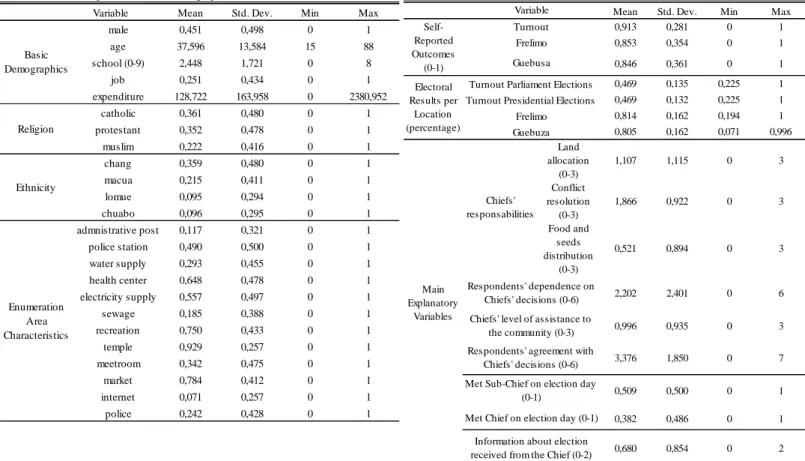
I begin the presentation of the econometric results of this study introducing the descriptive statistics of the demographics and main outcome and explanatory variables of the sample. Table 1 presents the main demographics and the location characteristics that were used as controls in the estimations. As the table depicts the average respondent was 38 years old and only had elementary education (level 2). Only 25% of them had paid jobs whereas the average daily expenditure per household was 128 Meticais. The main religions represented in the sample were catholic (36%), protestant (35%) and muslim (22%) while the main ethnicities were Changana (36% ), Macua (22%), Lomue (10%) and Chuabo (10%).
13
Table 2 presents the main outcome and explanatory variables. The table presents both the self-reported voting patterns and the electoral results per enumeration area. As the table shows, 91% of the respondents reported to have voted. The difference with the official turnout at the location level is striking, on average only 47% of the voters went to the polls. As the figures indicate roughly 85% of the respondents reported to have voted for Frelimo and Armando Guebuza (Frelimo’s presidential candidate). The electoral results at the location level do not differ much from these numbers, on average 81% of the voters of the locations where the survey was conducted voted for Frelimo and Armando Guebuza. Actually, Renamo, the main opposition party, only had a larger voting share than Frelimo in 4 of the 161 enumeration areas. These numbers substantiate the estimation strategy used for some of the effects that will be presented in the next subsections. Given that the overwhelming majority of the respondents and the large majority of the voters of the locations featured in this study present a very strong preference for the ruling party (Frelimo), I only present the estimations where the turnout and the vote for Frelimo or its Presidential candidate serve as outcome variables. Moreover, in such a scenario it is not outrageous to assume that the traditional leaders of these locations were affiliated or had a preference for Frelimo. In this way, it is reasonable to regress the vote for Frelimo or Guebuza directly on our variables of interest without any interaction with the potential political affiliation of the Chiefs.
Table 2 also describes the main explanatory variables. They are divided in three groups. The first group includes six variables that are direct proxies of the power of the Tradional Leaders, three variables where the respondents were asked to report the responsibility of the leaders over land allocation, conflict resolution and the distribution of food and seeds for agriculture, one variable where the interviewees were asked to indicate their level of dependence on the decisions of the Chiefs, other reporting the assistance of traditional authorities to the community in the resolution of problems (in a scale of 0-3) and finally one variable reporting the level of agreement of the interviewees with the decisions of the chiefs (in a scale of 0-6). The second group includes two variables that are potential measures of the interference of the Chiefs during the
14
election day (“met the chief or the sub-chief during election day”). At last, the third group includes one variable which is a potential indicator of the information controlled or channeled by the Leaders, a variable indicating the amount of information about the election the respondents received from the Chief. This group of nine variables was chosen because it is comprehensive of the several dimensions of the potential influence of the traditional authorities on the voting behavior of the respective communities.
6.2. Voter Turnout and Voting Patterns (OLS)
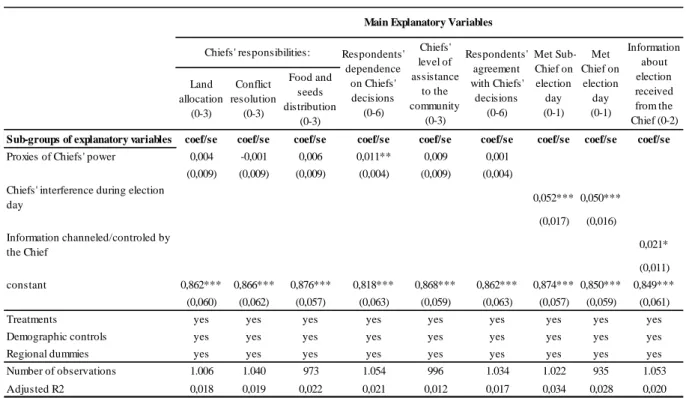
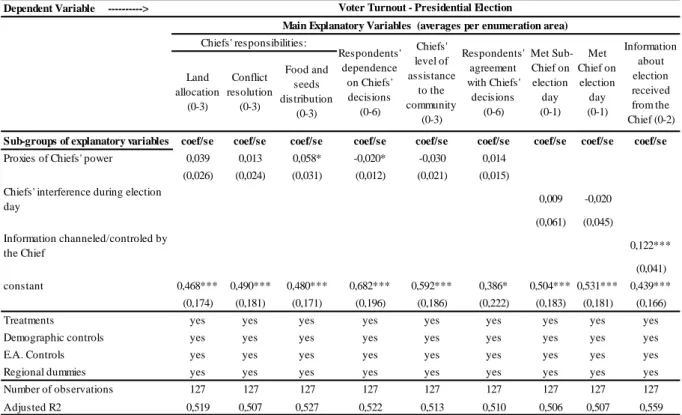
Tables 3, 4 and 5 present the estimated marginal impacts of the main explanatory variables on self-reported voter turnout and on the official turnout of the parliamentary and presidential elections per polling station. Only the effect of the variable reporting the amount of information about the election received from the traditional leader is robust across the three formulations (significant at the 10% level on the first specification and at the 1% level on the other two) with a marginal impact of 2% on self-reported turnout and roughly 12% on official turnout. The two variables reporting whether the respondents met the Chief or his deputy during election day are both significant at the 1% level in the first formulation, having the largest marginal impact on self-reported turnout among the variables considered (5%). Even though, this effect does not hold when measured at the location level using the official turnout as outcome variable. Concerning the first group of variables, including direct proxies of the power of the Chiefs, three out of the 6 measures are significant in at least one of the formulations. The variables indicating the responsibility of the Chiefs’ over land allocation and over the distribution of food and seeds for agriculture, only have significant coefficients on the regressions using official turnout at the location level as outcome (at the 5% level), however only the second one has a robust effect across the two specifications. The variable reporting the dependence of the respondents on the decisions of the Chiefs has conflicting effects with a positive and significant coefficient on self-reported turnout and a significant negative marginal impact on the official turnout of the presidential elections (at the 10% level). However, a careful comparison of tables 4 and 5 denotes that the negative marginal impact of this variable should not be overvalued. These two specifications use two outcome
15
variables that are only slightly different (the difference between the turnout on the parliamentary and presidential elections is residual, given that the electors voted for the two at the same time), even though the negative coefficient of this variable is only significant (at the 10% level) in the second case.
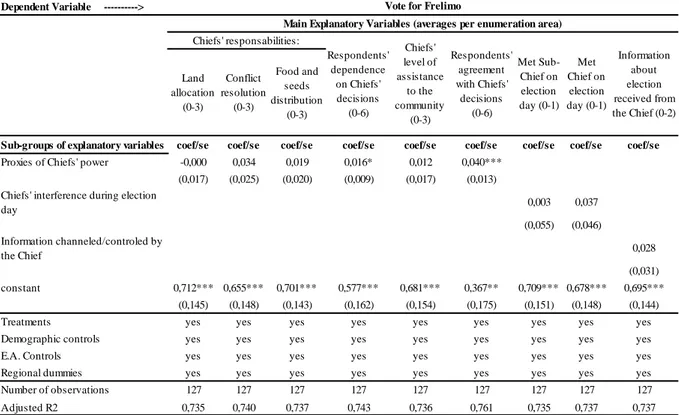
The estimated effects of our variables on the vote for Frelimo (self-reported and location results) are presented by tables 6 and 7. Among the direct proxies of the Chiefs’ power, three variables have significant and positive marginal impacts on either the self reported vote for Frelimo or on its electoral results at the location level. The marginal impact corresponding to the level of dependence of the respondents on the decisions of the Leaders is robust across both specifications (significant at the 1% level and 10% levels respectively). The coefficient corresponding to the Chiefs’ responsibility over the distribution of food and seeds is only significant (at the 5% level) on the first specification while the variable reporting the respondents’ agreement with the decisions of the chief has significant positive effect, at the 1% level, on the vote share at the location level. The two variables belonging to the second group only have significant positive effects on the self-reported vote, one at the 1% level (“met the sub-chief on the election day”) and the other at the 5% level (“met the chief on the election day”). As before these variables have the largest marginal impacts on the self-reported vote between 5 and 7%. Finally, the measure reporting the amount of information about the election received from the leader has significant positive effect (at the 10% level) on the self-reported vote.
Finally, tables 8 and 9 display the results of our estimations using the vote for Armando Guebuza (self-reported and per location) as an outcome variable. Among the 6 variables representing direct proxies of the Leader’s power, three are statistically significant in the first specification and two on the second. However, only one is common to both formulations. The variable which shows consistent effects is the dependence of the respondents on the decisions of the Leaders, significant at the 1% level on the first formulation and at the 10% level on the second. The coefficients corresponding to the responsibility of the Leaders over the distribution of food and seeds and to their level of assistance in the resolution of problems of the community
16
have positive marginal impacts on the self-reported vote at the 5% level. In addition to this, the marginal impacts related to the respondents’ agreement with their decisions is significant in the second specification at the 1% levels respectively. The variables reporting the interference of the traditional authorities during election day only have significant impacts on the self-reported vote for Guebuza (both at the 1% level). Lastly, the indicator of the amount of information about the election received from the Leaders is significant at the 5% level in the first specification but not on the second. Similarly to the previous cases, the magnitude of the marginal impacts on these outcome variables lies between 2 and 8%.
Summarizing the results presented in this section we are able to identify some patterns. Within the first group of variables, understood as direct proxies of the power of the traditional authorities, the variable reporting the level of dependence of the respondents on the decisions of the traditional leaders seems to have a robust positive impact on turnout and on the vote for Frelimo and Guebuza. The only exception seems to be the formulation using the official turnout of the presidential elections as the outcome, where it presents a significant negative marginal impact, which does not seem to be a very reliable result as I had the opportunity to point out. In addition to this, the variable indicating the responsibility of the Traditional Leaders over the distribution of food and seeds for agriculture also presents relatively robust effects with significant and positive marginal impacts in the specifications using the official turnout at the location level and the self-reported vote for Frelimo and Guebuza as outcomes. Moreover, the variable reporting the level of agreement of the respondents with the decisions of the Chiefs has significant and positive coefficients in the specifications using the electoral results of Frelimo and Guebuza as dependent variables. Interpreting these results within the scope of the first group of variables, it seems reasonable that a variable reporting the direct dependence of respondents on the leaders and a variable indicating their responsibility over an essential resource should have stronger effects. Furthermore, it also seems logical that variable which in some sense reflects the “support” of the communities to their Leaders presents robust impacts. Regarding the variables indicating the direct interference of the Leaders during the election day, they present the
17
marginal effects with the highest levels of statistical significance and highest magnitude in the formulations which use the self-reported outcomes. Even though, this effects do not hold in the specifications using the official results at the location level as outcomes. Finally, the variable reporting the information controlled by the Leaders, presents very consistent results. This variable has positive statistically significant effects on all the specifications of turnout and on the specifications using the self-reported vote for Frelimo and Guebuza as outcome. In addition to this, the effects of this variable on turnout seem to be considerably large (12 to 13%). There seems to be some inconsistency between the results obtained for the self-reported outcomes and the electoral results. The fact that our sample is only representative of the population which uses cell-phones is a possible explanation. Even though, the effects described point to a positive correlation between the power of the traditional leaders and our measures of turnout and vote for Frelimo and Armando Guebuza. If we believe the Chiefs have a preference for Frelimo (for reasons aforementioned in this study) it is reasonable to expect them to exert their influence to increase the vote in this party. This effect would obviously increase with their power.
6.3. Voter Turnout and Voting Patterns (2SLS)
This section presents the estimations obtained through the 2SLS estimation method. As explained in section 5, the variable used as instrument reports which political force was responsible for the death of a relative by the individuals with the highest social capital in each location (proxies of the Leaders). This variable took a score one when the political force responsible for the loss was Renamo and zero when the responsible was Frelimo. Even though not presented in this document, the first stage relation between the great majority of the main explanatory variables and the instrument was positive as expected. This means that there is a positive correlation between current “power” of the Leaders and the loss of a relative during the civil war perpetrated by Renamo. This makes sense given the extreme preference for Frelimo of the locations included in the sample as demonstrated in section 6.1. The use of this variable as an instrument caused a sharp decrease in the number of observations of the sample, in particular the regressions using the electoral
18
results as outcome variables were left with 47 observations. This factor should be taken into account when analyzing the results.
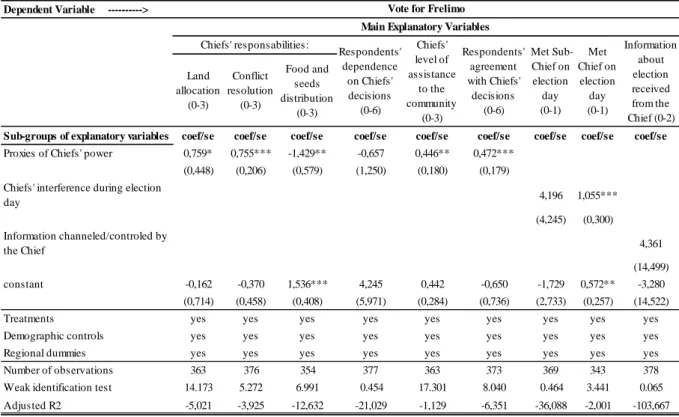
Tables 10 and 11 depict the marginal impacts of our main variables on the vote for Frelimo (self-reported and at the location level). Among the direct proxies of the Chiefs’ power, five present positive statistically significant marginal impacts on the self-reported vote for Frelimo even though, only two of those are also significant in the second specification. The Leader’s level of assistance to the community in the resolution of problems has a significant and positive marginal impact on both outcome variables, scoring higher than 10 (the rule of thumb for this test) in the weak identification test in the first specification. The coefficient corresponding to level of responsibility of the Chiefs over conflict resolution is also positive and statistically significant in both specifications however, it only scores 5 and 1 on the weak identification tests. The variables indicating the Leader’s responsibility over the allocation of land and the level of agreement of the respondents with their decisions have significant and positive marginal impacts on the self-reported outcome (at the 10% and 1% levels respectively) with a scores of 14 and 8 on the weak identification test. Unexpectedly, the coefficient of the variable indicating the responsibility of the Leaders over the distribution of food and seeds is negative and statistically significant with a score of 7 on the weak identification test for the first specification. The marginal impact of the variable reporting whether the respondents met the Chief on election day is also statistically significant and positive for both outcome variables (at the 1% level) nevertheless it only scores 3 and 5 on the weak identification test. The variable belonging to the third group does not present statistically significant impacts in any of the formulations. Concerning the size of the marginal impacts they appear to be considerably large when compared with the results obtained with the OLS estimation method, namely the two variables with a score higher than 10 on the weak identification test in the formulation using the self-reported vote for Frelimo, present marginal impacts of approximately 76% and 47% respectively. When interpreting these results tough, we should bear in mind that the estimation method employed does not bound the estimations to the 0-1 interval.
19
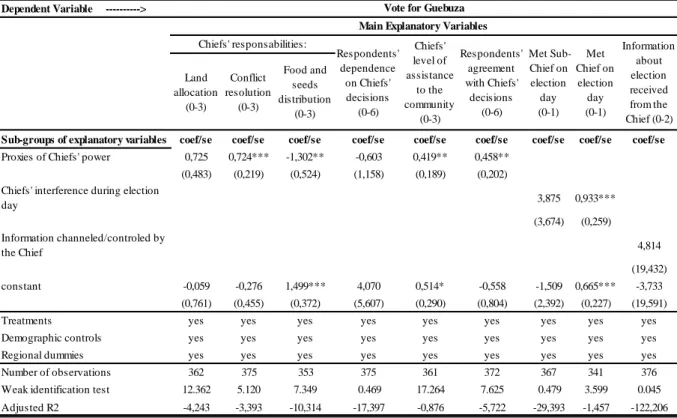
Tables 12 and 13 display the estimations obtained using the vote for Guebuza as outcome variable. Within the first group of variables, only two have consistent significant positive effects on both outcomes. These coefficients correspond to the Chief’s assistance to the community and to the variable indicating the responsibility of the Leaders’ on the resolution of conflicts. Even though, only the first variable on the first specification has a score higher than 10 on the weak identification test. The marginal impact of the variable where the respondents report their agreement with the decisions of the Leader is also significant and positive for the self-reported outcome at the 1% level with a weak identification test of approximately 8. As before, the coefficient corresponding to the responsibility of the Chiefs over the distribution of food and seeds is negative and statistically significant at the 5% level and with a score on the weak identification test of 7. In addition to this, the coefficient of the variable indicating whether the respondents met the chief on election day remains significant at the 1% level for both outcome variables with scores of 4 and 5 on the weak identification test. The variable belonging to the third group, does not present statistically significant impacts in any of the formulations as in the previous case. Concerning the size of the marginal impacts, the pattern highlighted before remains, namely the only variable which had a score higher than 10 on the weak identification test and a statistically significant effect has a marginal impact of 42%.
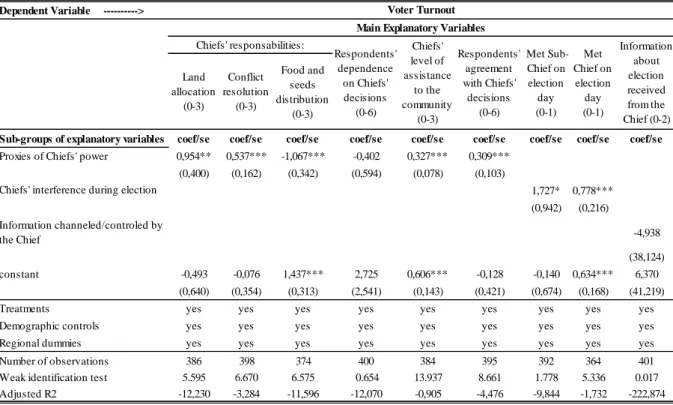
Finally, table 14 presents the effects of the main explanatory variables on self-reported turnout. Only the coefficient of the variable reporting the assistance of the Leaders to the community is simultaneously statistically significant (at the 1% level) with a score on the weak identification test higher than 10. The variables reporting the responsibility of the Leaders over the resolution of conflicts and the agreement of the respondents with their decisions are both significant at the 1% level with scores on the weak identification test of 7 and 9 respectively. The variable reporting the responsibility of the Chiefs over land allocation is significant and positive at the 5% level with a score on the weak identification test of approximately 6 while the variable reporting the responsibility of the Leaders over the distribution of food and seeds has a negative and statistically significant marginal impact as reported before (weak identification test of 7). In addition to
20
this, both variables belonging to the second group are statistically significant (at 10% and 1% levels) with scores of 2 and 5 on the weak identification test. Regarding the effects on the official turnout at the location level no statistically significant impact was found. Due to the restrictions of space, the respective table is not presented in this document. The pattern of large marginal impacts noted before is also verified in this case. To conclude, it is clear that the instrument works much better with the self-reported outcome variables than with the official results at the location level. The main reasons seem to be the reduced sample of the second group of estimations and the problem of representativeness of the sample as mentioned before. In addition to this, the results are undoubtedly better for the first group of variables including direct proxies of the power of the Traditional Leaders. This was to be expected, the concept of the instrument was to explain the current levels of power and participation of the Leaders, not their interference during the election day or the information they control even though interconnected. Among the 6 variables of the first group the variable reporting the level of assistance of the Leaders to their communities has the most reliable results with statistically significant coefficients at the 5% level or higher and scores on the weak identification test consistently above 10% on the regressions with self-reported outcome variables. At a lower level, the variables reporting the agreement of the respondents with the Leaders’ decisions and the responsibilities of the Leaders over the allocation of land and resolution of conflicts present reasonable results with scores bellow 10 on the weak identification test but still rather high. The variable indicating the responsibility of the Chiefs over the distribution of food and seeds presents an odd result with consistent negative statistically significant marginal impacts across the specifications featuring the self-reported outcomes. It is difficult to conciliate this result with intuition, in particular when compared with the other variables of the same group and with the results obtained with the OLS estimation method. All in all, even if the size of the marginal effects presented in this section seems disproportionate, the results presented certainly point to a likely causal relation when taken together with the results of the previous section.
21
7. Concluding Remarks
This work had the purpose of assessing whether the Traditional Authorities had any influence on the voting behavior of rural communities in Mozambique and to quantify this relation. The results presented point to a positive correlation between their power, measured through a wide range of indicators, turnout and the vote share of the incumbent, Frelimo. However, given the large difference between the size of the effects determined through the two estimation methods employed here, it is difficult to take any conclusions on the true magnitude of this influence. Nonetheless, we can reasonably conclude that Traditional Leaders have some power over the electoral results of their communities.
The data available for this study only allowed me to demonstrate a positive correlation between the power of the Traditional Authorities and the electoral results of the incumbent. However, this does not imply that this pattern is not verified for the challengers as well. To better understand this phenomenon, a broader database representative of the Mozambican political spectrum would be necessary. Moreover, the instrumental variable approach used in this work does not allow us to establish an irrefutable causal relation. An experimental approach is perhaps the only way to circumvent the problem.
The power the Traditional Leaders hold make them very liable of being corrupted or manipulated to influence electoral results in one way or the other. In the future, policy should seek to increase their independence from political actors and at the same time to increase their accountability towards the communities they represent. In this way, we might guarantee that these entities only use their power and influence in the best interest of the ones they stand for.
References
Acemoglu, Daron, S. Johnson, J. A. Robinson. 2001. “The Colonial Origins of Comparative Development: An Empirical Investigation.” American Economic Review, 91(5): 1369-1401;
Aker, Jenny C., P. Collier and Pedro C. Vicente. 2011. “Is Information Power? Using Cell Phones during an Election in Mozambique.” http://www.pedrovicente.org/cell.pdf;
Baldwin, Kate. 2012. “Why Vote with the Chief? Political Connections and Public Goods Provision in Zambia.” American Journal of Political Science, forthcoming;
Banerjee, A. V., S. Kumar, R. Pande and F. Su. 2011. “Do Informed Voters Make Better Choices? Experimental Evidence from Urban India.” http://www.hks.harvard.edu/fs/rpande/papers/DoInformedVoters_Nov11.pdf;
22
Variable Mean Std. Dev. Min Max
male 0,451 0,498 0 1 age 37,596 13,584 15 88 school (0-9) 2,448 1,721 0 8 job 0,251 0,434 0 1 expenditure 128,722 163,958 0 2380,952 catholic 0,361 0,480 0 1 protestant 0,352 0,478 0 1 muslim 0,222 0,416 0 1 chang 0,359 0,480 0 1 macua 0,215 0,411 0 1 lomue 0,095 0,294 0 1 chuabo 0,096 0,295 0 1 admnistrative post 0,117 0,321 0 1 police station 0,490 0,500 0 1 water supply 0,293 0,455 0 1 health center 0,648 0,478 0 1 electricity supply 0,557 0,497 0 1 sewage 0,185 0,388 0 1 recreation 0,750 0,433 0 1 temple 0,929 0,257 0 1 meetroom 0,342 0,475 0 1 market 0,784 0,412 0 1 internet 0,071 0,257 0 1 police 0,242 0,428 0 1 Enumeration Area Characteristics Ethnicity Religion Basic Demographics
Table 1: Descriptive Statistics - Demographics and Location Characteristics
Mean Std. Dev. Min Max
0,913 0,281 0 1 0,853 0,354 0 1 0,846 0,361 0 1 0,469 0,135 0,225 1 0,469 0,132 0,225 1 0,814 0,162 0,194 1 0,805 0,162 0,071 0,996 Land allocation (0-3) 1,107 1,115 0 3 Conflict resolution (0-3) 1,866 0,922 0 3 Food and seeds distribution (0-3) 0,521 0,894 0 3 2,202 2,401 0 6 0,996 0,935 0 3 3,376 1,850 0 7 0,509 0,500 0 1 0,382 0,486 0 1 0,680 0,854 0 2 Turnout Frelimo Guebusa
Table2: Descriptive Statistics - Outcomes and Main Explanatory Variables
Frelimo Guebuza Chiefs' responsabilities Electoral Results per Location (percentage) Main Explanatory Variables
Turnout Parliament Elections Turnout Presidential Elections
Respondents' dependence on Chiefs' decisions (0-6) Chiefs' level of assistance to
the community (0-3) Respondents' agreement with
Chiefs' decisions (0-6) Met Sub-Chief on election day
(0-1)
Met Chief on election day (0-1) Information about election received from the Chief (0-2)
Self-Reported Outcomes
(0-1)
Variable
Bellows, John and E. Miguel. 2009. “War and Local Collective Action in Sierra Leone.” Journal of Public Economics, 93(11-12): 1144-1157;
Blattman, Christopher. 2009. “From Violence to Voting: War and Political Participation in Uganda.” American Political Science Review, 103(2): 231-247;
Eifert, Ben, E. Miguel and D. N. Posner. 2010. “Political Competition and Ethnic Identification in Africa” American Journal of Political Science, 54(2): 494–510;
Fafchamps, Marcel, A. Vaz and P. C. Vicente. 2012. “Voting and Peer Effects: Experimental Evidence from Mozambique.” http://users.ox.ac.uk/~econ0087/moznet.pdf;
Fafchamps, M., and P. C. Vicente. 2009. “Political Violence and Social Networks: Experimental Evidence from a Nigerian Election.” Journal of Development Economics, forthcoming;
Gine, X., and G. Mansuri 2011. “Together we will : experimental evidence on female voting behavior in Pakistan.” World Bank, Policy Research Working Paper 5692.
Mattes, Robert, C. Shenga. 2007. “Uncritical Citizenship in a Low-Information Society: Mozambicans in Comparative Perspective.” Afrobarometer, Working Paper 91;
Nickerson, D. W. 2008. “Is Voting Contagious? Evidence from Two Field Experiments,” American Political Science Review, 102(1): 49-57;
Posner, Daniel N. 2004. “The Political Salience of Cultural Difference: Why Chewas and Tumbukas are Allies in Zambia and Adversaries in Malawi.” American Political Science Review, 98(4): 529-545;
Vicente, Pedro C. 2010. “Is Vote-buying Effective? Evidence from a Field Experiment in West Africa.” Forthcoming Economic Journal;
Wantchekon, Leonard. 2003. “Clientelism and Voting Behavior: Evidence from a Field Experiment in Benin.” World Politics, 55: 399-422;
West, Harry G. and S. Kloeck-Jenson. 1999. “Traditional Authority and Democratic Decentralization in Post-War Mozambique.” African Affairs, 98(393): 455-484.
23 Dependent Variable ---> Land allocation (0-3) Conflict resolution (0-3) Food and seeds distribution (0-3)
Sub-groups of explanatory variables coef/se coef/se coef/se coef/se coef/se coef/se coef/se coef/se coef/se
Proxies of Chiefs' power 0,004 -0,001 0,006 0,011** 0,009 0,001
(0,009) (0,009) (0,009) (0,004) (0,009) (0,004) Chiefs' interference during election
day 0,052*** 0,050*** (0,017) (0,016) Information channeled/controled by the Chief 0,021* (0,011) constant 0,862*** 0,866*** 0,876*** 0,818*** 0,868*** 0,862*** 0,874*** 0,850*** 0,849*** (0,060) (0,062) (0,057) (0,063) (0,059) (0,063) (0,057) (0,059) (0,061)
Treatments yes yes yes yes yes yes yes yes yes
Demographic controls yes yes yes yes yes yes yes yes yes
Regional dummies yes yes yes yes yes yes yes yes yes
Number of observations 1.006 1.040 973 1.054 996 1.034 1.022 935 1.053
Adjusted R2 0,018 0,019 0,022 0,021 0,012 0,017 0,034 0,028 0,020
Note: All regressions are OLS. The dependent variable is a dummy (0-1) reported by the respondents. Explanatory variables are perception variables reported by the respondents as well. Demographic controls include age, gender, years of education, employment status, household monthly expenditure, religion and ethnicity dummies. Treatments include the variables civic education, newspaper and hotline controlling for the treatments conducted for Aker, Collier and Vicente (2011). Standard errors reported; these are corrected by clustering at the location (enumeration area) level.*** p<0.01, ** p<0.05, * p<0.1
Table3: Self-Reported Turnout Voter Turnout Main Explanatory Variables
Chiefs' responsibilities: Respondents' dependence on Chiefs' decisions (0-6) Chiefs' level of assistance to the community (0-3) Respondents' agreement with Chiefs' decisions (0-6) Met Sub-Chief on election day (0-1) Met Chief on election day (0-1) Information about election received from the Chief (0-2) Dependent Variable ---> Land allocation (0-3) Conflict resolution (0-3) Food and seeds distribution (0-3)
Sub-groups of explanatory variables coef/se coef/se coef/se coef/se coef/se coef/se coef/se coef/se coef/se
Proxies of Chiefs' power 0,045* 0,003 0,055* -0,013 -0,019 0,013
(0,026) (0,025) (0,032) (0,014) (0,021) (0,015) Chiefs' interference during election
day 0,006 -0,024 (0,061) (0,046) Information channeled/controled by the Chief 0,129*** (0,042) constant 0,496*** 0,542*** 0,517*** 0,655*** 0,598*** 0,436* 0,542*** 0,570*** 0,470*** (0,181) (0,189) (0,179) (0,206) (0,195) (0,232) (0,191) (0,188) (0,173)
Treatments yes yes yes yes yes yes yes yes yes
Demographic controls yes yes yes yes yes yes yes yes yes
E.A. Controls yes yes yes yes yes yes yes yes yes
Regional dummies yes yes yes yes yes yes yes yes yes
Number of observations 127 127 127 127 127 127 127 127 127
Adjusted R2 0,505 0,489 0,507 0,495 0,491 0,492 0,489 0,490 0,545
Note: All regressions are OLS. The dependent variable is the voter turnout of the national parliament election in percentage of total voters per ballot station (enumeration area). Explanatory variables are averages of perception variables per enumeration area. Demographic controls include age, gender, years of education, employment status, household monthly expenditure, religion and ethnicity dummies. Treatments include the variables civic education, newspaper and hotline controlling for the treatments conducted for Aker, Collier and Vicente (2011). EA controls include enumeration area characteristics namely the existence of an admnistrative post, police station, water supply, health center, electricity, sewage, recreation center, temples, meetrooms, markets, internet, army bases and roads. Robust standard errors reported.*** p<0.01, ** p<0.05, * p<0.1
Table 4: Turnout - Parliament Election (Location)
Voter Turnout - Parliament Election
Main Explanatory Variables (averages per enumeration area)
Chiefs' responsibilities: Respondents' dependence on Chiefs' decisions (0-6) Chiefs' level of assistance to the community (0-3) Respondents' agreement with Chiefs' decisions (0-6) Met Sub-Chief on election day (0-1) Met Chief on election day (0-1) Information about election received from the Chief (0-2)
24 Dependent Variable ---> Land allocation (0-3) Conflict resolution (0-3) Food and seeds distribution (0-3)
Sub-groups of explanatory variables coef/se coef/se coef/se coef/se coef/se coef/se coef/se coef/se coef/se
Proxies of Chiefs' power 0,039 0,013 0,058* -0,020* -0,030 0,014
(0,026) (0,024) (0,031) (0,012) (0,021) (0,015) Chiefs' interference during election
day 0,009 -0,020 (0,061) (0,045) Information channeled/controled by the Chief 0,122*** (0,041) constant 0,468*** 0,490*** 0,480*** 0,682*** 0,592*** 0,386* 0,504*** 0,531*** 0,439*** (0,174) (0,181) (0,171) (0,196) (0,186) (0,222) (0,183) (0,181) (0,166)
Treatments yes yes yes yes yes yes yes yes yes
Demographic controls yes yes yes yes yes yes yes yes yes
E.A. Controls yes yes yes yes yes yes yes yes yes
Regional dummies yes yes yes yes yes yes yes yes yes
Number of observations 127 127 127 127 127 127 127 127 127
Adjusted R2 0,519 0,507 0,527 0,522 0,513 0,510 0,506 0,507 0,559
Note: All regressions are OLS. The dependent variable is the voter turnout for the presidential election in percentage of total voters per ballot station (enumeration area). Explanatory variables are averages of perception variables per enumeration area. Demographic controls include age, gender, years of education, employment status, household monthly expenditure, religion and ethnicity dummies. Treatments include the variables civic education, newspaper and hotline controlling for the treatments conducted for Aker, Collier and Vicente (2011). EA controls include enumeration area characteristics namely the existence of an admnistrative post, police station, water supply, health center, electricity, sewage, recreation center, temples, meetrooms, markets, internet, army bases and roads. Robust standard errors reported.*** p<0.01, ** p<0.05, * p<0.1
Table 5: Turnout - Presidential Election (location)
Voter Turnout - Presidential Election
Main Explanatory Variables (averages per enumeration area)
Chiefs' responsibilities: Respondents' dependence on Chiefs' decisions (0-6) Chiefs' level of assistance to the community (0-3) Respondents' agreement with Chiefs' decisions (0-6) Met Sub-Chief on election day (0-1) Met Chief on election day (0-1) Information about election received from the Chief (0-2) Dependent Variable ---> Land allocation (0-3) Conflict resolution (0-3) Food and seeds distribution (0-3)
Sub-groups of explanatory variables coef/se coef/se coef/se coef/se coef/se coef/se coef/se coef/se coef/se
Proxies of Chiefs' power 0,007 0,008 0,028** 0,021*** 0,016 -0,005 (0,011) (0,013) (0,012) (0,005) (0,013) (0,006) Chiefs' interference during election
day 0,066*** 0,052** (0,021) (0,022) Information channeled/controled by the Chief 0,023* (0,014) constant 0,794*** 0,787*** 0,808*** 0,743*** 0,794*** 0,822*** 0,782*** 0,763*** 0,785*** (0,082) (0,084) (0,082) (0,079) (0,083) (0,082) (0,081) (0,084) (0,082)
Treatments yes yes yes yes yes yes yes yes yes
Demographic controls yes yes yes yes yes yes yes yes yes
Regional dummies yes yes yes yes yes yes yes yes yes
Number of observations 942 973 914 983 933 968 948 874 981
Adjusted R2 0,029 0,027 0,032 0,042 0,026 0,028 0,046 0,041 0,029
Note: All regressions are OLS. The dependent variable is a dummy (0-1) reported by the respondents. Explanatory variables are perception variables reported by the respondents as well. Demographic controls include age, gender, years of education, employment status, household monthly expenditure, religion and ethnicity dummies. Treatments include the variables civic education, newspaper and hotline controlling for the treatments conducted for Aker, Collier and Vicente (2011). Standard errors reported; these are corrected by clustering at the location (enumeration area) level.*** p<0.01, ** p<0.05, * p<0.1
Table 6: Vote for Frelimo - Self-Reported Vote for Frelimo Main Explanatory Variables
Chiefs' responsabilities: Respondents' dependence on Chiefs' decisions (0-6) Chiefs' level of assistance to the community (0-3) Respondents' agreement with Chiefs' decisions (0-6) Met Sub-Chief on election day (0-1) Met Chief on election day (0-1) Information about election received from the Chief (0-2)
25 Dependent Variable ---> Land allocation (0-3) Conflict resolution (0-3) Food and seeds distribution (0-3)
Sub-groups of explanatory variables coef/se coef/se coef/se coef/se coef/se coef/se coef/se coef/se coef/se
Proxies of Chiefs' power -0,000 0,034 0,019 0,016* 0,012 0,040*** (0,017) (0,025) (0,020) (0,009) (0,017) (0,013) Chiefs' interference during election
day 0,003 0,037 (0,055) (0,046) Information channeled/controled by the Chief 0,028 (0,031) constant 0,712*** 0,655*** 0,701*** 0,577*** 0,681*** 0,367** 0,709*** 0,678*** 0,695*** (0,145) (0,148) (0,143) (0,162) (0,154) (0,175) (0,151) (0,148) (0,144)
Treatments yes yes yes yes yes yes yes yes yes
Demographic controls yes yes yes yes yes yes yes yes yes
E.A. Controls yes yes yes yes yes yes yes yes yes
Regional dummies yes yes yes yes yes yes yes yes yes
Number of observations 127 127 127 127 127 127 127 127 127
Adjusted R2 0,735 0,740 0,737 0,743 0,736 0,761 0,735 0,737 0,737
Note: All regressions are OLS. The dependent variable is the share of votes of Guebuza per ballot station (enumeration area). Explanatory variables are averages of perception variables per enumeration area. Demographic controls include age, gender, years of education, employment status, household monthly expenditure, religion and ethnicity dummies. Treatments include the variables civic education, newspaper and hotline controlling for the treatments conducted for Aker, Collier and Vicente (2011). EA controls include enumeration area characteristics namely the existence of an admnistrative post, police station, water supply, health center, electricity, sewage, recreation center, temples, meetrooms, markets, internet, army bases and roads. Robust standard errors reported.*** p<0.01, ** p<0.05, * p<0.1
Table 7: Vote for Frelimo (Location) Vote for Frelimo
Main Explanatory Variables (averages per enumeration area)
Chiefs' responsabilities: Respondents' dependence on Chiefs' decisions (0-6) Chiefs' level of assistance to the community (0-3) Respondents' agreement with Chiefs' decisions (0-6) Met Sub-Chief on election day (0-1) Met Chief on election day (0-1) Information about election received from the Chief (0-2) Dependent Variable ---> Land allocation (0-3) Conflict resolution (0-3) Food and seeds distribution (0-3)
Sub-groups of explanatory variables coef/se coef/se coef/se coef/se coef/se coef/se coef/se coef/se coef/se
Proxies of Chiefs' power 0,012 0,022 0,026** 0,026*** 0,029** -0,000 (0,010) (0,014) (0,013) (0,005) (0,013) (0,006) Chiefs' interference during election
day 0,078*** 0,057*** (0,021) (0,021) Information channeled/controled by the Chief 0,031** (0,014) constant 0,824*** 0,798*** 0,827*** 0,761*** 0,820*** 0,843*** 0,813*** 0,804*** 0,815*** (0,084) (0,087) (0,087) (0,083) (0,086) (0,086) (0,083) (0,089) (0,085)
Treatments yes yes yes yes yes yes yes yes yes
Demographic controls yes yes yes yes yes yes yes yes yes
Regional dummies yes yes yes yes yes yes yes yes yes
Number of observations 929 961 901 969 923 955 935 864 967
Adjusted R2 0,037 0,036 0,033 0,057 0,035 0,035 0,063 0,046 0,039
Note: All regressions are OLS. The dependent variable is a dummy (0-1) reported by the respondents. Explanatory variables are perception variables reported by the respondents as well. Demographic controls include age, gender, years of education, employment status, household monthly expenditure, religion and ethnicity dummies. Treatments include the variables civic education, newspaper and hotline controlling for the treatments conducted for Aker, Collier and Vicente (2011). Standard errors reported; these are corrected by clustering at the location (enumeration area) level.*** p<0.01, ** p<0.05, * p<0.1
Table 8: Vote for Guebuza - Self-Reported Vote for Guebuza Main Explanatory Variables
Chiefs' responsabilities: Respondents' dependence on Chiefs' decisions (0-6) Chiefs' level of assistance to the community (0-3) Respondents' agreement with Chiefs' decisions (0-6) Met Sub-Chief on election day (0-1) Met Chief on election day (0-1) Information about election received from the Chief (0-2)
26 Dependent Variable ---> Land allocation (0-3) Conflict resolution (0-3) Food and seeds distribution (0-3)
Sub-groups of explanatory variables coef/se coef/se coef/se coef/se coef/se coef/se coef/se coef/se coef/se
Proxies of Chiefs' power 0,005 0,040 0,017 0,017* 0,018 0,042***
(0,017) (0,027) (0,020) (0,009) (0,018) (0,013) Chiefs' interference during election
day 0,001 0,039 (0,048) (0,047) Information channeled/controled by the Chief 0,015 (0,028) constant 0,752*** 0,692*** 0,749*** 0,616*** 0,710*** 0,395** 0,757*** 0,722*** 0,749*** (0,144) (0,146) (0,142) (0,160) (0,153) (0,172) (0,150) (0,147) (0,143)
Treatments yes yes yes yes yes yes yes yes yes
Demographic controls yes yes yes yes yes yes yes yes yes
E.A. Controls yes yes yes yes yes yes yes yes yes
Regional dummies yes yes yes yes yes yes yes yes yes
Number of observations 127 127 127 127 127 127 127 127 127
Adjusted R2 0,730 0,738 0,732 0,739 0,732 0,760 0,730 0,733 0,731
Note: All regressions are OLS. The dependent variable is the share of votes of Guebuza per ballot station (enumeration area). Explanatory variables are averages of perception variables per enumeration area. Demographic controls include age, gender, years of education, employment status, household monthly expenditure, religion and ethnicity dummies. Treatments include the variables civic education, newspaper and hotline controlling for the treatments conducted for Aker, Collier and Vicente (2011). EA controls include enumeration area characteristics namely the existence of an admnistrative post, police station, water supply, health center, electricity, sewage, recreation center, temples, meetrooms, markets, internet, army bases and roads. Robust standard errors reported.*** p<0.01, ** p<0.05, * p<0.1
Table 9: Vote for Guebuza (Location) Vote for Guebuza
Main Explanatory Variables (averages per enumeration area)
Chiefs' responsabilities: Respondents' dependence on Chiefs' decisions (0-6) Chiefs' level of assistance to the community (0-3) Respondents' agreement with Chiefs' decisions (0-6) Met Sub-Chief on election day (0-1) Met Chief on election day (0-1) Information about election received from the Chief (0-2) Dependent Variable ---> Land allocation (0-3) Conflict resolution (0-3) Food and seeds distribution (0-3)
Sub-groups of explanatory variables coef/se coef/se coef/se coef/se coef/se coef/se coef/se coef/se coef/se
Proxies of Chiefs' power 0,759* 0,755*** -1,429** -0,657 0,446** 0,472*** (0,448) (0,206) (0,579) (1,250) (0,180) (0,179) Chiefs' interference during election
day 4,196 1,055*** (4,245) (0,300) Information channeled/controled by the Chief 4,361 (14,499) constant -0,162 -0,370 1,536*** 4,245 0,442 -0,650 -1,729 0,572** -3,280 (0,714) (0,458) (0,408) (5,971) (0,284) (0,736) (2,733) (0,257) (14,522)
Treatments yes yes yes yes yes yes yes yes yes
Demographic controls yes yes yes yes yes yes yes yes yes
Regional dummies yes yes yes yes yes yes yes yes yes
Number of observations 363 376 354 377 363 373 369 343 378
Weak identification test 14.173 5.272 6.991 0.454 17.301 8.040 0.464 3.441 0.065
Adjusted R2 -5,021 -3,925 -12,632 -21,029 -1,129 -6,351 -36,088 -2,001 -103,667
Note: All regressions are 2SLS. Turnout is a dummy (0-1) reported by the respondents. Explanatory variables are instrumented with a variable which tell us whether the individual with highest social capital per enumeration area had relatives killed by Renamo during the civil war. Demographic controls include age, gender, years of education, employment status, household monthly expenditure, religion and ethnicity dummies . Treatments include the variables civic education, newspaper and hotline controlling for the treatments conducted for Aker, Collier and Vicente (2011). Standard errors reported; these are corrected by clustering at the location (enumeration area) level.*** p<0.01, ** p<0.05, * p<0.1
Table 10: Vote for Frelimo - Self-Reported (2SLS) Vote for Frelimo Main Explanatory Variables
Chiefs' responsabilities: Respondents' dependence on Chiefs' decisions (0-6) Chiefs' level of assistance to the community (0-3) Respondents' agreement with Chiefs' decisions (0-6) Met Sub-Chief on election day (0-1) Met Chief on election day (0-1) Information about election received from the Chief (0-2)