Universidade de Aveiro 2008
Departamento de Engenharia Mecânica
Fábio Jorge Pereira
Simões
Estudo da laminagem assimétrica na liga de
alumínio 1050
Universidade de Aveiro 2008
Departamento de Engenharia Mecânica
Fábio Jorge Pereira
Simões
Estudo da laminagem assimétrica na liga de
alumínio 1050
Asymmetrical rolling of an aluminum alloy 1050
Dissertação apresentada à Universidade de Aveiro para cumprimento dos requisitos necessários à obtenção do grau de Doutor em Engenharia Mecânica, realizada sob a orientação científica do Professor José Joaquim de Almeida Grácio, Professor Catedrático do Departamento de Engenharia Mecânica da Universidade de Aveiro, e do Professor José Manuel Ferreira Duarte, Professor Auxiliar do Departamento de Engenharia Mecânica e Gestão Industrial da Faculdade de Engenharia da Universidade do Porto. Dissertation submitted to the University of Aveiro, Portugal, as the fulfillment of the necessary requirements for obtaining the PhD degree in Mechanical Engineering, and carried out under the supervision of Professor José Joaquim de Almeida Grácio, full professor of the Mechanical Engineering Department of the University of Aveiro, and professor José Manuel Ferreira Duarte, auxiliary professor of the Mechanical Engineering and Industrial Management Department of the Faculty of Engineering of the University of Porto.Bolsa de Doutoramento concedida pela Fundação para a Ciência e a Tecnologia (FCT), referência POSI/SFRH/BD/12649/2003
o júri
presidente
Reitora da universidade de AveiroDoutor Frédéric Gérard Barlat
Full Professor, Pohang University of Science and Technology (POSTECH), South Korea; Professor Catedrático Convidado da Universidade de Aveiro
Doutor Edgar Fernand Rauch
Investigador – Coordenador do Laboratoire GPM2 – Saint Marie d'Héres – France.
Doutor José Joaquim de Almeida Grácio
Professor Catedrático da Universidade de Aveiro.
Doutor José Manuel Ferreira Duarte,
Professor Auxiliar da Faculdade de Engenharia da Universidade do Porto.
Doutor Catalin Radu Picu
Professor Associado do Renssealaer Polytechnic Institute – Troy NY – USA.
Doutor Paulo António Firme Martins
agradecimentos
Devo agradecer, em primeiro lugar, aos Professores José Grácio e José Duarte, pela oportunidade de desenvolver este trabalho de investigação, numa área cujo impacto no quotidiano é sobejamente reconhecido. A sua disponibilidade para o planemento de estratégias e discussão de resultados contribuiu decisivamente para o progresso do trabalho. O aconselhamento na fase de escrita da tese foi, sem dúvida, uma contribuição valiosa.My thanks to Professor Frédéric Barlat, for the advices and support during the development of this work, including the chance of working at Alcoa Technical Center. This was one of the most valuable experiences I had in the last years. And also, I got the chance to see lots of snow...
Also my most sincere thanks to Doctor Jeong-Whan Yoon, who was one of the most supportive persons of this work. His friendship and suggestions were of outmost importance in critical stages of the investigation.
Aos meus colegas de investigação, Ricardo Sousa, Robertt Valente e Rui Cardoso, que me acolheram no grupo de investigação e sempre me apoiaram, quer com conselhos de ordem científica, quer com colaborações em trabalhos, mas sobretudo com um ambiente descontraído e indescritível. Desde as deslocações para a universidade, até aos almoços sempre interessantes, a boa disposição esteve sempre presente. Há coisas que não têm preço. Por isto, e para além da componente profissional, a minha passagem pelo Departamento de Engenharia Mecânica será sempre recordada com saudade.
Uma palavra especial também a duas pessoas: Gabriela Vincze, pelo apoio prestado em todo o trabalho, quer a nível de equipamentos, quer a nível de conselhos; e Prof. Francisco Queirós de Mello, pelo apoio e sugestões valiosas para a melhor prossecução dos trabalhos.
Aos professores, colegas de investigação e funcionários do Departmento de Engenharia Mecânica, um agradecimento sincero por me terem acolhido e integrado. Um ambiente de trabalho como este não é algo comum.
Agradeço também aos meus pais e à minha irmã, pelo apoio incondicional em todas as situações. Também à minha avó, por sempre torcer por mim! Finalmente, o agradecimento mais significativo vai, sem dúvida, para a minha esposa, Diana, que partilhou este longo caminho comigo e sempre me apoiou, nos bons e maus momentos. Só nós sabemos as dificuldades que passámos, mas agora podemos olhar o futuro com outros olhos.
palavras - chave
ligas de alumínio, laminagem assimétrica, comportamento mecânico, textura cristalográficaresumo
A investigação centrada na optimização do comportamento mecânico eformabilidade de chapas metálicas tem conhecido desenvolvimentos importantes ao longo dos últimos anos. A tendência de redução de peso dos componentes conformados, principalmente no que se refere à indústria automóvel, deve-se a questões não só de índole económica, mas também ecológica. Neste caso, um dos caminhos consiste em investigar novas ligas dentro dos aços já usados, possibilitando uma redução da espessura das chapas, mantendo ou melhorando a performance dos componentes. O caminho alternativo é o uso de outros materiais. Em alternativa ao aço, as chapas de alumínio apresentam potenciais vantagens em termos de peso e resistência à corrosão, mas a sua baixa formabilidade tem vindo a limitar o leque de aplicações.
A formabildade de chapas metálicas depende de um grande número de factores. O comportamento mecânico do material é apenas um deles. Neste trabalho pretende-se estudar o impacto da utilização de um processo alternativo para a produção de chapas, a laminagem assimétrica.
O processo de laminagem assimétrica pretende impôr tensões de corte ao longo da espessura da chapa, originando o desenvolvimento de
componentes de textura específicos, designados componentes de corte, além de promover o refinamento de grão. Tais componentes de textura, não alcançáveis pelos processos tradicionais de fabrico, são apontados como benéficos para a melhoria substancial da formabilidade das chapas de alumínio. A diminuição do tamanho de grão resulta, também, num incremento da resistência mecânica. A principal meta é então a obtenção uma combinação optimizada entre formabilidade e resistência mecânica, não alcançável com os processos tradicionais de laminagem seguida de tratamentos térmicos. Neste trabalho, chapas de alumínio 1050 são sujeitas a laminagem assimétrica e posterior tratamento térmico, com o intuito de estudar o impacto do procedimento no desenvolvimento de texturas cristalográficas conducentes a uma melhoria na formabilidade da chapa, e no refinamento do grão, com vista a optimizar a resposta mecânica. São realizados ensaios experimentais para avaliação do impacto dos diversos parâmetros da laminagem no comportamento mecânico das chapas, e discutidas estratégias de optimização do processo de laminagem assimétrica.
keywords
aluminum alloys, asymmetrical rolling, mechanical response, crystallographic textureabstract
Investigations focused on the optimization of the mechanical response andformability of sheet metal materials have experienced important
developments over the past years. The reduction in weight of formed parts, especially on automotive industry, is sought not only because of economical factors, but also because of environmental issues. Because of this, some investigations are focused on the optimization of steel sheets, enabling a decrease in sheet thickness by increasing its resistance. The purpose is to obtain lighter components and yet as resistant as before, or more. An alternative way is to use other materials, such as aluminum alloys. These present a good potential for weight reduction, as well as advantages in terms of corrosion resistance, but their lower formability has imposed serious limitations to their widespread use.
Formability of sheet metals is related to a significant number of factors. The material's mechanical response is only one of them. The purpose of this work is to evaluate the influence of an alternative process for the production of sheets, the asymmetrical rolling. The asymmetrical rolling process intends to impose intense shear deformations across the sheet thickness, leading to the development of specific texture components, named shear texture components, as well as grain refinement. These shear texture components, not generated by conventional processing routes, are pointed out as beneficial for the improvement of the sheet's formability. The grain refinement will also improve the sheet's mechanical response. The main purpose is to obtain an optimized combination of strength and formability, not attainable by using conventional processing routes of rolling followed by annealing. In this work, 1050-O aluminum alloy sheets are asymmetrically rolled and annealed, aiming to study the effect of the rolling parameters on the development of shear texture components for improved formability, and grain refinement for optimization of the mechanical response. Mechanical tests are carried out, as a way to evaluate the effect of the asymmetrical rolling parameters on the sheets response. As closure, the results are discussed and optimization strategies for the asymmetrical rolling process are approached.
Table of Contents
Chapter 1 -Introduction ...23
1.1.Thesis motivation and objectives...23
1.2.Thesis organization...24
Chapter 2 -The strip rolling process...27
2.1.Introduction...27
2.2.Strip rolling analysis...27
2.2.1.Basic concepts...27
2.2.2.The friction-hill curve. Influencing parameters...29
2.2.3.Rolling power and torque...33
2.2.4.Symmetry disturbance...34
2.3.The asymmetrical rolling process ...36
Chapter 3 -State of the art...43
3.1.Conventional rolling of aluminum sheet...43
3.2.Applications of sheet aluminum alloys on formed parts...43
3.3.Formability of aluminum sheets...44
3.3.1.Strain hardening and strain rate hardening...45
3.3.2.The Portevin-Le Châtelier phenomenon...46
3.3.3.Springback ...47
3.4.Microstructural aspects related to formability...47
3.4.1.Crystallographic texture...47
3.4.1.1.Schmid law...49
3.4.1.2.Texture and mechanical properties...49
3.4.2.Grain size...52
3.4.3.Alloying elements and precipitation structure...53
3.5.Optimization of properties...56
3.5.1.Texture optimization strategies...56
3.5.2.Grain refinement strategies...57
3.5.2.1.Synthesis methods...58
3.5.2.2.Severe plastic deformation processes – SPD...59
3.6.Asymmetrical rolling...61
3.6.1.Influencing parameters...62
3.6.1.1.Roll speed ...62
3.6.1.5.Thickness reduction per pass...64
3.6.1.6.Friction ...64
3.6.1.7.Sheet rotation between passes...64
3.6.2.Literature results...64
3.7.Chapter conclusions...69
Chapter 4 -Preliminary experimental tests...71
4.1.Material and procedures...71
4.2.Tensile response of rolled and annealed specimens...72
4.2.1.Objectives ...72
4.2.2.Material and procedures...72
4.2.3.First tensile test results ...73
4.2.4.Influence of annealing time...74
4.2.5.Influence of annealing temperature...77
4.2.6.Influence of the reduction per pass...81
4.3.Chapter conclusions...90
Chapter 5 -Texture, mechanical response and microstructure...91
5.1.Effect of texture components – simulation...91
5.2.Crystallographic texture evaluation...94
5.2.1.Experimental procedure...94
5.2.2.Results...95
5.3.Mechanical testing...97
5.3.1. Influence of thickness reduction per pass...99
5.3.2.Tensile tests...105
5.3.3.Shear tests...110
5.3.3.1.Experimental procedure...110
5.3.3.2.Shear test results...112
5.3.3.3.Texture results...117
5.3.3.4.TEM observations...122
5.3.4.Influence of rolling direction reversal...122
5.4.Discussion...133
5.4.1.Shear test results...133
5.4.2.Tensile response and shear response...133
5.4.3.Asymmetrical rolling optimization strategies...133
A.1 Introduction...137
A.2 Texture representation...137
A.2.1 Crystal reference system and sample reference system...137
A.2.2 Orientations ...139
A.2.3 Stereographic projection. Pole figures...141
A.2.4 Orientation distribution function (ODF)...143
Appendix B - Aluminum alloys...147
A.3 Classification of wrought aluminum alloys...147
A.4 Temper designations of aluminum alloys ...148
Appendix C - Testing equipment...165
A.5 Rolling machine...165
A.6 Tensile test machine...165
A.7 Furnace...165
Figure 1: The rolling process and parameters. [Avitzur, 1983]...28 Figure 2: Slab analysis for determination of the equilibrium equation. [Avitzur, 1983]...29 Figure 3: The friction-hill curve in rolling. Values for pressure, front and back tension are normalized by the factor 2√3 0. [Avitzur, 1983]σ ...31 Figure 4: Influence of friction conditions on the roll pressure.[Avitzur, 1983]...32 Figure 5: Influence of thickness reduction ratio on roll pressure.[Avitzur, 1983]...32 Figure 6: Power demand as a function of the neutral point position. When friction is high enough, there is a minimum value for power, considering the neutral point position to be positive.[Avitzur, 1983]....34 Figure 7: Symmetry disturbance by friction conditions. The neutral point position is no longer
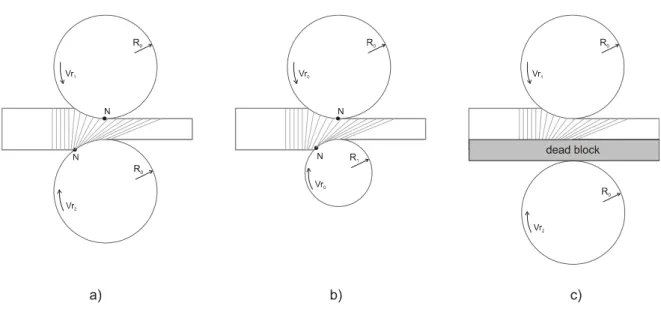
symmetric, causing shear stresses throughout the sheet thickness...35 Figure 8: Asymmetric conditions in rolling. Division of the rolling system into 2 halves. The neutral point position is no longer symmetric. The load on the rolls is substantially reduced on asymmetric rolling...36 Figure 9: Asymmetrical rolling types: a) different roll speeds; b)different roll diameters; c) using a dead block...37 Figure 10: Geometry definition at the contact zone [Salimi, 2002]...38 Figure 11: Slab analysis for asymmetrical rolling [Salimi, 2002]...39 Figure 12: Influence of roll speed ratio on total rolling force, for various thickness reduction values [Salimi, 2002]...41 Figure 13: Influence of roll speed ratio on rolling torque, for several values of reduction in thickness [Salimi, 2002]...41 Figure 14: Friction and torque balance in asymmetric rolling...42 Figure 15: Fig.1. Typical true stress–true strain curves at three temperatures within and outside the PLC range. The curves are serrated within the domain in which the SRS is negative and smooth outside. The ductility is reduced within the domain. [Picu, 2005]...46 Figure 16: Springback comparison between steel and aluminium alloys. Since aluminium alloys have on third of the elastic modulus of steels, residual elastic deformation on parts is much higher...48 Figure 17: Typical appearance of a deep drawn cup with ears under 0° and 90° to the rolling direction (marked; AA1200-O). [Engler, 2007]...50 Figure 18: Comparison of r-value directionality predicted by the Taylor (full constraints) and the VPSC models for six texture components. (a) Isotropic; (b) Copper; (c) Brass; (d) S; (e) Cube; (f) Goss. See [Choi et al, 2000] for further details...51 Figure 19: Stages in the drawing and ironing of a beverage can. [alummater, 2007-2]...53
over-aged (SOA) 6022 alloy (a), and corresponding isothermal aging curve at 200 °C (b). From [Gracio et al, 2004]...55 Figure 21: Tri-dimensional view and 2=45º ODF section of Euler space, showing locations of someφ orientations and fibres [Hong, Lee, 2002]...56 Figure 22: ODFs of 95% cold-rolled and recrystallized IF steel sheets. 2 values start from 0° in topφ left section and increase by 5° with moving to right section [Hong, Lee, 2002]...57 Figure 23: The equal channel angular pressing (ECAP) process...60 Figure 24: The High Pressure Torsion (HPT) process...61 Figure 25: Definition of rolling directions possible to implement in rolling. Unidirectional rolling (UD) does not impose any change in direction; TD, RD and ND impose rotations about the transverse direction, the rolling direction and the normal direction, respectively. [Lee, Lee, 2001]...65 Figure 26: r values of asymmetrically and conventionally rolled AA5052 sheets (performed at 260ºC), after different annealing treatments [Sakai et al, 2001]...67 Figure 27: Optical microstructures throughout thickness in 91.3% conventionally (a) and
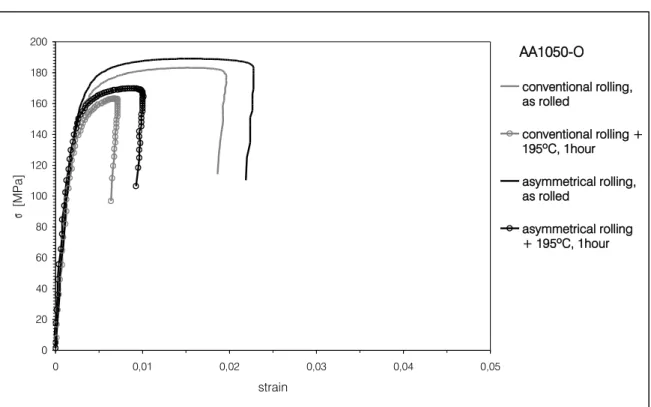
asymmetrically (b) rolled 1050 sheets annealed at 250ºC for 4hours [Cui, Ohori, 2000]...68 Figure 28: Monotonic tensile tests of the AA1050 8mm thick sheet after heat treatment at 343ºC for 1 hour. Rolling direction (RD), Transverse direction (TD) and 45º from rolling direction. ...72 Figure 29: TD tensile test results. Conventional and asymmetrically rolled specimens. As rolled condition and after annealing at 195ºC for 1 hour. ...74 Figure 30: TD tensile tests of rolled and rolled + annealed specimens. Conventional rolling up to 0.5 and 1.2 thickness strain. Annealing treatments performed at 195ºC for 1 hour / 3 hours...75 Figure 31: TD tensile tests of rolled and rolled + annealed specimens. Asymmetrical rolling up to 0.5 and 1.2 thickness strain. Annealing treatments performed at 195ºC for 1 hour / 3 hours...76 Figure 32: Ultimate tensile strength for specimens rolled and annealed for 3 hours. Conventional and asymmetrical rolling. Thickness strain from 1.6 to 2.6. Annealing temperatures :225ºC, 250ºC, 265ºC and 275ºC...78 Figure 33: Uniform strain for specimens rolled and annealed for 3 hours. Conventional and
asymmetrical rolling. Thickness strain from 1.6 to 2.6. Annealing temperatures :225ºC, 250ºC, 265ºC and 275ºC...79 Figure 34: Thickness reduction per pass used on asymmetrical rolling experiments. Comparison among Kim and Lee experiments [1999] and current experiments...80 Figure 35: Influence of thickness reduction per pass (RPP) on shear strain distribution through thickness...81 Figure 36: TD tensile tests of rolled and annealed specimens. ASR specimens rolled with 20% RPP (high RPP); CR specimens rolled with 0.2mm RPP (low RPP). Total thickness strain approximately 2.5 for all specimens. Annealing times: 1/2/3 hours...84 Figure 37: TD tensile tests of rolled and annealed specimens 265ºC, 2h. Comparison between low and high RPP values. Total thickness strain approximately 2.5 for all specimens...85 Figure 38: Tensile tests of asymmetrically rolled and annealed specimens at 265ºC for 2h.
Comparison between RD, 45º and TD testing directions. High RPP values. Total thickness strain approximately 2.5 for all specimens...86
for all specimens...87
Figure 40: Tensile tests of asymmetrically rolled and annealed specimens at 265ºC for 3h. Comparison between RD, 45º and TD testing directions. High RPP values. Total thickness strain approximately 2.5 for all specimens...88
Figure 41: Tensile tests of conventionally rolled and annealed specimens at 265ºC for 3h. Comparison between RD, 45º and TD testing directions. High RPP values. Total thickness strain approximately 2.5 for all specimens...89
Figure 42: Representation of shear texture orientations (with an orientation spread of +/-15º on a {111} pole figure...93
Figure 43: Tensile test simulation using grains having a +/- 15º spread around ideal orientations...93
Figure 44: Shear test simulation using grains having a +/- 15º spread around ideal orientations...94
Figure 45: {111} Experimental pole figures for crystallographic texture evaluation experiments...96
Figure 46: Experimental 111 pole figures obtained by Kim [Kim, Lee, 2001], for asymmetrically rolled specimens by schedules 1 (a), 2(b) and 3(c). Total reduction was 80%...97
Figure 47: 2=0º and 2=45º ODF sections, showing the main texture components for fcc metals.φ φ 98 Figure 48: Flowchart of the experimental procedures...98
Figure 49: RD tensile test of specimens asymmetrically rolled (10%RPP) and annealed at 250ºC for 4 hours. 2=0º and 2=45º ODF sections for texture evaluation.φ φ ...101
Figure 50: RD tensile test of specimens asymmetrically rolled (30%RPP) and annealed at 250ºC for 4 hours. 2=0º and 2=45º ODF sections for texture evaluation.φ φ ...102
Figure 51: RD tensile test of specimens asymmetrically rolled (40%RPP) and annealed at 250ºC for 4 hours. 2=0º and 2=45º ODF sections for texture evaluation.φ φ ...103
Figure 52: RD tensile tests of specimens asymmetrically rolled and annealed at 250ºC for 4 hours. Comparison among 10%, 30% and 40% RPP procedures...104
Figure 53: RD tensile test of rolled specimens (50%RPP). Comparison between ASR and CR. 2=0ºφ and 2=45º ODF sections for texture evaluation.φ ...106
Figure 54: RD tensile test of rolled (50%RPP) and annealed (250ºC for 2 hours) specimens. Comparison between ASR and CR. 2=0º and 2=45º ODF sections for texture evaluation.φ φ ...107
Figure 55: RD tensile test of rolled (50%RPP) and annealed (200ºC for 4 hours) specimens. Comparison between ASR and CR. 2=0º and 2=45º ODF sections for texture evaluation.φ φ ...108
Figure 56: RD Shear test for asymmetrically and conventionally rolled specimens, as rolled. RPP values: 15% and 50%...115
Figure 57: RD Shear test for asymmetrically and conventionally rolled specimens, heat treated 250ºC, 2 hours (HT1). RPP values: 15% and 50%...116
Figure 58: RD Shear test for asymmetrically and conventionally rolled specimens, heat treated 350ºC, 1 hour (HT2)...117 Figure 59: Surface 2=0º and 2=45º ODF sections for ASR and CR specimens rolled with 15%φ φ
Figure 61: Surface 2=0º and 2=45º ODF sections for ASR and CR specimens rolled with 50%φ φ
RPP. Conditions: as rolled, HT1, HT2...121
Figure 62: Through thickness ODF's for ASR and CR specimens rolled using 50% RPP, after HT1...122
Figure 63: TEM image of an asymmetrically rolled 1050 sheet, after rolling. a) 15%RPP; b)50%RPP. ...123
Figure 64: TEM images of asymmetrically and conventionally rolled sheets. Annealing at 250ºC, 2h (HT1)...124
Figure 65: RD shear test of rolled (50%RPP) and annealed (250ºC for 2 hours) specimens. Comparison between ASR, CR and rolling reversal specimens. 2=0º and 2=45º ODF sections forφ φ texture evaluation...132
Figure 66: Definition of Euler angles 1, , 2.φ θ φ ...138
Figure 67: (100)[001] cube orientation...140
Figure 68: Stereographic (a) and (b) and equal-area projections(c) and (d)...142
Figure 69: ODF sections showing typical rolling and annealing texture components for fcc metals.. 144
Figure 70: Example of an ODF for AA1050 after rolling and annealing...145
Figure 71: Rolling machine used in the experiments...166
Table 1: r values of AA5052 sheets, after rolling and annealing [Kim, Lee, 1999]...66 Table 2: Rolling conditions for first preliminary experiments...73 Table 3: Rolling conditions for preliminary tests: influence of annealing time and thickness strain...75 Table 4: Rolling and annealing variables for conventional and asymmetrical processes. Extension of annealing time and temperature...77 Table 5: Rolling and annealing variables for conventional and asymmetrical processes. Extension of thickness reduction per rolling pass...83 Table 6: Rolling procedures used by Kim and Lee [1999, 2001]...95 Table 7: Rolling conditions for optimization of thickness reduction per pass on asymmetrical rolling..99 Table 8: Rolling and annealing parameters for the comparison of asymmetrical and conventional rolling using 50% RPP...105 Table 9: Rolling conditions for evaluation of the influence of thickness reduction per pass...110 Table 10: Rolling conditions for the reversing direction experiment...133 Table 11: Typical deformation and recrystallization texture components in fcc metals...141 Table 12: {111} pole figures of the main deformation and recrystallization texture components of fcc metals...143 Table 13: Chemical composition limits for typical wrought aluminum alloys...149 Table 14: Mechanical properties and typical applications of some aluminum alloys...164
Chapter 1 - Introduction
The importance of sheet metal forming industries in the main scope of industrial activities is nowadays not due to economic reasons only, but rather due to it's social and environmental impacts. Automotive and food packaging industries are two of the main branches of forming industries. Their growing importance lead to increased responsibility and awareness in social and, more recently, on environmental aspects. Since the beginning of the XX century, the development of the automotive industry lead the way to deep economic and social changes. Not being an initial concern, the environmental impacts of this industry first acquired importance by the oil crisis of the 1970's. From that time, increased efforts have been taken into reducing fuel consumption and gas emissions, first for economic reasons, then for environmental reasons. The reduction in weight of vehicles was identified as one of the ways to achieve this purpose. It was thus necessary to develop existing forming processes and materials. Increasing strength and reducing the thickness of sheets, while maintaining the desired formability, is the way to reduce vehicle mass while fulfilling all requirements.
1.1. Thesis motivation and objectives
The main purpose of the this work is to access the characteristics of asymmetrical rolling as an alternative mean to produce sheet metal with enhanced mechanical response. Being a derivation of the strip rolling process, already in use for many years in forming industries, asymmetrical rolling seems to have the potential to produce sheets with improved mechanical properties, namely an improved strength/formability compromise. This is especially important in the case of aluminum alloys, since their potential advantages in terms of weight reduction and corrosion resistance in vehicles are most of the times obliterated by their insufficient formability. Formability deficiency is related to a variety of reasons, ranging from springback problems to surface finish problems, but especially to their limited range of deformation before necking and consequent fracture and failure. These have been the reasons why steels are most widely used materials for the production of automotive bodies, for instance.
The main problems of aluminum alloys have been identified, as well as the majority of factors causing them. The crystallographic texture of aluminum is known to be one of the main factors controlling it's mechanical response, right after alloying. Grain size and morphology is also known to influence mechanical response. Optimizing texture, alloy content and grain structure has been the purpose of a large proportion of scientific production concerning metal forming in the last years.
Developing an alternative production method, having the potential to produce sheets with increased formability while meeting the requirements of productivity, safety and ecology is something many investigators have been seeking. As the primary sheet production method, rolling has significant impact on many of the material's properties. The type of deformation imposed leads to typical crystallographic textures, which in turn cause corresponding anisotropic response. Subsequent annealing treatments help tune textures to produce the desired formability / strength combination. But rolling followed by annealing was soon found not to be able to produce certain types of textures, found to be the best to achieve those purposes. {111}||ND texture components are produced in IF steels upon recrystallization. Given that such steels have high formability, these texture components were sought, as an attempt to increase forming limits of fcc metals as well. However, those texture components are not produced during conventional rolling, except in the sheet's surface where high friction conditions cause significant values of shear strain. This is why these texture components are designated “shear” texture components. Besides {111}||ND orientations (namely {111}<110> and {111}<112>), the {001}<110> and {112}<110> orientations are also shear texture components.
The main reason to study asymmetrical rolling is its ability to impose shear deformations on the sheet, which can promote the development of shear texture components throughout the entire sheet thickness. These texture components are said to enable an optimization of the sheet's properties [Kim, Lee, 2001]. Moreover, it is relatively easy to implement asymmetrical rolling mills to existing industrial facilities, thus minimizing costs.
1.2. Thesis organization
The thesis is divided in six chapters. After the current chapter, the thesis subjects are divided according to the following list:
• Chapter 2 describes the fundamentals of the conventional strip rolling of sheets, using an analytical approach. The main variables of the process and their influence on rolling power are analyzed. An analytical approach of the asymmetrical rolling is also proposed. The influence of the asymmetry factors is studied.
Chapter 1 -Introduction
• Chapter 4 introduces the first rolling experiments performed. The main rolling variables are tested, having the sheet's mechanical response as the output. After this chapter, it is possible to identify the main issues and difficulties regarding asymmetrical rolling, providing valuable ground for the main set of experiments on chapter 5.
• Chapter 5 presents the main set of rolling experiments and the corresponding results. Texture analysis, tensile and shear testing, and also TEM observations are used to analyze the impact of the asymmetrical rolling process on AA1050-O sheets.
• Chapter 6 presents the conclusions derived from the studies, as well as directions for future steps on the investigation regarding asymmetrical rolling.
Chapter 2 - The strip rolling process
2.1. Introduction
Strip rolling is a particular case of rolling, in which the final metal part is intended to have a much greater dimension in width relatively to its thickness. The process promotes the reduction of the initial sheet thickness without significant amount of transverse deformation.
In this chapter, the strip rolling process will be briefly analyzed. The main concern is to identify the rolling process variables, their influence on rolling power, roll separation force and roll pressure distribution. This analysis will be later extrapolated for the case of asymmetrical rolling.
2.2. Strip rolling analysis
2.2.1. Basic concepts
The working rolls pull the sheet by friction to the gap between them, and the sheet is gradually compressed, decreasing in thickness as it advances, Figure 1. Due to geometric conditions, a sheet surface point at the entry of the rolls has lower velocity than the circumferential velocity of the rolls. As it advances, the sheet is pulled by friction and compressed. After the roll gap, the sheet surface velocity is greater than the roll circumferential velocity, since the sheet deforms in length as the thickness reduces.
Ventrance
Vexit = Texit
Because of this, there is an intermediate point for which the sheet surface speed and the roll circumferential speed are equal. This is called the neutral point. Before the neutral point, the friction between the sheet surface and the rolls causes it to advance. After the neutral point, and since the velocity of the sheet is greater than the velocity of the rolls, the friction acts on the opposite direction. Thus, the balance of both sides causes the rolling process to work - Figure 1. The position of the neutral point varies with rolling conditions. When a larger reduction is imposed, the neutral point will move towards the exit side, causing an increase in friction and consequently an increase of the necessary rolling power.
The maximum achievable reduction is limited by two factors: when the rolls start to slip over the sheet because the reduction imposed causes the neutral point to move towards the exit; and when the reduction imposed causes excessive pressure on the rolls, originating bending and flattening.
For the analysis of the rolling process, the independent process variables need to be identified. The list below contains the most important:
• E – modulus of elasticity of the rolls;
Chapter 2 -The strip rolling process
• t0, tf – sheet thickness at the entrance and at the exit of the rolls – can be replaced by the
reduction ratio r=tf/t0;
• Vr – roll circumferential velocity;
• σ0 – flow strength of the sheet;
• σxf, σxb – front and back tensions applied to the sheet.
The purpose will be to access the influence of the independent process parameters on the dependent ones, such as the entrance and exit velocity of the sheet (V0, Vf ) and the position of the
neutral point. From these calculations it would be also possible to derive expressions for rolling pressure, torque and power.
2.2.2. The friction-hill curve. Influencing parameters
Using a free body equilibrium (or slab) analysis [Von Karman, 1925],[Siebel,1941], it is possible to derive the differential equations that describe the relationship between independent variables and dependent ones - Figure 2.
In order to derive the balance equation on the slab, we consider the following conditions: Figure 2: Slab analysis for determination of the equilibrium equation. [Avitzur, 1983]
• friction stress τ, acting on the slab upper and lower surfaces; • normal stress σ, acting also on the slab upper and lower borders; • horizontal stresses σx(x) and σx(x+dx), as a result of the neighbor slabs.
Writing the equilibrium equation for the slab, the differential equation that describes stresses on the sheet from the entrance to the exit is obtained. After integration, and applying the friction (Coulomb model, τ=μσ) and boundary conditions, it is then possible to derive the roll pressure distribution. Since there are many methods to solve the differential equation, an example of solution for roll pressure along the contact line between the sheet and the rolls is presented [Avitzur, 1983]:
For the exit side of the neutral point, the pressure distribution p is: p 2 /
30=[
1 2 A2− xf 2/
30]
e A −2 A21A (2)and for the entrance side of the neutral point,
p 2 /
30 =[
1 2 A21− A 0− xb 2 /
30]
eA−0− 2 A21−A (3) where A= 2
tf/R0 =tan−1[
R0/tftan
]
0=tan−1[
R0/tftan2]
(4)The previous equations are plotted on Figure 3, where the abscissa is the relative distance along the x axis, and the ordinate is the roll pressure. Constant values of roll diameter R0, rolling
reduction r = tf/t0 and friction μ were used, and several values for front and back tension (σxf, σxb) are
plotted as input parameters. Pressure and tension values are normalized relatively to yield stress by the factor 2/(√3 σ0). Note that the flow stress value is considered to be constant, which is in better
agreement with hot rolling. In the case of cold rolling, the strain hardening effect is not negligible, and thus the flow stress at the exit side would be higher than at the entrance. Also note that the lines departing from the left side of the plot correspond to equation 3 (entrance side), and the right side curves correspond to equation 2. The curves derived from identical values of front and back tension always cross, and the crossing point is the neutral point.
Chapter 2 -The strip rolling process
Observing Figure 3, it is possible to conclude that imposing increasing values of front and/or back tensions causes the roll pressure to decrease. To calculate the roll separation force, the roll pressure expressions (2, 3) can be integrated along the contact arc between the sheet and the rolls. A good approximation of the roll separation force is derived from the area under the friction- hill curve. Since an increase in either the front or back tensions causes the roll pressure to decrease, it is immediate to conclude that the roll separation force will decrease as well. Figure 3 also shows that an increase in back tension will move the neutral point toward the exit, whereas an increase in front tension will move it toward the entrance.
Figure 4 shows the influence of friction conditions on the roll pressure distribution. As friction values decrease, the roll pressures decrease as well. The neutral point moves toward the exit. When the neutral point reaches the exit, the rolls will start to skid over the sheet, and rolling becomes impossible. Because of this, there is a minimum amount of friction required for rolling to take place.
The influence of thickness reduction is shown on Figure 5. As r values increase, the contact length between the sheet and the rolls increases. This causes the total amount of friction stress to increase, having a similar effect to the increase of friction coefficient.
Figure 3: The friction-hill curve in rolling. Values for pressure, front and back tension are normalized by the factor 2√3σ0. [Avitzur, 1983]
Chapter 2 -The strip rolling process
2.2.3. Rolling power and torque
The necessary rolling power can be derived from the torque, which in turn can be found by integrating friction stresses along the contact length. These friction stresses depend on the velocity field. At the entrance side, it was seen that the velocity V0 of the sheet is smaller than the
circumferential velocity Vr of the rolls. Here, friction contact between the sheet and the rolls will be
responsible for rolling to take place. At the neutral point, sheet and roll velocities are equal. After the neutral point, the sheet's velocity Vf will be higher than Vr.
Because of this, at the exit side, friction will benefit the rolling process. The torque balance derived from the previous two zones will correspond to the necessary rolling torque. As a consequence, the torque will be greatly dependent on the position of the neutral point.
The following analysis is an upper bound approach [Avitzur, 1964], in which is the rolling torque and power are derived as a function of the neutral point position. The contact length α2 (see
Figure 1can be derived from the geometry by:
2=
tf R0
t0 tf −1 (5)In the calculations, it is assumed that this length is small. Having into account the velocity distribution along the contact length, the rolling power J can be described by the following expression, as a function of the neutral point position αn [Avitzur, 1983]:
J= 2
30VrA BCD (6) where: A=1R0 tf 2n B=ln t0 tf 1/4
tf R0
t0 tf −1xb−xf 2/
30 C=m
R0 tf[
2 tan−1
R0 tf n−tan−1
t0 tf −1]
D=mR0 tf 2−2 n (7)From this expression it is possible to plot the required power as a function of the relative neutral point position αn/α2, having the friction value m as parameter - Figure 6. It is possible to
observe that for high enough values of friction, there is a local minimum value for power, not considering negative values for the neutral point position.
2.2.4. Symmetry disturbance
The analysis presented above assumes symmetry on the rolling process. The rolls are considered to have the same rotational speed, the rolls / sheet contact zones on the upper and lower sides are considered to have the same friction conditions. Consequently, pressure distribution and neutral point position are symmetric relatively to the mid-thickness plane of the sheet. Though these assumptions provide a valuable ground for the study of rolling, it is also important to be aware of the real conditions, and how these conditions affect the predicted results.
Since the upper roll is above the sheet, and the lower roll is under it, lubrication conditions are necessarily different. This leads to different friction conditions. There may be also differences in roll speeds, or speed fluctuations, eccentricity, and surface roughness. All of these factors disturb
Figure 6: Power demand as a function of the neutral point position. When friction is high enough, there is a minimum value for power, considering the neutral point position to be positive.[Avitzur, 1983]
Chapter 2 -The strip rolling process
distribution will be affected, which in turn, will affect the rolling torque. Even though the total torque (upper roll + lower roll) is nearly constant, the difference in friction may even cause one of the rolls to oppose the rolling action (negative torque).
Given a negative torque for the lower roll, its circumferential velocity at the contact zone will be smaller than the sheet's, thus opposing the rolling operation. Thus, there will only be an opposing force at the lower roll, causing the neutral point to be displaced toward the entrance. On the upper roll, and since we consider the total torque to remain nearly constant, the torque and hence the circumferential speed will have to be higher. The upper roll will be responsible for the entire rolling effort, compensating for the negative torque on the lower roll. So, its circumferential speed will be higher than the sheet's entrance speed throughout the entire contact zone, and the neutral point will be displaced toward the exit, Figure 7. The velocity differential will cause shear stresses to appear throughout the sheet thickness.
Figure 7: Symmetry disturbance by friction conditions. The neutral point position is no longer symmetric, causing shear stresses throughout the sheet thickness.
Consider the division of the system into 2 parts, the upper and lower half - Figure 8. Shear stresses at the mid-surface (S1, S2) will have to be considered, to maintain stress compatibility. We
can then think about these shear stresses as front and back tensions applied to the lower and upper halves of the sheet, respectively. Having these conditions in mind, and since the presence of front or back tensions will decrease the roll pressure, we can reach the conclusion that asymmetrical conditions in rolling provide a decrease in the rolls separation force.
2.3. The asymmetrical rolling process
Asymmetrical conditions cause instabilities on the rolling process, since the sheet tends to curve away from the faster roll at the exit, which can cause problems when it has to enter another rolling mill afterwards. But asymmetrical conditions may also be created intentionally, in order to lower the roll separation force or modify surface finish. Using different upper and lower roll speeds or diameters, or even using a stationary roll or dead block, it is possible to impose such conditions - Figure 8: Asymmetric conditions in rolling. Division of the rolling system into 2 halves. The neutral point position is
Chapter 2 -The strip rolling process
Early analytical solutions for the asymmetrical rolling conditions were concerned about estimating its influence on rolling torque, roll separation force, and especially sheet curvature at the exit. Sachs [1947] first identified the region of cross shear, due to the fact that friction forces act on opposite directions in that zone. Johnson [1966] developed a model to predict strip curvature after asymmetrical rolling. Later studies used FEM analysis [Richelsen, 1994, 1997] in order to access the influencing factors in asymmetrical rolling.
The use of analytical methods provides a faster way to access the influence of asymmetric rolling factors (roll speed ratio, reduction per pass, friction) on the resultant sheet geometry and also on the required rolling power and roll separation force, avoiding the need to perform time-consuming FE simulations. Nevertheless, FE methods present their own advantages in terms of accuracy and flexibility.
The analysis of the asymmetrical rolling process presented here is the one used by Salimi [2002], which is derived from the slab method already used on the conventional rolling, with some modifications. He compared his analytical results with the experimental ones obtained by Hwang [1997], and a good approximation was observed. The results shown here are concerned only with rolling force and rolling torque as a function of rolling reduction, friction and roll speed ratio, despite the fact that strip curvature is the main motivation of Hwang's work.
Salimi uses the following assumptions: plane strain conditions, rolls behave as rigid bodies, and the sheet / rolls contact length is small, when compared to the circumference of the rolls. The rolls are considered to have different radii, and thus, different circumferential speeds. As seen previously,
the sheet's speed increases from the entrance to the exit of the rolls' gap, as its thickness decreases. There is a point (in fact, a small length) in the middle where the roll and sheet speeds are equal, called the neutral point. In this case, since the rolls have different speeds, the upper and lower neutral point locations are not symmetric.
The contact length is thus divided in three zones (figures 10 and 11): zone I is considered to be located from the entrance of the rolls up to the nearest neutral point. Zone II is the cross-shear zone, located between the two upper and lower neutral points. Zone III is the length between the second neutral point and the exit.
In Zone I, the sheet's speed is lower than the circumferential speed of each roll. The friction forces act forward, causing the sheet to enter the roll gap. In Zone III, since the sheet's thickness has decreased, its speed increases and becomes higher than the rolls' speeds. In this zone, friction is contrary to the sheet's movement. In Zone II, the upper roll runs slower than the upper face of the sheet (since the neutral point 1 is behind), and thus friction acts on the opposite direction of the sheet's movement.
But on the lower side, the roll speed is still higher than the sheet's speed (the neutral point 2 is still ahead). So, friction forces are forward, promoting the sheet's entrance. For this zone, friction forces act on opposite directions on the upper and lower sides of the sheet, causing shear stresses -Figure 11.
Chapter 2 -The strip rolling process
By writing the equilibrium conditions of three zones, it is possible to obtain a differential equation describing the roll pressure p as the material passes trough the roll gap. By integration, the solution of this equation can be obtained, for each zone. The general solution is [Salimi, 2002]:
p=Ax −Bln x2h0Rm− E
h0Rmtan −1 x
h0RmCi (8) where: A=Rm
m1 R12 m2 R22
0
3 B=
1−m1 2c 1 2
1−m22c22
0
3 E=Rmh0A−eRm Rm=2 R1R2R1R2 m1; m2−friction factors for roll 1 and roll 2 e=12ZoneI e=1−2ZoneII e=−1−2Zone III
(9)
Values for A, B and E are related to zones I, II and III. They will be added subscripts 1-3 for proper identification. The constant Ci is derived from the boundary conditions on each zone. This means that there will be three equations describing pressure distribution along the three zones, pI, pII and pIII, in which there will be three different C formulas, C1, C2 and C3. As a reference, those formulas are presented next.
C1=xb−B−A1lBlnl2Rmh0 E1
Rmh0arctan l
Rmh0(10) Figure 11: Slab analysis for asymmetrical rolling [Salimi, 2002].
C3=xf−B1−lnRmh0 (11) C2=A2−A3xn2E3−E2
Rmh0 arctan xn2
Rmh0 C3 (12)where, considering v1≤v2, values for A2 and E2 are:
A2=−Rm
m1 R12 −m2 R22
0
3 E2=Rmh0A2−Rme2 e2=m2−m1 0
3 (13)Formulas for C2 have the position of the neutral point xn2 as unknown. Both xn2 and xn1 could
be obtained by considering the boundary condition pI = pII at xn1. Adding the integral of roll pressure
distribution along the three zones, the total roll separation force can be obtained. The rolling torque can be calculated by integrating the friction stresses along the contact length on the upper and lower rolls, multiplied by each roll radius. Multiplying torque by the rolls angular velocities we obtain the necessary rolling power. Using this analytical approach, it is possible to plot the total rolling force and rolling torque as a function of the reduction per pass, friction conditions and roll speed ratio. Results from this model are shown next.
Figure 12 shows the influence of the roll speed ratio on the total rolling force. Analyzing the figure, it is possible to confirm that:
• the total rolling force decreases as the speed ratio increases;
• the total rolling force increases when higher reduction values are imposed.
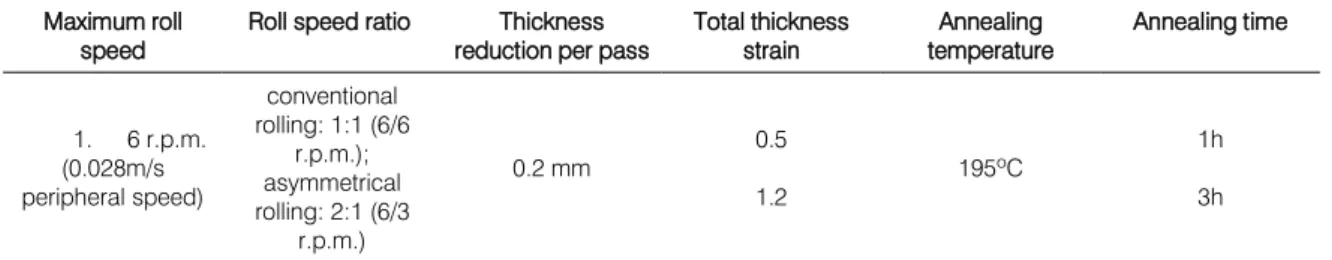
These conclusions were already predicted in the previous section. Figure 13 shows the influence of the same variables on the rolling torque. By observing the figure, it becomes clear that the rolling torque decreases as roll speed ratio increases. Reduction in thickness has the contrary effect, it causes the torque to increase significantly. This may lead to the conclusion that asymmetrical rolling is easier to perform than conventional rolling, since the rolling force and torque decrease. It should be noted, though, that if in the case of roll separation force such statement is true, in the case of rolling torque it can be deceiving.
Chapter 2 -The strip rolling process
Figure 12: Influence of roll speed ratio on total rolling force, for various thickness reduction values [Salimi, 2002].
The necessary rolling torque derives from the balance between friction stresses acting on the upper and lower rolls, Figure 14. In case of symmetric conditions, the friction stresses between the entrance and the neutral point oppose the rolls movement, whereas the friction stresses acting from the neutral point to the exit promote it. In imposed asymmetric rolling conditions, the neutral point position is different on the upper and lower rolls. If the upper roll has greater speed, its neutral point will be offset towards the exit. Similarly, on the slower roll the neutral point will be positioned towards the entrance. For this roll, the contact length in which the roll circumferential speed is higher than the sheet surface is smaller than the length in which that speed is smaller. The torque balance, in this case, is negative, and the slower roll is actually opposing the rolling action, in order to maintain its speed. This means that the upper (faster) roll will have to provide the hole rolling torque. The rolling torque decreases in asymmetrical rolling, but it will have to be supplied by one engine only.
In the beginning, the study of asymmetrical rolling was focused on its detrimental effects on sheet geometry, and rolling efficiency. But later, asymmetrical rolling was recognized as an opportunity to modify the sheets' properties, by taking advantage of the shear stresses created. Imposing shear stresses on the sheet's plane has two purposes: modification of texture and grain refinement.
Chapter 3 - State of the art
3.1. Conventional rolling of aluminum sheet
Rolling is one of the most widely used forming processes, especially because it is economic and flexible. The majority of products formed by rolling are thin sheets, whose primary consumers are the transportation (especially automotive and aerospace) and packaging industries.The origins of the rolling process go back to the 16th century, but it was only during the industrial revolution of the 18th century, with the onset of the steam machine, that large production rolling mills were first built. During the last century, and because of productivity demands, the rolling process was progressively optimized, especially because of automotive industry.
3.2. Applications of sheet aluminum alloys on formed parts
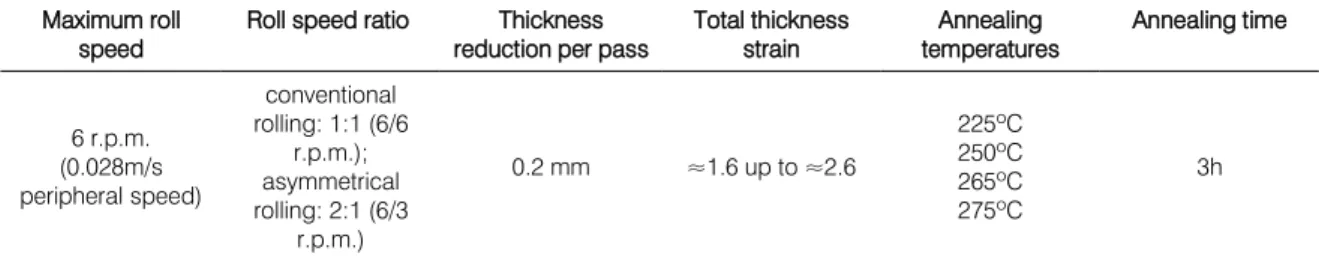
Rolled products, i.e. sheet, plate and foil constitute almost 50% of all aluminum alloys used [alumatter, 2007]. Aluminum sheets have a set of attractive properties which explains their widespread adoption in components requiring corrosion and crack resistance, high energy absorption, all combined with low density and full recycling capability. By using alloying elements and heat treatments or strain hardening, the range of achievable properties is vast. It is possible to have alloys with yield stresses ranging from 20MPa (1xxx series) to 500MPa (7xxx series) – see Appendix B. Current applications of rolled aluminum alloys include tankers, kitchenware, foil, beverage cans, automotive trim and chassis parts, airframes and even armor plates and missiles.
For the automotive industry, the use of aluminum alloys is still not significant. The majority are cast components such as cylinder heads, gear box housings and wheels. Since the 1970's, due to the oil crisis, an effort has been carried out by many car manufacturers toward the use of formed
aluminum sheets in car frames and body panels, aiming for weight reduction and thus better fuel efficiency.
3.3. Formability of aluminum sheets
Forming of aluminum sheets soon raised significant problems. The manufacture of car body panels and frames requires the sheet to have good formability and adequate strength. The term “formability” refers to a wide set of factors, ranging from intrinsic material properties to extrinsic factors such as forming conditions. In general, it is a measure of the material's ability to accommodate the strains occurring during a forming process and to produce a part that meets the requirements on mechanics, dimension and appearance [Li, Ghosh, 2004].
Extrinsic factors usually have greater influence on formability, as defined above. Despite this, only the material aspects are of concern in this work, and thus formability is considered here as the ability to deform up to high strains before failure by excessive reduction in thickness. There are several ways to access the formability of a sheet, from the simple measurement of uniform and total elongation during a tensile test, to the more complex determination of its forming limit diagrams, FLD [Keller, Backofen, 1964], [Goodwin, 1968], [Campos et al, 2006], using formability tests such as Erichsen, Swift, Nakazima, LDH (Limit Dome Heigth) and Fukui [Duarte, 1997].
Aluminum alloy sheets present reduced formability when compared to steels sheets, the traditional body panel materials. The maximum achievable strain during forming is usually higher on steels, whereas aluminum alloys tend to exhibit earlier necking and consequently, failure. Typical tensile elongation for aluminum alloys is lower than 30%, whereas for drawing steels this value is about 50%. Similar trend is observed on a plane strain condition, where aluminum fails after 25% elongation and steel strains up to 45% [Li, Ghosh, 2003].
From the set of macroscopic parameters influencing formability, two of the most important are strain hardening and strain rate hardening or strain rate sensitivity. They are in turn related to microstrucutural properties such as crystallographic structure and texture, grain size and morphology and precipitates / alloying elements. Aluminum alloys also introduced difficulties related to their low elastic modulus. This causes the part to display higher elastic deformation after unloading (springback), causing final parts to diverge from their expected dimensions, as well as difficulties on tool conception.
Chapter 3 -State of the art
3.3.1. Strain hardening and strain rate hardening
Strain hardening is the ability to increase resistance with increasing strain. For materials following the Ludwik hardening law σ=Kεn, , it is defined as:
=∂
∂ or n=
∂ln
∂ln (14)
θ is usually referred to as strain hardening rate, σ is the tension, ε is the strain and n the strain hardening index. During deformation, if a region is subjected to increased or localized strain, that region will strain harden, and hence transmit strain to the neighbor areas, which are less resistant. This way, the material is able to delay strain localization by spreading deformation, promoting more uniform thinning [Li, Ghosh, 2004].
Strain rate hardening is the ability to resist strain localization (or necking) by accommodating any strain rate changes. When the material is subjected to thinning, there will be regions where strain rate increases. If the material has positive strain rate hardening, those regions will respond with increased resistance, and thus force slower strain rate regions to sustain the deformation, delaying failure by excessive thickness reduction [Mahmudi, 1996]. On the other hand, if the material has negative strain rate sensitivity, it will tend to produce strain localization, leading to earlier failure. Strain rate hardening can be defined as:
m=∂ln
∂ln ˙ (15)
In the above equation, m is usually referred as strain rate sensitivity index and ε. is the strain
rate. This definition is useful because m is constant for materials following the Cottrell-Strokes strain rate hardening law, σ=F(ε)m, where F(ε) is a function of strain. A typical example is the Swift law.
Positive strain rate sensitivity is desirable when considering industrial processing, since the material will deform in a stable manner, delaying strain localization. When strain rate is increased, by increasing forming speed for instance, the material will respond with increased resistance and extension, thus providing improved productivity.
High values for strain rate sensitivity, ranging from 0.01 to 0.02, combined with high values for strain hardening rate can be observed on deep drawing steels, enabling them to have very good necking resistance, and hence, good formability [Shi, Meuleman, 1992]. Aluminum alloys tend to have lower strain rate sensitivity values, usually negative. Moreover, the increase in alloying elements and tempering treatments have a detrimental effect on this parameter. Other phenomena also tend to occur, as described next.
3.3.2. The Portevin-Le Châtelier phenomenon
When strain rate sensitivity is negative, the material responds to tension with strain localization phenomena, usually in significant number, leading to narrow deformation bands on the surface. The sheet's tensile curve becomes serrated, because of inhomogeneous strain distribution. Deformation bands leave traces on the sheet surface, rendering it unsuitable for many applications, due to its poor superficial quality, or causing early failure. This is the so-called Portevin-Le Chatelier, or PLC phenomenon [Hähner, 1997],[ Duarte,1997].
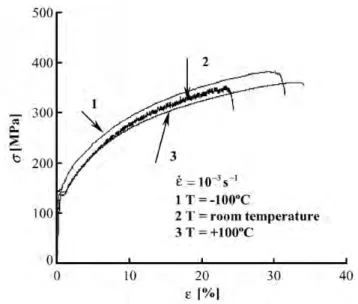
The occurrence of PLC is a consequence of the interaction between solute atoms on the structure and dislocations [Picu et al, 2005], designated by dynamic strain aging, or DSA. It is known to be dependent on temperature and strain rate, as well as solute distribution [Picu et al, 2006] and grain size. It can be observed on many types of materials, including aluminum, copper and nickel alloys, steels and even h.c.p. materials such as zinc, as long as there are solute atoms to interact with dislocations.
The PLC phenomenon can be minimized, and even eliminated by imposing the right conditions of temperature and strain rate. It has been found that there is a window of temperature and
Figure 15: Fig.1. Typical true stress–true strain curves at three temperatures within and outside the PLC range. The curves are serrated within the domain in which the SRS is negative and smooth outside. The
Chapter 3 -State of the art
3.3.3. Springback
When a sheet is bent and deformed plastically, besides the permanent plastic deformation there will also be a residual amount of elastic stress that causes the sheet to return towards its undeformed configuration, when the bending moment is removed. This is called springback.
In all sheet forming processes, springback is more or less present, not only on deep drawing and bending, but also in but flanging and hemming. It affects part geometry and can have significant effects on productivity. Since springback consists of an elastic deformation, it depends on the elastic modulus of the material. More precisely, it increases as the strength–to–modulus ratio increases.
The increase in strength, combined with the lower Young's modulus (nearly 1/3 of steel), originates significant springback issues in aluminum alloys - Figure 16. High strength and dual phase steels were developed as a response to aluminum alloys, because their very high tensile strength enables thickness (and hence, weight) reduction on the components while maintaining the required resistance and good formability. But the increasing strength also lead to increasing springback issues. This is why the study of springback is of such industrial and scientific relevance nowadays.
3.4. Microstructural aspects related to formability
The effort towards the widespread adoption of aluminum alloys motivated many studies, aiming to improve sheet properties and response. The microstructural features, - crystallographic texture, grain structure and size, precipitation structure - which constitute the base for the material's macroscopic response, are the main focus of these studies. The resulting strain hardening response, strain rate sensitivity, among other properties, will help to determine the respective influences of those features.
3.4.1. Crystallographic texture
The set of preferred grain orientations in space, or crystallographic texture, is known to be the main source of anisotropic response of a material. Individual crystallites tend to deform by slip in preferred orientations, causing the mechanical response to be strongly depend on the direction of solicitation.
Figure 16: Springback comparison between steel and aluminium alloys. Since aluminium alloys have on third of the elastic modulus of steels, residual elastic deformation on parts is much higher.
Chapter 3 -State of the art
3.4.1.1. Schmid law
To move a dislocation, and thus cause plastic deformation, a critical stress must be applied to overcome the resistance to dislocation movement (glide).For an applied stress, , the resolvedσ shear stress acting upon a dislocation is:
b=coscos (16)
The resolved shear stress must exceed a critical value before shear can occur. The above equation is in fact a yield criterion for crystallographic slip, and it is named Schimd law. This condition would define the proportional limit, or yield stress. The microstructure of the metal defines τb.
The link between the two (for single crystals) is the Schmid factor, cos cos , whichφ λ typically has values between 0.2 and 0.4. In a polycrystalline sheet of metal, each individual grain, or crystal, deforms on up to five slip systems, with the activity on each defined by the resolved shear stress, just as for the single crystal. However, the deformation of the individual grains is constrained by that of its neighbors. Thus, the discrete nature of slip is the fundamental origin of plastic anisotropy: slip activity is related to the way a crystal is oriented relative to the axes of deformation [Kocks et al, 1998].
3.4.1.2. Texture and mechanical properties
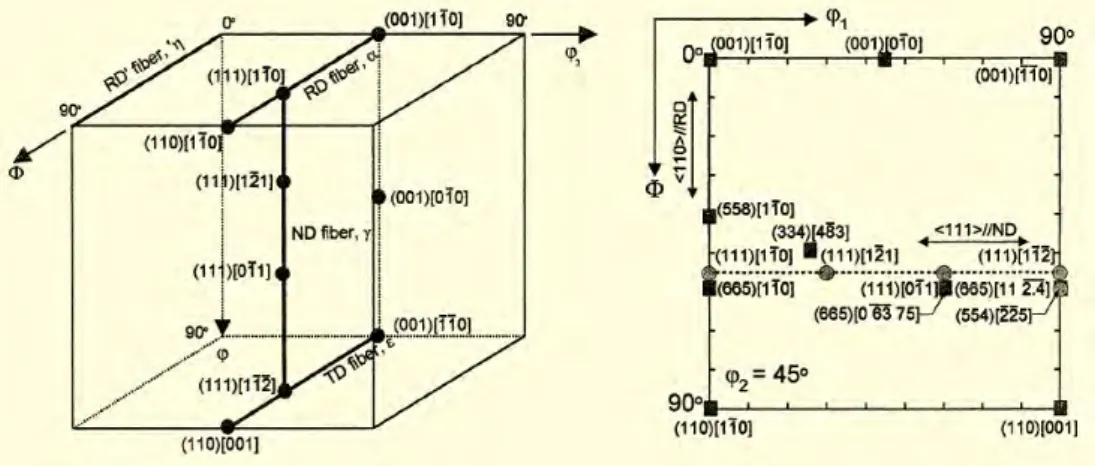
Texture is the distribution of crystal orientations within a sample. It can be described by the relation between two reference systems, the crystal reference system and the sample (macroscopic) reference system. The most usual way to describe an orientation of a crystal relatively to the sample (macroscopic reference system) is to say that one of its reference directions is parallel to the sample's normal direction, and another reference direction is parallel to the sample's rolling direction – see Appendix A.
The processing routes usually generate typical texture components. Rolling of aluminum sheets originates typical β fiber textures (Brass: {011}<112>; S:{123}<634>. Cu: {112}<111>). These textures evolve to cube ({001}<100>) and Goss ({011}<001>) textures after recrystallization.
In order to achieve good forming capability, sheet must be able to deform as far as possible before failing by excessive thickness reduction. The measure of this capability is usually given by the ratio between the sheet's deformation in width and its deformation in thickness, for a given set of conditions - the r value, or Lankford coefficient. The average value of r, rm, is calculated from three
values at specific directions from the rolling direction, usually 0º (RD itself), 45º and 90º (transverse direction):
rm=1/4r02r45r90 (17) The variation of r values along the set of directions is described by:
r=1/2 r0−2r45r90 (18)
Higher rm values mean increased deformation before rupture, and hence, better formability.
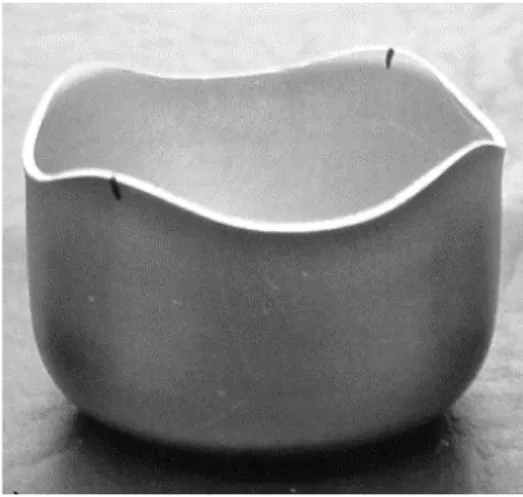
If r values present significant variations, that is to say if Δr is high, then the final part may fail sooner than expected, or present “ears”, which constitute a waste of material. Figure 17 shows a aluminum cup after deep drawing. Ears are visible in the rolling direction (marked) and also in the transverse direction. These are due to the differences in r values when considering the various directions. The sheet has higher r values on the rolling and transverse directions, and much lower r value on the 45º direction.
Texture is closely related to r values. In fact, different preferred orientations are known to cause the material to have higher or lower r values depending on the directions considered. For instance, rolling texture components (Brass, S, Copper) increase r values at 45º from rolling direction, whereas recrystallization texture components (especially Cube) reduce it significantly - Figure 18. To be able to control texture composition on sheets is very important, since it is then possible to reduce earing and increase formability. In the case of the deep drawn cup of Figure 17, and observing the r value evolution for each texture component shown on Figure 18, the sheet probably has strong Cube texture, since the cup height at 45º from the rolling direction is the lowest.
Figure 17: Typical appearance of a deep drawn cup with ears under 0° and 90° to the rolling direction (marked; AA1200-O). [Engler, 2007].
Chapter 3 -State of the art
Figure 18: Comparison of r-value directionality predicted by the Taylor (full constraints) and the VPSC models for six texture components. (a) Isotropic; (b) Copper; (c) Brass; (d) S; (e) Cube; (f) Goss. See [Choi et al, 2000] for
![Figure 13: Influence of roll speed ratio on rolling torque, for several values of reduction in thickness [Salimi, 2002].](https://thumb-eu.123doks.com/thumbv2/123dok_br/15814471.1080898/41.892.230.684.615.1022/figure-influence-rolling-torque-values-reduction-thickness-salimi.webp)

![Figure 19: Stages in the drawing and ironing of a beverage can. [alummater, 2007-2]](https://thumb-eu.123doks.com/thumbv2/123dok_br/15814471.1080898/53.892.268.648.446.690/figure-stages-drawing-ironing-beverage-alummater.webp)