Evaluating the Impact of Foreign Aid on Economic Growth: A Cross-Country Study (1970-1998).
Sandrina Berthault Moreira*
Escola Superior de Ciências Empresariais Instituto Politécnico de Setúbal, Portugal
Abstract
Many studies have tried to assess the effectiveness of foreign aid at the micro and macro level. One branch of the literature attempts to measure the contribution of foreign aid to the growth of developing countries. The micro results are clear and encouraging: foreign aid is beneficial to economic growth. However, the macro results are inconclusive: the impact of foreign aid on growth may be positive, negative, or even non-existent, in statistical terms. This contradiction is known as the ‘micro-macro paradox’. As the findings in this paper will demonstrate, certain methodological and econometric flaws inherent in the assessments being carried out may provide an explanation for the misleading macro results. I have proposed a solution for the shortcomings I have found, using a different set of common econometric tools and the generalised method of moments (GMM) estimator on simple augmentations of cross-country growth specifications. Examining a large sample of developing countries covering a 29-year period, I have found that foreign aid has had a positive impact on economic growth. In light of these findings, I conclude that less importance should be attributed to the ‘micro-macro paradox’ as an overall appraisal of the effectiveness of foreign aid. In terms of magnitude, I have also found that foreign aid has less effect on growth in the short term than in the long term. I also conclude that the time lags in the aid-growth relationship should not be ignored.
Key words
Foreign aid; economic growth; developing countries; cross-country studies; growth models; models with panel data.
1. Introduction
Foreign aid, more commonly known as official development assistance (ODA), consists of resource transfers from the official sector, in the form of grants and loans at concessional financial terms, to developing countries. Many studies in the empirical literature on the effectiveness of foreign aid have tried to assess if aid reaches its main objective, defined as the promotion of economic development and welfare of developing countries. When focusing on the traditional purpose of foreign aid – promotion of the economic growth of developing countries –, one notes that the results obtained differ according to the approach used. Studies at the micro-level, mainly using
.
This article is partly based on the author’s Masters Dissertation. * [email protected]
cost-benefit analyses, support the view of those in favour of the effectiveness of foreign aid. In contrast, the results presented in studies at the macro-level, namely cross-country regression studies, are, to say the least, ambiguous. Mosley (1986) called this contradiction the ‘micro-macro paradox’.
This paper concentrates on the aid-growth relationship at the macro-level. An overall analysis of cross-country regression studies reveals that whether the dependent variable is savings, investment or economic growth, the ODA regressor is sometimes significantly positive, sometimes significantly negative, and sometimes even insignificant, in statistical terms. That is, both the direct and indirect impact of foreign aid on the economic growth of developing countries may be positive, negative, or even non-existent, in statistical terms. The explanation for the inconclusive results remains unclear, but many authors have suggested theoretical and/or methodological and econometric causes.
The theory underlying macro studies assumes that physical capital accumulation is the key to economic growth. However, advances in growth theory have come to show that the growth process relies on a complex set of interdependent factors. In other words, a host of other factors besides physical capital accumulation is known to affect growth. Therefore, according to many authors, the Harrod-Domar growth model and the Chenery and Strout two-gap model are over-simplified.
The econometric aid-growth literature has been also criticised on several grounds. Indeed, after a careful study of twenty-nine macro studies, I have recorded a number of methodological and econometric weaknesses that may explain the inconsistent results of regression studies. Therefore, this paper assesses the macroeconomic impact of foreign aid on growth, and proposes improvements to the methodological and econometric procedures found in studies of the direct aid-growth relationship. Growth regressions, based on a large panel data set, are estimated using the generalised method of moments (GMM) suggested by Arellano and Bond (1991).
The remainder of the paper is organised as follows. Section 2 briefly presents the theory underlying the cross-country regression studies on aid effectiveness, reviewed in Section 3. Section 4 describes the main features of my empirical study, namely methodology, model specification, data and variables, followed by the analysis of the estimated results in Section 5. Section 6 presents this author's conclusions.
2. The Harrod-Domar growth model and the Chenery and Strout two-gap model
Empirical studies of the aid-growth relationship carried out until the mid-nineties were influenced by the early growth theories, which asserted that the growth process depends on the ability to surpass the constraints regarding the accumulation of physical capital. Investment is the key to economic growth.
Traditionally, the lack of savings, crucial to investment, was perceived as the single most important limitation to the growth of developing countries. Indeed, one characteristic of developing countries is their limited capacity to generate savings, due to their low per capita income. The original Harrod-Domar model was expanded in the sixties in the Chenery and Strout (1966) two-gap model. The foreign exchange shortage was introduced as another possible growth constraint. Typically, developing countries need to import goods and services, vital to investment and production; but import requirements usually exceed export earnings.
Therefore, foreign aid inflows in particular, and foreign capital inflows in general, are needed to fill the prevailing gap (savings gap or trade gap), so that countries can grow more rapidly than their internal resources would otherwise allow. If these inflows do not exist, the country will experience slower growth and inefficient employment of internal resources (labour or natural resources). The desirable outcome is self-sustaining growth.
3. Review of cross-country regression studies on aid effectiveness1
Hansen and Tarp (2000) consider two generations of empirical studies of the aid-growth relationship carried out up to the mid-nineties. The first-generation studies evaluated the link between aid and growth, by looking at savings and presenting estimates of savings regressions. The second-generation studies assessed the causal chain running from aid to growth, using as dependent variables either investment
(investment regressions) or growth (growth regressions).2
1 See Moreira (2002, pp. 50-98) for a more detailed study of this subject. 2
The most recent studies of the direct aid-growth relationship are classified as a new generation of aid effectiveness studies, because “in our view, the third-generation studies represent a distinct step forward in empirical cross-country work on aid effectiveness” (Hansen and Tarp, 2000, p. 114). As will become clearer, the contributions of the current generation of cross-country regression studies, though not at the core of the analysis, were important in shaping the empirical research in this paper.
Hansen and Tarp (2000, pp. 126-127) provide a list of twenty-nine cross-country regression studies published from the late sixties to 1998. An analysis of the main characteristics of these studies provides a general understanding of the methodological and econometric procedures prevailing in the literature. They are as follows:
1. Single-equation regressions for the total sample and sub-samples, selected according to geographical region and/or income group, to take into account regional specificities and/or income-specific effects, respectively;
2. Cross-section data or panel data with period averages or sub-period averages, respectively, as these authors believe that the important information is embedded in the similarities among countries;
3. Non-specification of time lags in the aid-growth relationship, in spite of the perception that the effect of aid on growth does not end in a single time period; 4. ODA as an exogenous variable, even though there are reasons for suspecting
reverse causality;
5. Aid flows not identified separately from other foreign capital inflows (a practice not prevalent, though strongly criticised);
6. Control variables, even though some of them are not fully documented;
7. Little mention of diagnostic tests, which are important when evaluating the quality of model specification;
8. The Ordinary Least Squares (OLS) estimation method.
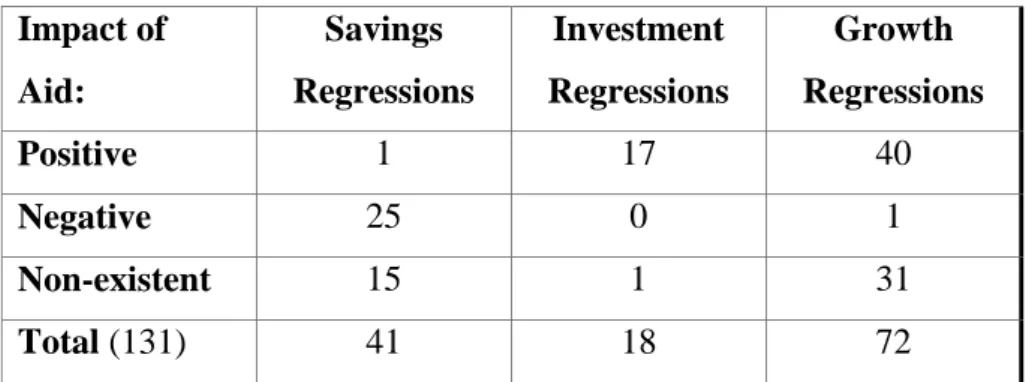
The results of these studies summarised in the table below, show inconsistent evidence of a positive and statistically significant effect of aid on growth.
Table 1 - Estimated results from twenty-nine cross-country regression studies Unit of measure: number of regression studies
Impact of Aid: Savings Regressions Investment Regressions Growth Regressions Positive 1 17 40 Negative 25 0 1 Non-existent 15 1 31 Total (131) 41 18 72
However, the main purpose of Hansen and Tarp’s detailed survey (2000) is, specifically, to offer a re-examination of the literature on the aid-growth relationship. After some theoretical and empirical considerations, these authors conclude that regressions giving empirical support to a positive aid-growth relationship prevail. Therefore, the ‘micro-macro paradox’ is non-existent. This was the first paper to draw such a startling conclusion based on sound evidence.
4. Empirical study: methodology, model specification, data and variables
4.1. Methodology Framework
As can be seen in the previous section, there is evidence of methodological and econometric shortcomings in the first and second generation studies. These shortcomings were criticised in the literature and in some cases, seen as the explanation for the disparities between micro and macro results in general, and the inconclusive macro results in particular. Therefore, I propose an alternative methodological and econometric procedure to heighten the accuracy of aid-growth studies.
From the list of cross-country regression studies supplied by Hansen and Tarp (2000), I have focused on single-equation growth regressions, since it is the most common practice found in the literature. Within this regression subset, I have chosen the model specification suggested by Dowling and Hiemenz (1982) and Mosley, et al. (1987, 1992). Among other reasons, these authors have been selected for the importance they had on the empirical literature on the macroeconomic effectiveness of foreign aid.
Like the majority of growth regression studies, both studies mentioned above use the reduced form equation proposed by Papanek (1973) as their basic model. This is also my point of departure. The original derivation of the Papanek regression was based on the Harrod-Domar growth equation and a behavioural equation in which investment depends on its major financing components, including domestic savings as well as various forms of foreign resource inflows (ODA, private and other official inflows).
The first practice I have changed was that of expressing the dependent variable in per capita terms. The growth rate of real per capita GDP is the most common indicator of a population’s standard of living. This implies a small change to the Harrod-Domar growth model, in order to incorporate the effects of population growth.
A non-linear relationship between aid and growth is not taken into account in any of the 72 growth regressions selected from the literature. However, there are reasons for expecting that “too much aid” is detrimental to economic growth. As already put forward by Chenery and Strout (1966), the capacity of foreign aid to accelerate economic growth is contingent upon the absorption capacity of aid recipients. Excessively high amounts of foreign aid raise problems of absorption capacity and are thus counterproductive. A further effect of excessive aid is known as “Dutch disease”. The Dutch Disease operates through the spending effect. When part of the additional income generated by a strong inflow (boom) of aid is spent in-country on non-traded goods and services (education, health, welfare, construction, other services), the result is an excessive demand for this type of goods and services. Since imports cannot flood in to meet demand, and since domestic supply constraints exist, the price of the non-tradable goods and services will therefore rise in relation to the price of those non-tradable. This appreciation of the real exchange rate is detrimental to external competitiveness and economic growth. As a result, I have allowed for non-linear effects of aid on growth by including the squared aid term.
Most growth regression studies also take no account of the time lags that most probably exist in the aid-growth relationship. One would not expect aid to be effective in a single time period. Instead, lags may occur between aid-financed activities and their eventual impact on growth. The difficulty is how to allow for this time lapse econometrically. To provide for this time lapse, I have introduced some dynamic into the non-linear effect of aid by using an autoregressive distributed lag (ADL) relation between aid and growth. Aid and growth are each lagged once to reveal that the current growth value depends on the current and all previous values of foreign aid. In other words, this relationship shows that the current value of foreign aid has an effect on the current and future values of growth. Reparameterising this ADL (1,1) scheme with first differences implies that the basic model has both aid and aid squared in levels and differences, and the dependent variable lagged once as a regressor.
Papanek (1973) and Mosley, et al. (1987, 1992) estimate single-equation growth regressions for the total sample and sub-samples, selected according to geographical region. As an alternative, Dowling and Hiemenz (1982) prefer to estimate single-equation growth regressions for the total sample, including regional dummies. Both
practices have been widely used to point out that, ceteris paribus, growth performances in countries in those regions appear to differ from those of other developing countries. However, using a panel data model with individual effects has a number of benefits, among which is that it allows us to account for individual heterogeneity. Indeed, developing countries differ in terms of their colonial history, their political regimes, their ideologies and religious affiliations, their geographical locations and climatic conditions, not to mention a wide range of other country-specific variables. Failing to take this heterogeneity into account will inevitably bias the results, no matter how large the sample is. The empirical model I have chosen to use is therefore a dynamic panel data model with fixed country effects. Time dummies are also taken into account to
correct for possible fixed time period effects.3
Most growth regression studies assume that foreign aid is an exogenous variable, even though aid is expected to be endogenous in growth regressions. On the one hand, foreign aid may present issues of reverse causality, especially because, if aid depends on the level of income, it will necessarily depend on economic growth. If reverse causality is not taken into account, it can lead to serious inaccuracies in research results. Not only are the parameter estimates inconsistent, but the magnitude and the meaning of the aid parameter is altered as well. On the other hand, the disturbance term may include factors that both affect growth and are correlated with aid, thus rendering the parameter estimates inconsistent. Consequently, I have employed Arellano and Bond’s GMM-type estimator (1991) to deal with the issue of endogeneity in the context of panel data models.
The GMM estimator proposed by Arellano and Bond (1991), also known as two-step estimation, is constructed in two phases. Firstly, first differences from the dynamic panel data model are calculated; then, lagged values of right-hand side variables are used as their instruments. With lagged dependent variable and other endogenous regressors (as is the case with aid and aid squared), the lagged levels are dated t-2 and earlier. If there are predetermined regressors, all their lagged levels are used as
instruments.4
3
I have chosen fixed effects rather than random effects mainly because, when Hausman’s specification test is employed, the fixed effects estimator is consistent whether the null hypothesis (no correlation between individual effects and regressors) is true or not.
4 As done by Hansen and Tarp (2001), the additional regressors of the present empirical study (being other official inflows and time dummies an exception) are assumed to be predetermined.
Before addressing the model specification issue, two technical aspects must be mentioned. First, one practical difficulty found in the estimation process is that the early values of the instruments do not show a close correlation to their late values, though the quality of the instruments depends on it. For this reason, I have used the common procedure of limiting the number of lags for each variable. Second, Arellano and Bond (1991) developed, not only a GMM estimator to apply to dynamic panel data models, but associated specification tests as well. The Sargan test evaluates if the instruments are valid. In turn, the second-order serial correlation in the first-differenced residuals evaluates if there is serial correlation in the residuals. The GMM estimator is consistent, when the null hypothesis of both tests is not rejected.
4.2. Model Specification
The empirical model can be expressed in the following equation:
it i it it it t t i it it it it it it it it it w w x g n oof pf oda oda oda oda s g * 1 , 7 6 2 5 2 4 3 2 1 * (1)
where git* is per capita GDP growth rate in country i, period t; s are domestic savings; it
it
oda is official development assistance; pf are private flows; it oof are other official it
flows; n is the population growth rate; it t represents time period effects; x represents it
other growth determinants; w represents both country effects (it i) and the remainder
disturbance which varies over both country and time (it).
In brief, I have changed Papanek’s conventional basic model to incorporate: first, a dynamic non-linear aid-growth relationship; second, the effects of population growth and other growth determinants suggested by Dowling and Hiemenz (1982) and Mosley, et al. (1987, 1992); third, fixed country and time period effects. I then use the Arellano and Bond’s GMM-type estimator (1991), assuming that foreign aid is endogenous. 4.3. Description of data and variables
Equation (1) is estimated examining 48 developing countries covering the period 1970 to 1998. I have used six sub-period averages instead of yearly data. The presence of missing values produced a total sample of 179 observations (unbalanced panel data).
The main data source is the World Bank (2001) and the OECD-DAC (1999, 2000b). In Appendix I, I present the list of sample countries according to income group and geographical region; summary statistics for the main variables; and the correlation
matrix. Appendix II shows the list of variables and sources.5
A few words must be said regarding the intuitive sign for each independent variable. As sources of physical capital accumulation, domestic savings, official development assistance, private inflows, and other official inflows (all as a percentage of the GDP) are expected to have a positive impact on investment and therefore on economic growth. The quadratic term of the aid/GDP ratio is expected to be negatively related to growth. As has been pointed out, very high aid inflows (measured in relation to the GDP) are counterproductive. The population growth rate is also expected to have a negative effect on the growth rate of real per capita GDP.
Dowling and Hiemenz (1982) added four policy variables to Papanek’s model. First, they expressed the degree of openness as the ratio of exports plus imports as a proportion of GDP. There is theoretical justification and empirical evidence to support the idea that trade liberalisation raises economic growth. Second, the role of governments in domestic resource mobilisation is measured by central government tax revenues as a percentage of the GDP. The sign of this variable is a priori ambiguous, because higher taxes can raise public savings and therefore contribute to domestic resource mobilisation. However, it can also reduce private savings and discourage private capital formation. Third, the share of the public sector in economic activities is measured by total government expenditure in GDP. The inefficiency usually associated with public enterprises and the oversized bureaucracies suggest a negative sign for this variable. Fourth and last, we have M2 over GDP as a proxy for financial development. Financial development stimulates economic growth by enlarging the services provided by financial intermediaries such as savings mobilisation, project evaluation, and risk management. Users of financial depth hypothesise that the size of financial intermediaries, traditionally measured by the ratio of M2 to GDP, is positively associated with the provision of financial services.
5
The developing countries listed in Appendix I were selected from The 2001 World Development
Indicators (World Bank, 2001). Countries that did not have foreign aid data for at least half of the sample
period were excluded. The econometric package also removed countries that had missing values in the six sub-periods.
Mosley, et al. (1987, 1992) also proposed an expanded version of the Papanek-type regression. The additional independent variables chosen were changes in export values and the literacy rate. Faster export growth is expected to contribute to economic growth, by increasing the supply of foreign exchange and thus the capacity to import raw materials and equipment essential to rapid and sustained growth. To factor in the positive contribution that higher levels of education exert on economic growth, I have chosen the average number of years of education in the total population (aged 25 and over). Indeed, this and other measures suggested by Barro and Lee (2000) to proxy for human capital have advantages over other educational variables used in cross-country studies, namely, school enrolment ratios and literacy rates.
5. Regression results
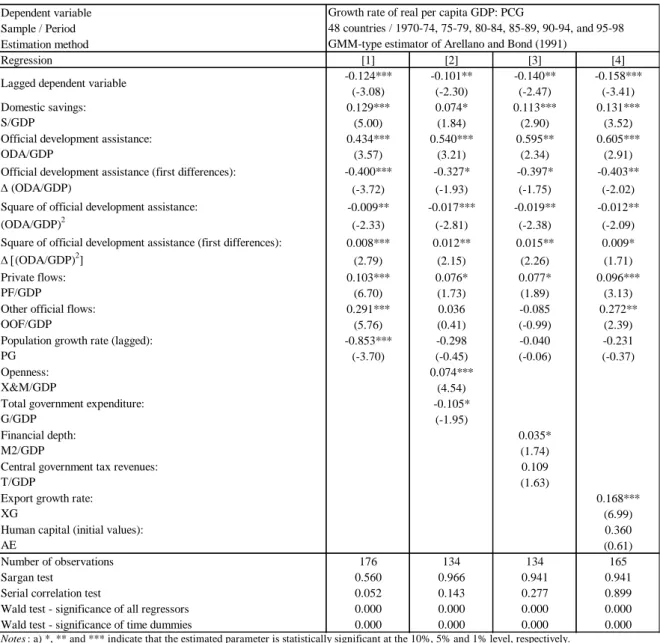
The GMM results using equation (1) are displayed in Table 2.6 Regression [1]
presents the estimated results of my basic model. The high correlation between tax revenue and expenditure (correlation coefficient equal to 0.86 - see Appendix I) suggests that multicollinearity is a problem. So, as Dowling and Hiemenz (1982), I have put the policy variables into separate regressions, named regressions [2] and [3]. Regression [4] enters the additional variables suggested by Mosley, et al. (1987, 1992).
From regression [1], we see that the variables included in the basic model are all correctly signed and statistically significant. In addition, the stability condition ( |-0.124| < 1 ) is met; otherwise, we wouldn’t have been able to determine the short and long-term effect of foreign aid on economic growth. The inclusion of other growth factors (regressions [2], [3], and [4]) does not alter the expected sign; nor does it change the statistical significance of the domestic savings parameter or of the private flows parameter. Moreover, the magnitude of these parameters only presents small variations. The same goes for the parameters associated with a dynamic, non-linear aid-growth relationship. On the other hand, the results for other official flows and population growth rate are not very stable. Thus, with the exception of oof and n, the basic model parameters are robust in that they show little sensitivity to small changes in the basic model specification.
The variables added to the basic model have the intuitive signs. The respective parameters are statistically significant with the exception of the parameters for tax revenue and human capital. As noted by Barro and Lee (2000), a large portion of the labour force in many developing countries is younger than 25. Therefore, I have used average years of schooling in the population aged 15 and above, instead of aged 25 and above. Even so, the corresponding parameter remains statistically insignificant.
Table 2 - Growth regressions using panel data with fixed effects
Finally, I have used four tests to evaluate the quality of model specification. As can be seen from the table above, the null hypothesis of valid instruments has not been Dependent variable Sample / Period Estimation method Regression [1] [2] [3] [4] -0.124*** -0.101** -0.140** -0.158*** (-3.08) (-2.30) (-2.47) (-3.41) 0.129*** 0.074* 0.113*** 0.131*** (5.00) (1.84) (2.90) (3.52) 0.434*** 0.540*** 0.595** 0.605*** (3.57) (3.21) (2.34) (2.91) -0.400*** -0.327* -0.397* -0.403** (-3.72) (-1.93) (-1.75) (-2.02) -0.009** -0.017*** -0.019** -0.012** (-2.33) (-2.81) (-2.38) (-2.09) 0.008*** 0.012** 0.015** 0.009* (2.79) (2.15) (2.26) (1.71) 0.103*** 0.076* 0.077* 0.096*** (6.70) (1.73) (1.89) (3.13) 0.291*** 0.036 -0.085 0.272** (5.76) (0.41) (-0.99) (2.39) -0.853*** -0.298 -0.040 -0.231 (-3.70) (-0.45) (-0.06) (-0.37) 0.074*** (4.54) -0.105* (-1.95) 0.035* (1.74) 0.109 (1.63) 0.168*** (6.99) 0.360 (0.61) Number of observations 176 134 134 165 Sargan test 0.560 0.966 0.941 0.941
Serial correlation test 0.052 0.143 0.277 0.899
Wald test - significance of all regressors 0.000 0.000 0.000 0.000
Wald test - significance of time dummies 0.000 0.000 0.000 0.000
c) Regressions with time dummies. d) The p-value for the tests.
b) t-values are shown in parenthesis. Heteroskedasticity-consistent standard deviations.
Growth rate of real per capita GDP: PCG
48 countries / 1970-74, 75-79, 80-84, 85-89, 90-94, and 95-98 GMM-type estimator of Arellano and Bond (1991)
Lagged dependent variable
Domestic savings: S/GDP
Official development assistance: ODA/GDP
Official development assistance (first differences):
(ODA/GDP)
Square of official development assistance:
(ODA/GDP)2
Square of official development assistance (first differences):
(ODA/GDP)2]
Private flows: PF/GDP
Other official flows: OOF/GDP
Population growth rate (lagged): PG
Export growth rate: XG
Human capital (initial values): AE
Notes : a) *, ** and *** indicate that the estimated parameter is statistically significant at the 10%, 5% and 1% level, respectively. Openness:
X&M/GDP
Total government expenditure: G/GDP
Financial depth: M2/GDP
Central government tax revenues: T/GDP
rejected nor has the null hypothesis of no second-order serial correlation in the first-differenced residuals. In addition, I have rejected the null hypothesis of regressor parameters that are simultaneously null, and the null hypothesis of time dummy parameters that are simultaneously null.
The results achieved allow one to calculate the macroeconomic contribution of foreign aid on the economic growth of developing countries, namely its short and long-term effect. Given the lag structure proposed in section 4.1., the immediate, short-long-term effect of a unit change on the aid/GDP ratio on the average growth value can be expressed as:
oda oda g it it 5 4 3 2 * 2 where oda is the mean value of the aid/GDP ratio.
The total, long-term effect of a unit change on the aid/GDP ratio on the average growth value can be expressed as:
oda oda g 1 2 1 4 2 *
where oda is the mean value of the aid/GDP ratio.
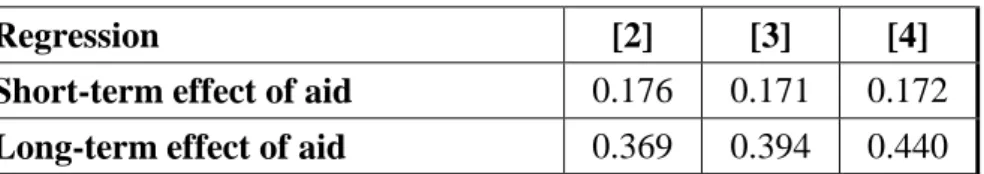
Table 3 suggests that for developing countries as a whole (for a country with the mean aid/GDP ratio), an increase in the aid/GDP ratio of one percentage point leads to a per capita growth rate increase of 0.17 percentage points. However, the total impact on per capita growth of a one percentage point increase in the aid/GDP ratio oscillates between 0.37 and 0.44 percentage points, depending on the regression. These results may not be sizeable in terms of magnitude, but they do show that the immediate effect of aid on growth is positive and lower than its long-term effect.
Table 3 - Aid effectiveness results
Regression [2] [3] [4]
Short-term effect of aid 0.176 0.171 0.172
6. Conclusion
This paper has sought to evaluate the macroeconomic impact of foreign aid on the economic growth of developing countries. Cross-country growth regressions were at the core of the analysis. In an attempt to achieve greater accuracy and improve upon existing procedures, which were viewed as possible causes of the ambiguous macro results underlying the ‘micro-macro paradox’, I have proposed a methodological and econometric procedure that differs from the most prevalent one used in the literature up to the mid-nineties. Using two expanded versions of the well-known reduced form Papanek-type regression, the results achieved are in line with the micro results which show that foreign aid is beneficial to the economic growth of developing countries. Given this, one may then state that there is empirical evidence to assert that the ‘micro-macro paradox’ should be given less importance as an overall appraisal of foreign aid effectiveness.
The empirical results also suggest that non-linearity and time lags in the aid-growth relationship, country heterogeneity, and endogeneity of foreign aid should be factored in when assessing the impact of foreign aid. It should be stressed that the most recent aid effectiveness studies, known as the third-generation studies, do employ econometric tools to account for at least, one of these factors. However, the issue of time lags between aid-financed activities and their eventual impact on growth has been neglected. The empirical study described in the present paper shows that the immediate and overall impact of aid on growth differ in terms of magnitude. This provides support to assert that the time lags in the aid-growth relationship should not be ignored. Nonetheless, the issue of time lags in the aid-growth relationship remains a Gordian knot in the empirical cross-country work on aid effectiveness. Indeed, the required lag structure will change according to the recipient country and the type of aid allocated. Programme aid is expected to have a more rapid impact than project aid and this, in turn, is expected to have a more rapid impact than technical cooperation aimed at raising the level of human skills. This suggests that future research should focus on in-depth, country-specific, case studies.
References
Arellano, M. and Bond, S. (1991), Some Tests of Specification for Panel Data: Monte Carlo Evidence and an Application to Employment Equations, Review of Economic Studies, 58, pp. 277-297.
Baltagi, B. H. (1995), Econometric Analysis of Panel Data, West Sussex: John Wiley & Sons.
Barro, R. J. (1991), Economic Growth in a Cross Section of Countries, Quarterly Journal of Economics, 106 (2), pp. 407-443.
Barro, R. J. (1997), Determinants of Economic Growth: A Cross-Country Empirical Study, Cambridge: MIT Press.
Barro, R. J. and Lee, J.-W. (1996), International Measures of Schooling Years and Schooling Quality, American Economic Review, 86 (2), pp. 218-223.
Barro, R. J. and Lee, J.-W. (2000), International Data on Educational Attainment: Updates and Implications, Working Paper 42 [online] Harvard: CID – Center for International Development. http://post.economics.harvard.edu/faculty/barro/papers/p_jwha.pdf.
Barro, R. J. and Sala-I-Martin, X. (1995), Economic Growth, New York: McGraw-Hill, Inc.
Beynon, J. (2001), Policy Implications for Aid Allocations of Recent Research on Aid Effectiveness and Selectivity, [online] Experts’ Seminar on Aid Effectiveness, Selectivity and Poor Performers Paris 17 January 2001. http://www.oecd.org/dac/pdf/aid_effecti/beynon_1.pdf. Burnside, C. and Dollar, D. (1997), Aid, Policies, and Growth, Policy Research Working Paper
1777 [online] Washington, D.C.: World Bank. http://www.worldbank.org.
Burnside, C. and Dollar, D. (2000), Aid, Policies, and Growth, American Economic Review, 90 (4), pp. 847-868.
Caselli, F., Esquivel, G. and Lefort, F. (1996), Reopening the Convergence Debate: A New Look at Cross-Country Growth Empirics, Journal of Economic Growth, 1 (3), pp. 363-389.
Cassen, R. and associates (1994), Does Aid Work? Report to an Intergovernmental Task Force, 2nd ed. Oxford: Clarendon Press.
Chenery, H. B. and Strout, A. M. (1966), Foreign Assistance and Economic Development, American Economic Review, 56 (4), pp. 679-733.
Chenery, H. B. and Strout, A. M. (1979), Foreign Assistance and Economic Development, in: H. B. Chenery (ed.), Structural Change and Development Policy, New York: Oxford University Press, 1979, pp. 382-455.
Davidson, R. and MacKinnon, J. G. (1993), Estimation and Inference in Econometrics, New York e Oxford: Oxford University Press.
Debraj, R. (1998), Development Economics, New Delhi: Oxford University Press.
Doornik, J. A., Arellano, M. and Bond, S. (2001), Panel Data Estimation using DPD for OX, [online] http://www.nuff.ox.ac.uk/Users/Doornik/papers/dpd.pdf.
Doornik, J. A. and Ooms, M. (2001), Introduction to Ox, 3rd ed. London: Timberlake Consultants Press.
Dowling, J. M. and Hiemenz, U. (1982), Aid, Savings and Growth in the Asian Region, Economic Office Report Series 3, Asian Development Bank.
Durbarry, R., Gemmell, N. and Greenaway, D. (1998), New Evidence on the Impact of Foreign Aid and Economic Growth, Research Paper 98/8 [online] Nottingham: CREDIT – Centre for
Research in Economic Development and International Trade.
http://www.nottingham.ac.uk/economics/credit/research/papers/cp.98.8.pdf.
Easterly, W. (1999), The Ghost of Financing Gap: Testing the Growth Model Used in the International Financial Institutions, Journal of Development Economics, 60 (2), pp. 423-438.
Greene, W. H. (1997), Econometric Analysis, 3rd ed. New Jersey: Prentice-Hall, Inc.
Guillaumont, P. and Chauvet, L. (1999), Aid and Performance: A Reassessment, [online] Auvergne: CERDI – Centre d’Etudes et de Recherches sur le Développement International.
http://www.worldbank.org/poverty/wdrpoverty/stiglitz/Guillau3.pdf.
Hadjimichael, M. T., Ghura, D., Mühleisen, M., Nord, R. and Uçer, E. M. (1995), Sub-Saharan Africa: Growth, Savings, and Investment, 1986-93, Occasional Paper 118, Washington, D.C.: IMF.
Hansen, H. and Tarp, F. (1999), Aid Effectiveness Disputed, [online] Nottingham: CREDIT.
http://www.nottingham.ac.uk/economics/credit/research/papers/cp.99.10.pdf.
Hansen, H. and Tarp, F. (2000), Aid Effectiveness Disputed, in: F. Tarp (ed.), Foreign Aid and Development: Lessons Learnt and Directions for the Future, London: Routledge, 2000, pp. 103-128.
Hansen, H. and Tarp, F. (2001), Aid and Growth Regressions, Journal of Development Economics, 64, pp. 547-570.
Hansen, H., Tarp, F. and Vikkelso, S. (1998), Aid Effectiveness: A Survey of 30 Years of Literature on Aid-Savings, Aid-Investment, and Aid-Growth Linkages, Copenhagen: DERG – Development Economics Research Group. Unpublished.
Jonhston, J. and Dinardo, J. (1997), Econometric Methods, 4th ed. Singapore: McGraw-Hill.
King, R. G. and Levine, R. (1993), Finance, Entrepreneurship, and Growth: Theory and Evidence, Journal of Monetary Economics, 32 (3), pp. 512-542.
Moreira, S. (2002), Ajuda Pública ao Desenvolvimento e Crescimento Económico – Estudos Cross-Country da Relação Ajuda-Crescimento, Masters Dissertation, Lisbon: ISEG/UTL – Instituto Superior de Economia e Gestão of the Universidade Técnica de Lisboa. Unpublished.
Mosley, P. (1986), Aid Effectiveness: The Micro-Macro Paradox, Institute of Development Studies Bulletin, 17 (2), pp. 22-27.
Mosley, P., Hudson, J. and Horrell, S. (1987), Aid, the Public Sector and the Market in Less Developed Countries, Economic Journal, 97 (387), pp. 616-641.
Mosley, P., Hudson, J. and Horrell, S. (1992), Aid, the Public Sector and the Market in Less Developed Countries: A Return to the Scene of the Crime, Journal of International Development, 4 (2), pp. 139-150.
OECD-DAC (1999), Geographical Distribution of Financial Flows to Aid Recipients, Disbursements, Commitments, Country Indicators 1960-1997 [CD-ROM], Paris: OECD – Organisation for Economic Co-operation and Development.
OECD-DAC (2000a), Development Co-operation: 1999 Report, Paris: OECD.
OECD-DAC (2000b), Geographical Distribution of Financial Flows to Aid Recipients, Disbursements, Commitments, Country Indicators 1994-1998, Paris: OECD.
OECD-DAC (2001), Development Co-operation: 2000 Report, Paris: OECD.
Papanek, G. F. (1973), Aid, Foreign Private Investment, Savings, and Growth in Less Developed Countries, Journal of Political Economy, 81 (1), pp. 120-130.
Riddell, R. (1987), Foreign Aid Reconsidered, London: James Currey.
Tarp, F. (2000), Foreign Aid and Development: Lessons Learnt and Directions for the Future, London: Routledge.
Tsikata, T. M. (1998), Aid Effectiveness: A Survey of the Recent Empirical Literature, IMF Paper on Policy Analysis and Assessments PPAA/98/1 [online] Washington, D.C.: IMF – International Monetary Fund. http://www.imf.org/external/pubs/ft/ppaa/ppaa9801.pdf.
White, H. (1992a), The Macroeconomic Impact of Development Aid: A Critical Survey, The Journal of Development Studies, 28 (2), pp. 163-240.
White, H. (1992b), What Do We Know About Aid’s Macroeconomic Impact? An Overview of the Aid Effectiveness Debate, Journal of International Development, 4 (2), pp. 121-137.
White, H. and Lensink, R. (1999b), Is There an Aid Laffer Curve?, Research Paper 99/6
[online] Nottingham: CREDIT.
http://www.nottingham.ac.uk/economics/credit/research/papers/cp.99.6.pdf.
World Bank (1998), Assessing Aid: What Works, What Doesn’t, and Why, [online] New York: Oxford University Press. http://www.worldbank.org/research/aid/aidpub.htm.
World Bank (2001), The 2001 World Development Indicators [CD-ROM, version 4.2], Washington, D.C.: Development Data Group.
World Bank (2002), The Role and Effectiveness of Development Assistance: Lessons from World Bank Experience, [online] United Nations International Conference Financing for
Development Monterrey 18-22 March 2002.
Appendix I – Sample countries according to income group and geographical region, summary statistics and the correlation matrix
Income group
Low income countries (17 countries)
Lower middle income countries (20 countries)
Upper middle countries (11 countries) Geographical region
Latin America & Caribbean (16 countries)
Middle East & North Africa (4 countries)
Sub-Saharan Africa (14 countries)
Asia, Europe and Pacific (14 countries)
Series in levels (179 observations) PCG S/GDP ODA/GDP PF/GDP OOF/GDP PG X&M/GDP G/GDP M2/GDP T/GDP XG AE
Summary statistics Mean 1.56 18.40 3.88 2.74 0.77 2.27 60.71 22.60 32.30 15.97 6.34 4.01 Standard deviation 3.16 10.72 4.94 3.35 0.86 0.78 32.70 9.89 19.38 6.32 6.41 1.84 Minimum -11.48 -43.01 -0.02 -2.75 -1.24 0.52 12.70 0.00 6.71 0.00 -15.25 0.14 Maximum 9.37 49.19 34.89 30.42 3.60 5.69 158.95 76.28 116.51 38.53 23.98 9.25 Correlation matrix
Per capita real GDP (growth; %): PCG 1.00
Domestic savings (% GDP): S/GDP 0.33 1.00
Foreign aid (% GDP): ODA/GDP -0.22 -0.59 1.00
Private flows (% GDP): PF/GDP 0.19 -0.05 -0.07 1.00
Other official flows (% GDP): OOF/GDP -0.22 -0.18 0.19 0.03 1.00
Population (growth; %): PG -0.31 -0.26 0.40 -0.09 0.20 1.00
Openness (% GDP): X&M/GDP 0.09 -0.10 0.30 0.31 0.35 0.10 1.00
Total government expenditure (% GDP): G/GDP -0.08 -0.27 0.41 0.17 0.35 0.02 0.58 1.00
Financial depth (% GDP): M2/GDP 0.27 0.07 0.04 0.19 0.09 -0.07 0.46 0.36 1.00
Central government tax revenues (% GDP): T/GDP 0.08 -0.14 0.21 0.28 0.31 -0.08 0.66 0.86 0.27 1.00
Exports (growth; %): XG 0.59 0.12 -0.12 0.13 -0.21 -0.13 -0.04 -0.20 0.11 -0.09 1.00
Human capital (years of schooling): AE 0.24 0.28 -0.45 0.18 -0.18 -0.51 0.06 -0.09 0.23 0.10 0.14 1.00
Sample of countries classified by:
48 countries
Bangladesh, Cameroon, Congo Democratic Republic, Ghana, India, Indonesia, Kenya, Lesotho, Liberia, Malawi, Nepal, Nicaragua, Pakistan, Senegal, Sierra Leone, Zambia and Zimbabwe.
Bolivia, China, Colombia, Costa Rica, Dominican Republic, Ecuador, Egypt, Fiji, Guyana, Jordan, Papua New Guinea, Paraguay, Peru, Philippines, Sri Lanka, Swaziland, Syrian, Thailand, Tunisia and Turkey.
Botswana, Cameroon, Congo Democratic Republic, Ghana, Kenya, Lesotho, Liberia, Malawi, Mauritius, Senegal, Sierra Leone, Swaziland, Zambia and Zimbabwe.
Bangladesh, China, Fiji, India, Indonesia, Malaysia, Nepal, Pakistan, Papua New Guinea, Philippines, South Korea, Sri Lanka, Thailand and Turkey.
Argentina, Botswana, Brazil, Chile, Malaysia, Mauritius, Mexico, Panama, South Korea, Uruguay and Venezuela. 48 countries
Argentina, Bolivia, Brazil, Chile, Colombia, Costa Rica, Dominican Republic, Ecuador, Guyana, Mexico, Nicaragua, Panama, Paraguay, Peru, Uruguay and Venezuela.
Appendix II - List of variables and sources
In the estimates, average data over sub-periods of five years are used, except for the last period, which refers to four years. Following the literature, initial data, rather than average data, is used for the variable suggested by Barro and Lee (2000).
PCG:
GDP per capita (% growth; constant local currency) - World Bank (2001); S/GDP:
Gross domestic savings (% of GDP) - World Bank (2001); ODA/GDP:
Net ODA (current US$) - OECD-DAC (1999) for 1970-93 and OECD-DAC (2000b) for 1994-98; GDP (current US$) - World Bank (2001);
PF/GDP:
Private capital flows, net total (current US$) and GDP (current US$) –-World Bank (2001);
OOF/GDP:
Net OOF (current US$) - OECD-DAC (1999) for 1970-93 and OECD-DAC (2000b) for 1994-98; GDP (current US$) - World Bank (2001);
PG:
Population growth (%) - World Bank (2001); X&M/GDP:
Trade (% of GDP) - World Bank (2001); G/GDP:
Total expenditure (% of GDP) - World Bank (2001); M2/GDP:
Money and quasi-money (M2) as % of GDP - World Bank (2001); T/GDP:
Tax revenue (% of GDP) - World Bank (2001); XG:
Exports of goods and services (% growth; constant local currency) - World Bank (2001);
AE: