DEALING WITH MISSING DATA: AN APPLICATION IN THE
STUDY OF FAMILY HISTORY OF HYPERTENSION
A dissertation presented by Samantha Ferreira Morais to the Faculty of Medicine of the University of Porto.
In partial fulfilment of the requirements for the Master’s degree in Epidemiology at the Faculty of Medicine of the University of Porto
Supervisor: Professor Milton Severo, PhD Co-Supervisor: Professor Elisabete Ramos, PhD
This dissertation is based on two manuscripts, for which I actively collaborated in the analysis and interpretation of data. The data was provided by the EPITeen Cohort, a project that has been taking place since 2003 at the Faculty of Medicine of the University of Porto and the Institute of Public Health of the University of Porto.
Thank you,
Professor Milton Severo, for the invaluable assistance in the analyses of the data presented and review of the work. For his guidance, availability and knowledge.
Professor Elisabete Ramos, who thoughtfully shared her understanding and knowledge of epidemiology and for the availability of the EPITeen data.
Masters colleagues, and now friends, who inspired me along the way. Especially, Inês and Sandra for their friendship and encouragement, and for the support during my struggles and frustrations in my new life and studies in Portugal.
Catarina for her patience and with whom I could always share my excitements and problems. Monica and Juliana for their friendship and inspiration.
Charlie for always being by my side. Scarlett and Max for understanding my absence.
Pascoal Family, for always welcoming and treating me as one of their own and for everything they did for me in these past years.
My family, especially my mom for always believing in me, for their unconditional love and support and for their words of encouragement. Without you, I would not be the person I am today.
Table of Contents
Abstract ... 1
English ... 1
Portuguese ... 3
Introduction ... 5
Origins of Missing Data ... 6
Item Nonresponse ... 6
Unit Nonresponse ... 6
Missing Data Mechanisms ... 7
Missing Completely at Random (MCAR) ... 8
Missing at Random (MAR) ... 8
Missing Not at Random (MNAR) ... 9
Consequences of Missing Data ... 9
Approaches for Dealing with Missing Values for Data Analysis ... 10
Complete-Case Analysis... 11
Available-Case Analysis ... 11
Simple Imputation ... 12
Multiple Imputation ... 12
Aim of the Study ... 13
References ... 14
Manuscript 1: Determinants of Nonresponse in a Cohort of Urban Adolescents - EPITeen Cohort ... 17
Abstract ... 19
Introduction ... 20
Materials and Methods ... 21
Results... 22
Discussion ... 25
Conclusion ... 28
References ... 29
Manuscript 2: Sensitivity Analysis of the Effect of Nonresponse on the Association of
Family History of Hypertension and Adolescent Hypertension - EPITeen Cohort ... 37
Abstract ... 39
Introduction ... 40
Materials and Methods ... 41
Results... 44 Discussion ... 45 Conclusion ... 47 References ... 48 Tables ... 50 Conclusions ... 53
List of Figures
List of Tables
Table 1 Questions included in each section: adolescent, mother, father, maternal grandparents and paternal grandparents (* “Don’t know” as option for reply)... 31 Table 2 Description of participants’ characteristics ... 32 Table 3 Association between participants’ characteristics and incomplete data for adolescent’s, mother’s, father’s, maternal grandparents’ and paternal grandparents’ questionnaire sections and for total items ... 33 Table 4 Description of the clusters according to the sections that have more than 50% missingness (marked with X) ... 35 Table 5 Prevalence of family hypertension, adolescent’s BMI, parents smoke and parents’ education for the total sample, complete and incomplete cases and after multiple imputation (MI) ... 50 Table 6 Analysis of the association between family history of hypertension and adolescent’s high blood pressure* using complete-cases (CC) and using multiple imputation (MI) .... 51
List of Abbreviations
95%CI 95% Confidence Interval aOR adjusted Odds Ratio BMI Body Mass Index CC Complete-Case(s)
EPITeen Epidemiological Health Investigation of Teenagers in Porto MAR Missing at Random
MCAR Missing Completely at Random MI Multiple Imputation
MICE Multivariate Imputation by Chained Equations MNAR Missing Not at Random
Abstract
English
Introduction
Missing data are an inevitable problem in epidemiological research, which may pose a threat to the validity and generalizability of study results as a result of selection bias and loss of statistical power and precision when the sample size is reduced. Consequently, it is important to determine if complete cases and those with missing values systematically differ as to aid in the decision to use an appropriate method to handle missing data.
Objectives
To examine determinants of missingness in a self-administered questionnaire developed for 13-year-old urban adolescents as part of a population-based cohort and to compare two methods to deal missing data: complete-case and multiple imputation (MI) using as an example the analysis of the association between an adolescent’s risk of high blood pressure and family history of the condition.
Methods
Participants were assessed at the baseline evaluation of the EPITeen cohort. Patterns and determinants of nonresponse for a set of 5 sections from a self-administered questionnaire were studied using simple and multiple logistic regressions. The complete-case analyses used SPSS and MI used R’s MICE procedure to perform MI by creating 20 imputed databases and logistic regressions were performed. Associations were evaluated by crude and adjusted odds ratio (OR) and respective 95% confidence interval (95%CI).
Results
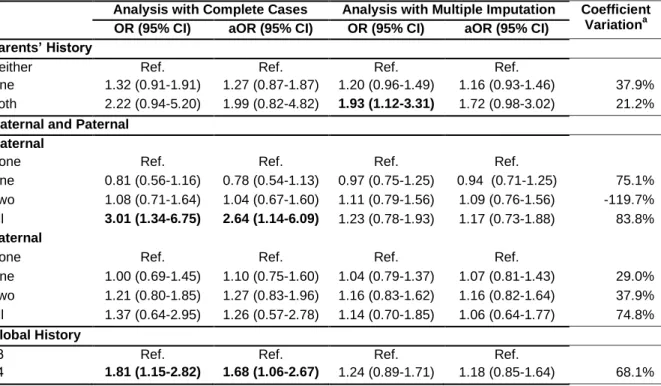
Lower socio-economic status and whom the adolescent resides with were found to be determinants of missingness. There was a negative association with increasing parental education (OR=0.21, 95%CI: 0.15-0.28 higher than 12 years compared with less than 5 years) and when the adolescent resides with both parents (OR=0.41, 95%CI: 0.29-0.57). An almost significant increase in the risk of high blood pressure was found with a complete-case analysis when both parents have hypertension (ORCC=2.22, 95%CI: 0.94-5.20) this
showed a statistically significant increase in the risk with complete-case analysis, however, these associations attenuated after MI: a relation when all maternal family have hypertension (aORCC=2.64, 95%CI: 1.14-6.09; aORMI=1.17, 95%CI: 0.73-1.88) and when more than 3
family members have hypertension (aORCC=1.68, 95%CI: 1.06-2.67; aORMI=1.18, 95%CI:
0.85-1.64).
Conclusions
Missingness was found to be associated with lower socio-economic and whom the adolescent resides with, thus showing that when researchers design their studies, they should target these groups in order to prevent nonresponse. Further, the sensitivity analysis showed relevant changes in the association between the risk of adolescent’s high blood pressure and family history of the disease. In general, the complete-case analyses showed statistically significant or almost significant increase in risk but these associations were attenuated after MI.
Portuguese
Introdução
Os dados em falta são um problema inevitável em epidemiologia. Estes condicionam a validade e generalização dos resultados, devido à presença de viés de selecção, perda de poder estatístico e precisão introduzidos pela redução do tamanho da amostra. Assim, é importante determinar se casos completos e incompletos diferem sistematicamente no sentido de orientar a selecção do método estatístico mais apropriado para lidar com dados em falta.
Objectivos
Analisar os determinantes de dados em falta, numa coorte de base populacional com adolescentes urbanos, num questionário auto-administrado. Comparar dois métodos, casos completos e imputação múltipla, no tratamento de dados em falta na análise da associação entre o risco de tensão arterial alta de um adolescente, e história familiar da doença.
Métodos
Os dados correspondem à primeira avaliação dos participantes da coorte EPITeen. Analisaram-se padrões e determinantes de não resposta, utilizando regressões logísticas simples e múltiplas. Para análise de dados completos utilizou-se o SPSS e, para a de imputação múltipla, usou-se o procedimento MICE de R através da criação de 20 bases de dados imputados. As associações foram avaliadas por odds ratio (OR) bruto e ajustado e o respectivo intervalo de confiança de 95% (CI95%).
Resultados
O nível sócio económico e com quem o adolescente reside, revelaram-se determinantes de não resposta. Particularmente, uma associação negativa foi encontrada com o aumento de escolaridade dos pais (OR=0.21, CI95%: 0.15-0.28 para educação superior a 12 anos comparado com menos de 5 anos) e quando o adolescente reside com ambos os pais (OR=0.41, CI95%: 0.29-0.57).
Um aumento quase significativo no risco de tensão arterial alta de um adolescente e da história familiar da doença, com analises com casos completos (ORCC=2.22, 95%CI:
0.94-5.20), esta associação tornou-se estatisticamente significativa com imputação múltipla (ORMI=1.93, 95%CI: 1.12-3.31). Os outros modelos mostraram um aumento,
estatisticamente significativo no risco de tensão arterial alta e da história familiar da doença, com as analises com casos completos, quando toda a família materna tem hipertensão
(aORCC=2.64, CI95%: 1.14-6.09) e quando mais de 3 membros da família têm hipertensão
(aORCC=1.68, CI95%: 1.06-2.67). No entanto, estas associações foram atenuadas após a
análise com imputação múltipla.
Conclusões
A não resposta foi associada com baixo nível sócio económico e com quem o adolescente reside, apontando a necessidade de no desenho de estudos com adolescentes os investigadores centrarem a atenção na definição de estratégias que evitem dados em falta direccionadas para estes grupos. Uma associação entre o risco de um adolescente ter tensão arterial alta e história familiar da doença foi demonstrada na análise de sensibilidade. Em geral, a análise de casos completos mostrou um aumento estatisticamente significativo ou quase significativo no risco, mas estas associações foram atenuadas após imputação múltipla.
Introduction
Epidemiology allows for the study of distributions and determinants of health related states along with events in specific populations. As most studies rely on data collected by questionnaire or interview (face to face, telephone or computer assisted) or are extracted from existing records such as hospital records, personnel records (e.g. in occupational studies) or death certificates, missing values are an inevitable problem. That is, information is missing about the event researchers wish to study, which can hinder one’s ability to explain and understand said occurrence (1). In general, missing data may pose a threat to the validity and generalizability of study results. This occurs as a result of selection bias and loss of statistical power and precision when the sample size is reduced (1, 2). Consequently, it is important to conduct sensitivity analyses to explore the soundness of study conclusions when missing values exist. Further, understanding and describing the origins of missing values and the missing mechanisms based on the statistical relations associated with missingness is essential in order to define the nature and extent of the problem of missing data and to determine how missing data should be handled (3).
Although problems of missing data and methods for handling missing data have been widely discussed in statistical literature, there are not many resources written in a non-technical manner for epidemiological researchers (2). Much research has addressed the replacement or “imputation” of missing items in questionnaires; however, less attention has been paid to identifying their type and their determinants. Further, it has been repeatedly shown that the best way for dealing with missing data is to minimize their amount, i.e. to prevent them. Therefore, a detailed understanding of their determinants is required to devise appropriate prevention strategies. Previous studies have suggested that determinants of missing data are multiple and diverse, and may be related to socio-demographic (sex, age, educational level, marital status, etc.) or health status (some diseases or impairments, fatigue, etc.) (4-6). Finally, epidemiology researchers do not often directly address the treatment of missing data when performing analyses. This is important as using an appropriate method to handle cases with missing data when performing analyses will reduce bias and aid to reach valid conclusions for target populations (7).
In an ideal world, all participants included in the sample would provide adequate responses to questions that are applicable to them and their answers would be accurately recorded and processed. In reality, this seldom occurs. Often, participants may skip or refuse to answer a
question, known as item nonresponse or fail to respond to the entire questionnaire, known as unit nonresponse (8). The problem created is missing data, which leads to a decrease in the statistical power of studies (by reducing sample size), may cause biases due to systematic differences between respondents and nonrespondents and selection bias if observations with missing values are excluded from the analysis (1).
Origins of Missing Data
Item Nonresponse
Item nonresponse occurs most frequently during self-administered questionnaires, when a participant completes part of a survey but leaves some individual questions blank or fails to complete some parts of the questionnaire. This type of missing value may occur for a variety of reasons: a participant did not see or understand a question, a participant skipped a question but then forgot to come back to it, the topic is uncomfortable or the participant fears a negative outcome from their response, or a question was asked in such a way that a participant was unable to respond. Also, long questionnaires pose additional problems; as participants may not respond to some questions, particularly those near the end due to slow reading or loss in interest (9).
Other types of research may also be affected by item nonresponse, these include measurements; it is possible that data values are lost during collection, storage process or through some kind of contamination. It is also possible that data is not collected due to equipment malfunction or the person responsible for collecting data simply forgot to obtain that particular measurement (10).
Item nonresponse means that partial data are available for the subjects and researchers could use available responses for a reasonable estimate of missing responses for certain items, that is, perform imputation (8-11).
Unit Nonresponse
Unit nonresponse occurs when a participant fails to complete all items in a particular questionnaire or does not return a questionnaire. That is, no data are collected for that particular participant. Consequently, it would be necessary to exclude the participant from the study (8, 9, 11).
Missing Data Mechanisms
One of the main questions when confronted with missing data is the type of missingness. These mechanisms have been extensively defined by Little and Rubin: 1) missing completely at random (MCAR), 2) missing at random (MAR), and 3) missing not at random (MNAR) (12). The main problem with missing mechanisms is that it is not straightforward to determine missingness directly from the study data. Although, it is possible to distinguish between MCAR and MAR, it is very difficult to distinguish between MNAR and MAR, unless a researcher has vast experience in the area or access to information that participants did not provide. Missing data mechanisms generate biases and are important in order to determine how missing data should be handled (13, 14). The figure (Figure 1) seen below assists in differentiating between the three mechanisms:
Missing Completely at Random (MCAR)
MCAR occurs when the missing value does not depend on outcome and covariates, observed or not, that is, missing values are randomly distributed across all participants (13). The MCAR assumption can be assessed by comparing the missing proportion among observed variables, if no significant differences are found with respect to the variables, then there is no apparent evidence that the data are representative of only participants with complete data. However, it is generally not possible to test if the probability of missingness is a result of the missing value itself. Therefore, researchers frequently make the MCAR assumption if the reason for missing values is clearly unrelated to any study variables. Because the MCAR mechanism reflects the highest degree of randomness and shows no underlying pattern for missing data that would potentially bias research findings, estimates from most standard analyses, such as complete-case analyses, are unbiased and normally acceptable. However, there would likely be a loss of statistical power as a result of smaller sample size (8, 15, 16).
There are several reasons why data may fall under the MCAR assumption. They may be missing because equipment malfunctioned, participants or researchers got sick, or the data were not entered correctly (16). For example, if researchers were unavailable for a day to conduct physical examinations on participants, data would presumably be MCAR. That is, any piece of data for a participant is just as likely to be missing as any other piece of data for another participant.
Missing at Random (MAR)
MAR occurs when the probability of a missing value may depend only on observed data but it is independent of the underlying value that is missing (13). MAR normally has some randomness to the pattern of missing data, that is, the probability of a participant having incomplete data on a variable can be explained by other variables in the study, however the presence of missing values on a variable is not related to the participants’ true status on the missing variable (12, 15).
Although the missing data may have a systematic pattern, we are unable to determine it as it may depend on factors for which we do not have data (i.e. characteristics not studied). Therefore, even though it is impossible to strictly test the MAR assumption, researchers are recommended to use their own discretion to determine the missing mechanism. A complete-case analysis with MAR leads to biased conclusions, therefore the use of imputation or propensity methods for analysis is recommended to solve the problem (15, 16).
Acock (2005) uses the example of missingness in a study of maternal depression, where mothers may refuse to answer questions about their level of depression. If the probability of refusing to answer the question is related to poverty but is unrelated to depression within each level of poverty, then the missing values are MAR. That is, the MAR mechanism is not whether poverty can predict maternal depression, but whether poverty is a mechanism to explain whether a mother will or will not report her depression level (17).
Missing Not at Random (MNAR)
MNAR, also known as ignorable, occurs when missing values dependent on non-observed data even after conditioning of all the non-observed information, that is, any systematic differences between observed and non-observed values cannot be explained by differences in observed data (13). Consequently, the researcher must incorporate the missing mechanism through a joint model to obtain valid conclusions. A complete-case analysis leads to biased conclusions and imputation methods will not solve the problem. Therefore, a sensitivity analysis may be done in which the researcher makes some assumptions (8, 12). For example, if people with low income were less likely to report their income than people with higher income, missingness could presumably be predicted by income, however, we would not know the income of those with missing data. Consequently, a missingness model would be study specific and difficult to determine (16).
Consequences of Missing Data
Missing data can lead to problems that affect the interpretation and inferences of research results, the understanding and explanation of conclusions made, the strength of the study design, the validity of conclusions about relationships between variables and may limit the representativeness of the sample.
Reliability (i.e. consistency, or reproducibility) and validity (i.e. accuracy, or generalizability) of study conclusions can be affected by missing data. These are related to internal validity, which is defined as the degree to which a study is free from bias or systematic error. Internal validity depends on the soundness of the study design, conduct and analysis in answering what was aimed, methods and on substantive knowledge (1, 18). In turn, external validity, also known as generalizability, is related to internal validity. Generalizability is “the degree to which results of a study may apply, be relevant, or be generalized to populations or groups that did not participate in the study. In etiological research, such inferences to an external
population are not merely statistical in nature but must be based on theory, judgement, and evidence external to the study.” (18).
Missing data may result in a small and potentially biased sample of participants in which case there may be differences between participants and nonparticipants (i.e. unit nonresponse) and completers and non-completers (i.e. item nonresponse). This results in differences in characteristics between groups which leads to selection bias and an unrepresentative sample which in turn influences study conclusions and decreases internal and external validity. A smaller sample size is also related to statistical power, when data analysis is conducted, there would be a decrease in statistical power. Further, as many analyses assume particular distributions for data, missing values may violate these assumptions, which in turn affect statistical conclusions and decrease internal and external validity by affecting the accuracy of conclusions about associations between variables (2). Overall, the generalizability of results is affected by missing data in measurements, sample selection, randomization, participant attrition, and data analysis (related to sample sizes) which leads to difficulty in statistical inference and interpretation of findings, inaccurate knowledge base and misinformed and possible misleading conclusions (2, 19).
Approaches for Dealing with Missing Values for Data Analysis
There are many approaches to dealing with missing data, however, researchers do not always put these intro practice. A review by Eekhout et al. showed that in 262 studies having missing data, the type of missing data could not be clearly defined in 46%. Most studies (81%) performed a complete-case analysis and 14% used a single imputation technique, such as mean imputation, single regression or last observation carried forward. More advanced methods such as multiple imputation (MI), maximum likelihood estimation and inverse probability weighting, which assume that data are MAR, were reported in 8%, 2% and 3% of the studies, respectively (7).
The most common approach is to simply exclude individuals with missing data for relevant variables. This is known as complete-case or available-case analysis but is only valid when data are MCAR but not necessarily when MAR. Alternative methods include simple and multiple imputation (12).
Complete-Case Analysis
A complete-case analysis, also known as listwise deletion, excludes cases from the analysis if any of the variables under consideration have missing values. This is the simplest and most frequently used method and is a common default in most computer programs for many standard forms of statistical analyses. If there are missing values for many of the variables, and different participants have values missing on different variables, listwise deletion will only include a small proportion of the original study sample (20). As the sample size decreases by deleting observations with missing values, power to detect differences and precision of estimates will be reduced, and there will be an increase of bias, particularly when data are not MAR (12, 15, 16). That is, if the set of participants with complete data is systematically different from the excluded group of participants, then statistics will be biased estimates of population parameters. One benefit to listwise deletion is that a common base (the set of participants with complete data) is used for estimating all basic statistics. However, if many separate analyses are performed, these would be conducted on different sample sizes based on the subset of variables included in the particular analysis, making comparisons of results difficult (9).
Available-Case Analysis
Available-case analysis, also known as pairwise deletion, uses all available data to compute each statistic. In other words, different observations may be used in obtaining different statistics so that the number of cases varies from one analysis to the next. This technique reduces statistical power and increases the risk of bias (12, 14, 15). This is also a standard option in most popular computer programs when computing statistical analyses among a set of variables. One benefit to pairwise deletion is that all possible information represented in the non-missing values are used when estimating basic statistics, including means, standard deviations and correlations. The problem with this approach is that the parameters of a model are based on different sets of data, with different sample sizes and different standard errors, thus, achieving a valid numerical summary that accurately reflects the entire sample is almost impossible (16).
Simple Imputation
A group of techniques for handling missing data involves imputation, where a researcher replaces a missing value with a single estimate (simple imputation). Single imputation requires at least MAR assumption; otherwise potential bias may arise (8).
A major strength of simple imputation methods is that it creates a single, complete data set on which all analyses can be performed and allows for a single set of results to be described and interpreted. Further, because no observations are deleted from the data set, simple imputation maximizes power by maintaining all participants (9). Although simple imputation methods are usually easy to implement, the representativeness of the single data set is the outcome of a single imputation step. As a result, analyses of simple imputation data often produce estimated standard errors and significant tests with p-values that are too small and confidence intervals that are too narrow. A possible solution to this problem is to perform MI (14). Finally, simple imputation methods require the researcher to have an idea about the types of relations among variables expected, in order for the imputation process to reflect the trends in the data (9).
Several commonly used techniques for simple imputation include: mean imputation (16, 20), predictive mean or regression imputation (20), hot-deck imputation (16, 21, 22), and last observation carried forward imputation (16, 23).
Multiple Imputation
MI replaces a missing value with multiple estimates. The method was first introduced by Rubin (24) to take into account uncertainty from imputation, which is unaccounted for in simple imputation methods.
The imputation model must incorporate all variables to be included in analysis, the outcome variable, confounders, and any variables that explain missing values. With MI, missing data are replaced by data from imputation models, which are generated on the basis of existing data. Imputation models are models where partially observed variables are responses and fully observed variables or partially observed with filled-in values are independent. Then the missing values are replaced using the models, the respective parameter estimates and adding random error to each imputed valued, thus, each time we impute data, a slightly different result is obtained. The imputed values are derived for the missing observations and MI repeats the process deriving revised parameter estimates and imputing new values until it stabilizes. This is the first imputed data set. This is repeated M times, as a rule 20 or more times, generating the respective completed data sets. Because of the randomness in the
process, each data set and results from analysis will differ slightly. The final set of estimates is generated by averaging the estimates as per Rubin’s Rules (14, 16, 25).
The variance of the estimates is composed of two parts: 1) variation within the imputation, 2) variation between imputations. For a parameter of interest, Q, the overall estimate of MI from M estimates of Q is: ∑ ̂. The associated total variance of the overall MI estimate is: ( ) , where ∑ is the estimated within imputation variance and
∑ ( ̂ ) is the between imputation variance. If the within imputation variance is higher, more imputations are necessary, while if the between imputation variance is higher it is not necessary to do more imputations (25).
MI adjusts for differences between non-respondents and respondents on variables observed for both and included in the imputation process, as well as differences on variables not included in the model that are predicted by the model; these adjustments are not made when using other methods. MI attempts to retain the advantage of simple imputation while taking into account the uncertainty due to imputation (16, 25). Software used for MI allows researchers to obtain descriptive statistics, other statistical measures and analyses.
Aim of the Study
The EPITeen Cohort of 1990 started in the academic year of 2003/2004 and participants were adolescents born in 1990 attending public and private schools in Porto, Portugal. The project is the first of its kind ever-held in Portugal, and the analyses of data collected intend to provide answers to many scientific questions and essential information needed for planning of preventive measures suitable to the Portuguese population (26).
The present study was carried out comprising data collected at the baseline of the EPITeen project. It aims to investigate the pattern and determinants of nonresponse, and to assess the potential impact of nonresponse. It focuses on socio-economic and family composition characteristics of the adolescents as determinants for nonresponse. Another aim was to examine the effect of two methods to deal with missing data, specifically complete-case analysis and MI, on the study of the association between an adolescent’s risk of high blood pressure and family history of hypertension.
References
1. Rothman K, Lask T, Greenland S. Modern Epidemiology. 3rd ed. Priladelphia: Lippincott Williams & Wilkins; 2012.
2. McKnight PE, McKnight KM, Sidani S, Figueredo AJ. Missing Data: A Gentle Introduction. New York: The Gilford Press; 2007.
3. Donders AR, van der Heijden GJ, Stijnen T, Moons KG. Review: a gentle introduction to imputation of missing values. Journal of clinical epidemiology. 2006;59(10):1087-91. doi: 10.1016/j.jclinepi.2006.01.014.
4. Hille ET, Elbertse L, Gravenhorst JB, Brand R, Verloove-Vanhorick SP. Nonresponse bias in a follow-up study of 19-year-old adolescents born as preterm infants. Pediatrics. 2005;116(5):e662-6. doi: 10.1542/peds.2005-0682.
5. Peyre H, Coste J, Leplege A. Identifying type and determinants of missing items in quality of life questionnaires: Application to the SF-36 French version of the 2003 Decennial Health Survey. Health and quality of life outcomes. 2010;8:16. doi: 10.1186/1477-7525-8-16.
6. Coste J, Quinquis L, Audureau E, Pouchot J. Non response, incomplete and inconsistent responses to self-administered health-related quality of life measures in the general population: patterns, determinants and impact on the validity of estimates - a population-based study in France using the MOS SF-36. Health and quality of life outcomes. 2013;11:44. doi: 10.1186/1477-7525-11-44.
7. Eekhout I, de Boer RM, Twisk JW, de Vet HC, Heymans MW. Missing data: a systematic review of how they are reported and handled. Epidemiology (Cambridge, Mass). 2012;23(5):729-32. doi: 10.1097/EDE.0b013e3182576cdb.
8. Schafer JL, Graham JW. Missing Data: Our View of the State of the Art. Psychological Methods. 2002;7(2):147-77.
9. Widaman KF. III. MIssing Data: What to do with or without them. Monographs of the Society for Research in Adolescent Development. 2006;71(3):42-64.
10.Graham JW. Missing Data: Analysis and Design. New York: Springer Science+Business Media; 2012.
11.Brick JM, Kalton G. Handling missing data in survey research. Statistical methods in medical research. 1996;5(3):215-38.
12.Little RJA, Rubin DB. Statistical Analysis with Missing Data. 2nd ed. New York: Wiley-Interscience; 2002.
13.Sterne JAC, White IR, Carlin JB, Spratt M, Royston P, Kenward MG, et al. Multiple imputation for missing data in epidemiological and clinical research: potential and pitfalls. BMJ. 2009;338. doi: 10.1136/bmj.b2393.
14.Raghunathan TE. What do we do with missing data? Some options for analysis of incomplete data. Annual review of public health. 2004;25:99-117. doi: 10.1146/annurev.publhealth.25.102802.124410.
15.Musil CM, Warner CB, Yobas PK, Jones SL. A comparison of imputation techniques for handling missing data. Western journal of nursing research. 2002;24(7):815-29.
16.Howell DC. The analysis of missing data. In: Outhawaite W, Turner S, editors. Handbook of Social Science Methodology. London: Sage; 2008.
17.Acock AC. Working With Missing Values. Journal of Marriage and Family. 2005;67(4):1012-28. doi: 10.1111/j.1741-3737.2005.00191.x.
18.Porta M. A Dictionary of Epidemiology. 4th ed. New York: Oxford University Press; 2008. 19.Ange BA, Symons JM, Schwab M, Howell E, Geyh A. Generalizability in epidemiology: an
investigation within the context of heart failure studies (Abstract). Annals of Epidemiology. 2004;14(8):600-1.
20.Penny KI, Atkinson I. Approaches for dealing with missing data in health care studies. Journal of clinical nursing. 2012;21(19-20):2722-9. doi: 10.1111/j.1365-2702.2011.03854.x.
21.Twisk JWR. Applied Longitudinal Data for Epidemiology: A Practical Guide. Cambridge: Cambridge University; 2003.
22.Twisk J, de Vente W. Attrition in longitudinal studies. How to deal with missing data. Journal of clinical epidemiology. 2002;55(4):329-37.
23.Cook RJ, Zeng L, Yi GY. Marginal analysis of incomplete longitudinal binary data: a cautionary note on LOCF imputation. Biometrics. 2004;60(3):820-8. doi: 10.1111/j.0006-341X.2004.00234.x.
24.Rubin DR. Multiple Imputation for Nonresponse in Surveys. New York: John Wiley & Sons; 1987.
25.Marshall A, Altman DG, Holder RL, Royston P. Combining estimates of interest in prognostic modelling studies after multiple imputation: current practice and guidelines. BMC medical research methodology. 2009;9:57. doi: 10.1186/1471-2288-9-57.
26.Ramos E. Health Determinants in Porto Adolescents: The EPITeen Cohort. Porto: University of Porto; 2006.
Manuscript 1: Determinants of Nonresponse in a Cohort of
Urban Adolescents - EPITeen Cohort
Abstract
Introduction
Previous studies have suggested that determinants of missing data are multiple and diverse, and may be related to participants characteristics.
Objective
To examine determinants of missingness in a self-administered questionnaire developed for 13-year-old urban adolescents as part of a population-based cohort.
Methods
Participants were assessed at the baseline evaluation of the EPITeen cohort. Patterns and determinants of nonresponse for a total of 55 items, which provided parental socio-demographic information, adolescent’s free-time activities and family history of disease, were studied. The items were divided into 5 sections: adolescent, mother, father, maternal grandparents and paternal grandparents. Associations were evaluated by crude and adjusted odds ratio (OR) and the respective 95% confidence interval (95%CI) calculated using simple and multiple logistic regression models.
Results
The prevalence of more than 50% of items missing ranged from 15.1% (adolescents’ section) to 49.9% (paternal grandparents’ section).
More than 50% missingness was negatively associated with increasing parental education (OR=0.21, 95%CI: 0.15-0.28 higher than 12 years compared with less than 5 years), the adolescent living with both parents (OR=0.41, 95%CI: 0.29-0.57) and attending a private school (OR=0.35, 95%CI: 0.28-0.43); positively associated with not living with either parent (OR=3.37, 95%CI: 2.13-5.34), not knowing whom the adolescent lives with (OR=3.08, 95%CI: 2.23-4.26) and living in a home with more than 2 people/bedroom (OR=3.07, 95%CI: 1.88-5.01). After adjustments, parental education, attending a private school and residing with both parents remained statistically significant.
Conclusion
Missingness was found to be associated with lower socio-economic status and whom the adolescent resides with, thus showing that when researchers design their studies, they should target these groups in order to prevent item nonresponse.
Introduction
A well-known problem in research fields, namely in population based studies, is nonresponse. In an ideal world, all participants included in the sample would provide adequate responses to questions that are applicable to them and their answers accurately recorded and processed. In reality, this seldom occurs. Often, participants fail to respond to the entire questionnaire, known as unit nonresponse or fail to answer one or more questions, known as item nonresponse (1-4). The problem created is missing data which leads to a decrease in the statistical power of studies (by reducing sample size), may cause biases due to systematic differences between respondents and nonrespondents and selection bias if observations with missing values are excluded from the analysis (1-4).
One of the main questions when confronted with missing data is the type of missingness. These mechanisms have been defined by Little and Rubin (5): 1) missing completely at random (MCAR) occurs when the missing value does not depend on outcome and covariates, observed or not, that is, missing values are randomly distributed across all participants; 2) missing at random (MAR) occurs when the probability of missing may depend only on observed data; and 3) missing not at random (MNAR) occurs when missing values depend on non-observed data even after conditioning of all the observed information, that is, any systematic differences between observed and non-observed values cannot be explained by differences in observed data (4-6). The MNAR type is difficult to identify because the true value of the missing value is unknown (5, 7). It is important to know the types and causes of missing data when selecting a missing data treatment, because these affect the performance of any treatment (4, 6).
In the case of nonresponse in questionnaires, it is very difficult to distinguish between MNAR and MAR (5, 7) Although much research has addressed the replacement or “imputation” of missing items in questionnaires, less attention has been paid to identifying their type and their determinants. It has been repeatedly shown that the best way for dealing with missing data is to minimize their amount, i.e. to prevent them. Therefore, a detailed understanding of their determinants is required to devise appropriate prevention strategies (8). Previous studies have suggested that determinants of missing data are multiple and diverse, and may be related to socio-demographic (sex, age, educational level, marital status, etc.) or health status (some diseases or impairments, fatigue, etc.) (9-15).
The EPITeen (Epidemiological Health Investigation of Teenagers in Porto) Cohort is a large representative sample of Porto teenagers, which included a total of 2160 students who
completed two self-administered questionnaires (one completed at home and the other at school). The information obtained was used to investigate social and demographic characteristics, family and personal history of diseases and behaviours.
The aim of this analysis is to investigate the pattern and determinants of nonresponse, to assess the potential impact of nonresponse bias and the possible adjustments necessary. It will focus on the socio-demographic and family composition characteristics of the participants as determinants for nonresponse.
Materials and Methods
The EPITeen Cohort began in 2003/2004 with adolescents born in 1990 who studied in public and private schools of the city of Porto, Portugal. At the baseline evaluation, 2788 adolescents were identified as eligible and a total of 2160 students (1651 from public and 509 from private schools) agreed to participate and provided information for at least part of the assessment, which included two self-administered questionnaires and a physical examination. This resulted in a 77.5% overall participation rate, similar in public and private schools (77.7% vs. 70.0%, p=0.709) (16). Information on the characteristics of the adolescents and the family namely demographic, social, and behavioural, as well as information on perinatal circumstances and the overall medical history and medical care use was obtained through a structured questionnaire completed by the adolescents, at home, with help from parents or guardians. A second questionnaire was completed at school by the adolescent, which included questions about physical activity, smoking and alcohol intake. Finally, a physical examination was performed at schools and included measurements of anthropometry, blood pressure, lung function and bone mineral density (16).
The questionnaire completed at school comprised of 45 questions and the one completed at home of 70 questions. Table 1 shows the selected 16 questions (with a total of 55 items) from the questionnaire completed at home. These were divided into 5 sections as per whom they related to: adolescent (2 questions with a total of 9 items), mother (5 questions with a total of 13 items), father (5 questions with a total of 13 items), maternal grandparents (2 questions with a total of 10 items) and paternal grandparents (2 questions with a total of 10 items) (Table 1). Each item was redefined as missing or not missing. A section was considered incomplete if more than half of the items were missing (“half item rule”) (10, 11, 17).
From the total of 55 items, 28 had the option to reply “Don’t know”. When the participant cannot, or does not want to, give a valid answer, (s)he may decide to respond with a ‘don’t
know’ response. Although “Don’t know” was offered as a legitimate reply, it was coded as “missing” for the purpose of this study.
The following variables were considered to be possible determinants for incomplete sections: demographic and socio-economic variables (parents’ educational level according to the parent with the highest completed grade, school attended, number of people/bedroom in the household), adolescent’s gender, mother’s and father’s age. Who helped the adolescent complete the at home questionnaire was also used and was supplemented by who the adolescent resides with if the precedent variable was missing (if the adolescent resides with the mother or father or other people, the variable was recoded accordingly, if neither variable was provided or the adolescent lived with both parents, the variable was left as unknown). Simple and multiple logistic regression models were constructed to identify the determinants of incomplete sections. In these models, the dependent variable was having more than 50% missing items. An analysis was also done combining the 5 sections together; the same dependent variable was used, having more than 50% missing items. The variables considered as possible determinants for missing items were tested as predictor variables. Variables associated with the risk of missingness in crude analyses were used for adjusted analyses, and entered into the final models.
The statistical analysis was performed with IBM x Statistics for Macintosh, version 20 (Armonk, NY: IBM Corp.).
Results
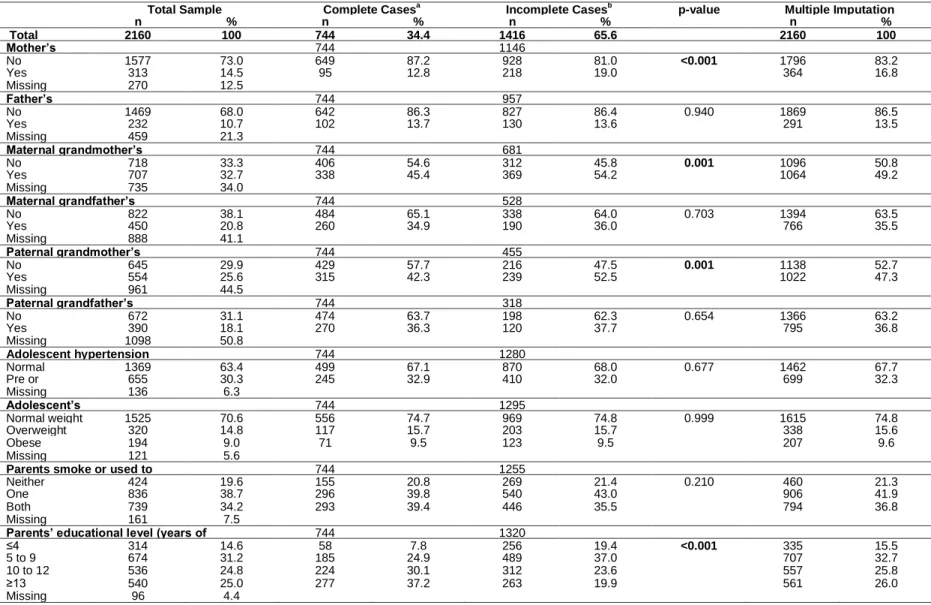
The participants’ characteristics are presented in Table 2. A number of determinants had a substantial amount of missing data; specifically, mother’s age (8.3%), father’s age (12.1%), and number of people/bedroom in the household (8.5%).
The lowest prevalence of more than 50% of items missing was found for the questions in the adolescent’s section (15.1%), contrariwise, the sections regarding grandparents’ data
present the higher prevalence of missing, especially the paternal grandparents’ section
(49.9%).
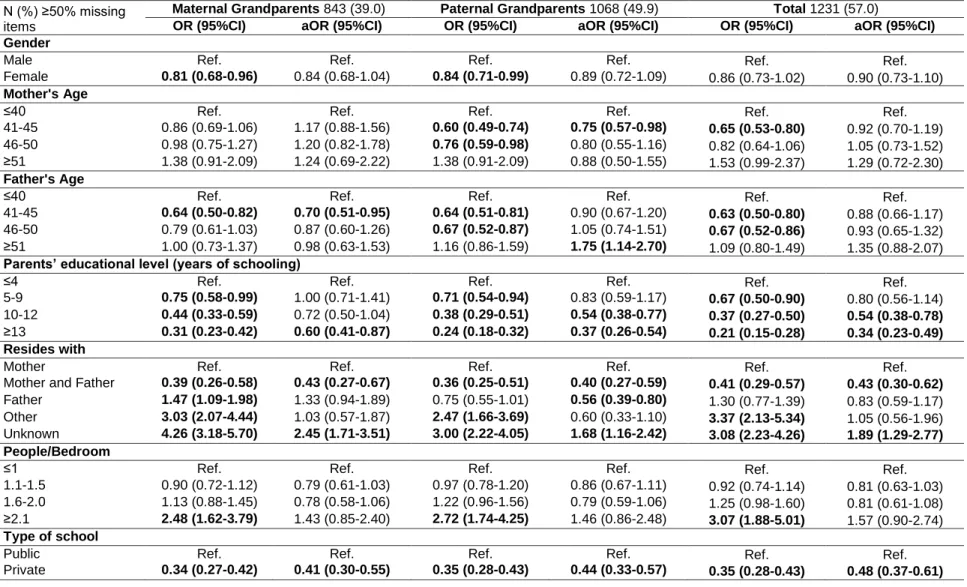
Simple and multiple logistic regressions are shown in Table 3 for the adolescent’s, mother’s, father’s, maternal grandparents’ and paternal grandparents’ sections and total items. For the adolescent’s section, more than 50% missingness was negatively associated with the adolescent being female (OR=0.63, 95%CI: 0.50-0.80), increasing parental education (OR=0.64, 95%CI: 0.43-0.95 for 10-12 years and OR=0.51, 95%CI: 0.34-0.78 for higher than
12 years compared with less than 5 years), residing with both of the parents (OR=0.15, 95%CI: 0.05-0.47) and attending a private school (OR=0.56, 95%CI: 0.41-0.77). While missingness was positively associated with not residing with either parent (OR=3.40, 95%CI: 2.22-5.21) and when this variable is unknown (OR=7.33, 95%CI: 5.41-9.92). After adjustments, gender and whom the adolescent resides with remained statistically significant. For the mother’s section, more than 50% missingness was negatively associated with the female gender (OR=0.65, 95%CI: 0.52-0.82), increasing parental education (OR=0.58, 95%CI: 0.42-0.81 for 5-9 years, OR=0.46, 95%CI: 0.32-0.65 for 10-12 years and OR=0.31, 95%CI: 0.21-0.46 for higher than 12 years compared with less than 5 years), residing with both parents (OR=0.10, 95%CI: 0.02-0.41), living in a home with 1.1-1.5 people/bedroom (OR=0.66, 95%CI: 0.49-0.88) and attending a private school (OR=0.52, 95%CI: 0.39-0.71). While missingness was positively associated with residing with the father (OR=2.22, 95%CI: 1.51-3.25), residing with neither parent (OR=9.92, 95%CI: 6.68-14.73) and when this variable is unknown (OR=9.27, 95%CI: 6.85-12.56), and living in a home with more than 2 people/bedroom (OR=1.94, 95%CI: 1.23-3.07). After adjustments, gender, whom the adolescent resides with, the number of people/bedroom in the home and school attended remained statistically significant.
For the father’s section, more than 50% missingness was negatively associated with being female (OR=0.76, 95%CI: 0.63-0.93), increasing parental education (OR=0.69, 95%CI: 0.52-0.92 for 5-9 years, OR=0.47, 95%CI: 0.34-0.64 for 10-12 years and OR=0.31, 95%CI: 0.22-0.44 for higher than 12 years compared with less than 5 years), residing with both parents (OR=0.04, 95%CI: 0.01-0.17) and the father (OR=0.55, 95%CI: 0.36-0.85), living in a home with 1.1-1.5 people/bedroom (OR=0.69, 95%CI: 0.54-0.89) and attending a private school (OR=0.47, 95%CI: 0.36-0.61). More than 50% missingness was positively associated with the adolescent residing with neither parent (OR=5.19, 95%CI: 3.53-7.61) and when this variable is unknown (OR=4.30, 95%CI: 3.24-5.70), and living in a home with more than 2 people/bedroom (OR=2.04, 95%CI: 1.33-3.13). After adjustments, gender, increasing educational level, whom the adolescent resides with, the number of people/bedroom in the home and school attended remained significant.
For the maternal grandparents’ section, more than 50% missingness was negatively associated with female participants (OR=0.81, 95%CI: 0.68-0.96), the father’s age being between 41 and 45 (OR=0.64, 95%CI: 0.50-0.82), increasing parental education (OR=0.75, 95%CI: 0.58-0.99 for 5-9 years, OR=0.44, 95%CI: 0.33-0.59 for 10-12 years and OR=0.31, 95%CI: 0.23-0.42 for more than 12 years compared with less than 5 years), residing with both parents (OR=0.39, 95%CI: 0.26-0.58) and attending a private school (OR=0.34, 95%CI: 0.27-0.42). More than 50% missingness was positively associated with residing with the
father (OR=1.47, 95%CI: 1.09-1.98), neither parent (OR=3.03, 95%CI: 2.07-4.44) and when this variable is unknown (OR=4.26, 95%CI: 3.18-5.70), and living in a home with more than 2 people/bedroom (OR=2.48, 95%CI: 1.62-3.79). After adjustments, father’s age, parents’ educational level, whom the adolescent resides with and school attended remained significant.
For the paternal grandparents’ section, more than 50% missingness was negatively associated with female adolescents (OR=0.84, 95%CI: 0.71-0.99), the mother’s age being between 41-45 and 46-50 (OR=0.60, 95%CI: 0.49-0.74 and OR=0.76, 95%CI: 0.59-0.98, respectively), the father’s age being between 41-45 and 46-50 (OR=0.64, 95%CI: 0.51-0.81 and OR=0.67, 95%CI: 0.52-0.87, respectively), increasing parental education (OR=0.71, 95%CI: 0.54-0.94 for 5-9 years, OR=0.38, 95%CI: 0.29-0.51 for 10-12 years and OR=0.24, 95%CI: 0.18-0.32 for more than 12 years compared with less than 5 years), living with both parents (OR=0.36, 95%CI: 0.25-0.51) and attending a private school (OR=0.35, 95%CI: 0.28-0.43). While missingness was positively associated with not residing with either parent (OR=2.47, 95%CI: 1.66-3.69) and when this variable is unknown (OR=3.00, 95%CI: 2.22-4.05), and living in a home with more than 2 people/bedroom (OR=2.72, 95%CI: 1.74-4.25). After adjustments, gender, mother’s age, increasing educational level, whom the adolescent resides with and school attended remained significant. Further, the father’s age being over 50 became positively associated with missingness (aOR=1.75, 95%CI: 1.14-2.70).
Finally, for the total items, more than 50% missingness was negatively associated with increasing parental education (OR=0.67, 95%CI:0. 50-0.90 for 5-9 years, OR=0.37, 95%CI: 0.27-0.50 for 10-12 years and OR=0.21, 95%CI: 0.15-0.28 for higher than 12 years compared with less than 5 years), residing with both parents (OR=0.41, 95%CI: 0.29-0.57) and attending a private school (OR=0.35, 95%CI: 0.28-0.43). While missingness was positively associated with residing with neither parent (OR=3.37, 95%CI: 2.13-5.34) and when this variable is unknown (OR=3.08, 95%CI: 2.23-4.26), and living in a home with more than 2 people/bedroom (OR=3.07, 95%CI: 1.88-5.01). After adjustments, parents’ educational level, whom the adolescent resides with and school attended remained significant.
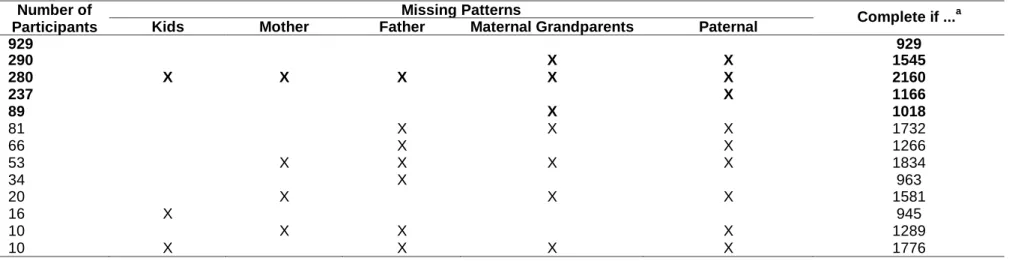
Table 4 shows the tabulated patterns grouped by missing values patterns, i.e. how data tend to be missing for multiple sections. There were 5 main missing value patterns found. The first includes those participants who have less than 50% missingness for all sections and would only include 929 (43.0%) participants in an analysis; the second pattern includes 290 (13.4%) participants who have a pattern of more than 50% missingness for the maternal grandparents’ and paternal grandparents’ sections, together. The third pattern includes 280 (13.0%) participants who have more than 50% missingness for all sections. The following
patterns have 237 (11.0%) and 89 (4.1%) participants, which have more than 50% missingness for the paternal grandparents’ and maternal grandparents’ sections, respectively. There were other patterns of missingness, however as these only occurred a few times, they are not described here.
Discussion
Studies conducted in children and adolescents show that although consent obtained is high (ranging from 63% to 94.5%), only less than half of the data returned is reliable and complete (9, 15, 18). This is in line with overall participation rates in adult populations, which range from 74.0% to as high as 86.0%, however, less than half of the subjects provided complete and consistent data (11, 19-21). In this large representative sample of adolescents from Porto, Portugal, the overall participation was high, but almost all items had missing values. In particular, the sections analyzed here, had a high percentage of missings, 57.0% of the participants had more than 50% missing items.
Child and adolescent studies rely on consent and participation from the parents. In particular, the EPITeen baseline data collection was conducted through adolescents at school and a questionnaire sent home. The decision to consent and participate in the study relied on both the adolescent and parents; consequently missingness and nonparticipation may be higher as it is dependent on the responsibility of more than just the participant.
Our study showed that increasing parental education level, attending a private school and living in a home with less than 2 people/bedroom, all indicators of higher socio-economic status were negatively associated with more than 50% missing items. While living in a home with more than 2 people/bedroom, an indicator of lower socio-economic status was positively associated with more than 50% missing items. Our results confirm earlier findings that low education and low socio-economic status, are determinants of missingness (9-12, 14, 15, 18-20).
Although the questionnaire was carefully constructed and tested in a pilot study involving 20 adolescents (16), it is possible that some questions may be too difficult to understand for some subjects (low educational level), and that others may be perceived as being of no interest or even inappropriate.
We also found that whom the adolescent resides with was a strong predictor of missing values: residing with both parents was negatively associated with missingness, while residing with only one, neither parent or the variable was unknown was positively associated with missingness. Other studies conducted in children or adolescents also found that residing with
a lone parent or with people, which did not include either parent was associated with missingness and nonparticipation (13, 15, 18).
Our study showed that the adolescent being female was negatively associated with more than 50% missing items (i.e. a protective factor). The questionnaire sent home is to be completed by the parents. It is possible that girls at this age may be more motivated about reminding the parents to complete the questionnaire or completing the questionnaire themselves. Other studies have found that missingness and nonresponse differ between genders (9, 20, 22).
The above findings were confirmed by the patterns of missing found, as the common patterns of missingness included both of the grandparents’ sections, the father’s and both grandparents’ sections, the father’s and paternal grandparents’ sections. In particular, these missing patterns are likely related to whom the adolescent resides with; residing with only one parent, the mother or father may increase missingness to paternal or maternal questions, respectively. While living with neither parent and when this variable is unknown increases missingness for all sections. Further, examining the missing data patterns and the determinants associated with more than 50% missing items, we can conclude they have similar determinants. Specifically, determinants for the maternal and paternal grandparents’ sections differ slightly from those for the adolescent’s, mother’s and father’s sections.
The effect of the parents’ age as a determinant of missingness only remained significant for the grandparents’ sections. We found that younger parents had a negative association with missing values while older parents showed a positive association. Considering the items being studied, history of family disease, it is possible that the grandparents with missing values have already passed away. Again, this shows grandparents have different determinants of missingness compared to the parents or adolescents.
Recall bias does not seem to affect the variable under study, as they are related to present characteristics (23). However, it is possible that some responses may rely on memory if they ask questions about people with whom the participant is no longer in contact with and cannot be contacted (e.g.: deceased grandparents, living with only one parent or neither parent). We did not use the marital status of the parents, which may have influenced missing items as it has been shown that being single, divorced or widowed is associated with nonresponse in both men and women (10, 11, 18). However, we used whom the adolescent resides with, which may be more important if for example, parents are officially married but currently separated. Further, as we know whom the adolescent resides with, it is clear from our findings that residing with both parents was negatively associated with missingness, while
residing with the father only was positively associated with missingness for the mother’s and maternal grandparents’ sections.
Possible limitations of these findings include the fact that other possible missing items and nonresponse determinants were not studied. These include: if participants were Portuguese nationals or immigrants and the health of the parents; the first was not available, as it was not included in the questionnaire. Previous studies have shown that participants being nationals or immigrants could determine missingness. Immigrants are more likely to be less well-educated and well-integrated into society consequently there is often higher nonresponse for all race/ethnic groups relative to non-Hispanic whites (22, 24). Another possibly relevant determinant, which was not included, is the health of parents or guardians. Other studies often analyze this and have shown that subjects with deteriorated health status are found to be more prone to respond with missing items. It is likely that these individuals may tend to avoid questions, which are embarrassing or may cause distress (10, 22, 25). Another possible limitation of this study is that the questionnaire being analyzed, although only 55 items are specifically studied here, is long. Further, many of the questions analyzed, specifically those related to family history of disease, are in the last pages of the questionnaire. Although it has been shown that response rates are lower for longer questionnaires, it is important to keep in mind that it is preferable to have an instrument based on content rather than the length (20, 26).
Further, only an indirect approach could be used to identify the MNAR process. Direct identification would have required contacting all subjects to ask them to fully fill in the missing values, which was clearly impossible in this study, as in most, and considering that this questionnaire was conducted 10 years ago.
Considering that prevention is the best way to deal with missing data, researchers should take into account determinants of missingness such as those found in this analysis, when designing and conducting a study, in order to minimize missingness and nonparticipation. In the particular case of studying adolescents, targeting the groups with higher risk for nonresponse, could include giving the questionnaire directly to the parents, sending reminders by mail, especially to both parents if the adolescent resides with only one.
Conclusion
In conclusion, we found that missingness was positively associated with lower socio-economic status, while negatively associated with the adolescent being female. However, for the study of family history of disease, we believe that the strongest predictor of missingness is whom the adolescent resides with. Considering that clear determinants of missingness were identified, a MCAR mechanism can be discarded, and it may be necessary to use a missing data technique to correct for nonresponse, which impairs both the representativeness and completeness of the collected data. Prevention is also important to the issue of missing data; researchers must keep this in mind when designing studies and should target these higher risk groups of item nonresponse in order to prevent nonresponse.
References
1. Brick JM, Kalton G. Handling missing data in survey research. Statistical methods in medical research. 1996;5(3):215-38.
2. Graham JW. Missing Data: Analysis and Design. New York: Springer Science+Business Media; 2012.
3. Widaman KF. III. MIssing Data: What to do with or without them. Monographs of the Society for Research in Adolescent Development. 2006;71(3):42-64.
4. Schafer JL, Graham JW. Missing Data: Our View of the State of the Art. Psychological Methods. 2002;7(2):147-77.
5. Little RJA, Rubin DB. Statistical Analysis with Missing Data. 2nd ed. New York: Wiley-Interscience; 2002.
6. Musil CM, Warner CB, Yobas PK, Jones SL. A Comparison of Imputation Techniques for Handling Missing Data. Western Journal of Nursing Research. 2002;24(7):815-29.
7. Raghunathan TE. What Do We Do with Missing Data? Some Options for Analysis of Incomplete Data. Annual Review of Public Health. 2004;25:99-117.
8. McKnight PE, McKnight KM, Sidani S, Figueredo AJ. Missing Data: A Gentle Introduction. New York: The Gilford Press; 2007.
9. Hille ET, Elbertse L, Gravenhorst JB, Brand R, Verloove-Vanhorick SP. Nonresponse bias in a follow-up study of 19-year-old adolescents born as preterm infants. Pediatrics. 2005;116(5):e662-6. doi: 10.1542/peds.2005-0682.
10.Peyre H, Coste J, Leplege A. Identifying type and determinants of missing items in quality of life questionnaires: Application to the SF-36 French version of the 2003 Decennial Health Survey. Health and quality of life outcomes. 2010;8:16. doi: 10.1186/1477-7525-8-16.
11.Coste J, Quinquis L, Audureau E, Pouchot J. Non response, incomplete and inconsistent responses to self-administered health-related quality of life measures in the general population: patterns, determinants and impact on the validity of estimates - a population-based study in France using the MOS SF-36. Health and quality of life outcomes. 2013;11:44. doi: 10.1186/1477-7525-11-44.
12.Korkeila K, Suominen S, Ahvenainen J, Ojanlatva A, Rautava P, Helenius H, et al. Non-response and related factors in a nation-wide health survey. Eur J Epidemiol. 2001;17(11):991-9. doi: 10.1023/a:1020016922473.
13.Dickinson HO, Rapp M, Arnaud C, Carlsson M, Colver AF, Fauconnier J, et al. Predictors of drop-out in a multi-centre longitudinal study of participation and quality of life of children with cerebral palsy. BMC research notes. 2012;5:300. doi: 10.1186/1756-0500-5-300. 14.Boshuizen HC, Viet AL, Picavet HS, Botterweck A, van Loon AJ. Non-response in a
survey of cardiovascular risk factors in the Dutch population: determinants and resulting biases. Public health. 2006;120(4):297-308. doi: 10.1016/j.puhe.2005.09.008.
15.Vinther-Larsen M, Riegels M, Rod MH, Schiotz M, Curtis T, Gronbaek M. The Danish Youth Cohort: characteristics of participants and non-participants and determinants of attrition. Scandinavian journal of public health. 2010;38(6):648-56. doi: 10.1177/1403494810374222.
16.Ramos E. Health Determinants in Porto Adolescents: The EPITeen Cohort. Porto: University of Porto; 2006.
17.de Ayala RJ. The Theory and Practice of Item Response Theory. New York: Guilford Press; 2009.
18.Rich C, Cortina-Borja M, Dezateux C, Geraci M, Sera F, Calderwood L, et al. Predictors of non-response in a UK-wide cohort study of children's accelerometer-determined physical activity using postal methods. BMJ open. 2013;3(3). doi: 10.1136/bmjopen-2012-002290.
19.Dengler R, Roberts H, Rushton L. Lifestyle surveys--the complete answer? Journal of epidemiology and community health. 1997;51(1):46-51.
20.Ronckers C, Land C, Hayes R, Verduijn P, van Leeuwen F. Factors impacting questionnaire response in a Dutch retrospective cohort study. Ann Epidemiol. 2004;14(1):66-72.
21.Galea S, Tracy M. Participation rates in epidemiologic studies. Ann Epidemiol. 2007;17(9):643-53. doi: 10.1016/j.annepidem.2007.03.013.
22.Elliott MN, Edwards C, Angeles J, Hambarsoomians K, Hays RD. Patterns of unit and item nonresponse in the CAHPS Hospital Survey. Health services research. 2005;40(6 Pt 2):2096-119. doi: 10.1111/j.1475-6773.2005.00476.x.
23.Rothman K, Lask T, Greenland S. Modern Epidemiology. 3rd ed. Priladelphia: Lippincott Williams & Wilkins; 2012.
24.Zaslavsky AM, Zaborski LB, Cleary PD. Factors affecting response rates to the Consumer Assessment of Health Plans Study survey. Medical care. 2002;40(6):485-99.
25.Hoeymans N, Feskens EJ, Van Den Bos GA, Kromhout D. Non-response bias in a study of cardiovascular diseases, functional status and self-rated health among elderly men. Age and ageing. 1998;27(1):35-40.
26.Rolstad S, Adler J, Ryden A. Response burden and questionnaire length: is shorter better? A review and meta-analysis. Value Health. 2011;14(8):1101-8. doi: 10.1016/j.jval.2011.06.003.