WORKING PAPER SERIES
CEEAplA WP No. 26/2011
Mobility and Market Power in the Portuguese
Financial System
João C. A. Teixeira
Mobility and Market Power in the Portuguese Financial
System
João C. A. Teixeira
Universidade dos Açores (DEG e CEEAplA)
Working Paper n.º 26/2011
Dezembro de 2011
CEEAplA Working Paper n.º 26/2011 Dezembro de 2011
RESUMO/ABSTRACT
Mobility and Market Power in the Portuguese Financial System
This paper investigates the level of price and non-price competition in the Portuguese financial system. We study the determinants of market power in banking and discuss the role of switching costs. We show that the degree of customer mobility is low and that price instruments have a higher impact on market share than non-price instruments.
João C. A. Teixeira Universidade dos Açores
Departamento de Economia e Gestão Rua da Mãe de Deus, 58
Mobility and Market Power in the Portuguese Financial
System
João C. A. Teixeira
1This version: 17.11.2011
Abstract
This paper investigates the level of price and non-price competition in the Portuguese financial system. We study the determinants of market power in banking and discuss the role of switching costs. We show that the degree of customer mobility is low and that price instruments have a higher impact on market share than non-price instruments.
1
University of the Azores and Centre of Applied Economic Studies of the Atlantic – CEEAplA, Department of Economic and Business, Rua Mãe de Deus, s/n, 9501-801 Ponta Delgada, Portugal.
1. INTRODUCTION
The growing competition within the Portuguese banking sector has been characterised by the generalised use of competitive instruments, namely price (interest rates and commission) advertising and branches. A consequence of this practice has been revealed in a decrease in the margins of banking institutions and a tendency towards concentration, the most obvious sign of which is the fact that over 80% of the banking sector is controlled by only five financial groups.2
In this context, the study of price and non price competition gains particular importance. Deposit interest rates may indicate the significance of saving within the economy, and the loan interest rates may function as a boost to investment and consumption. Similarly, the amount of advertising expenses provides a clear sign of the importance banking institutions give to marketing, while the branch network may give an indication of the distribution policy. One of the objectives of this study is precisely to assess the level of price and non price competition in the Portuguese banking sector, in particular on deposit and lending markets.
The second aim of this study is to analyse the mobility of deposit and lending markets. This analysis is fundamental as it directly affects the capacity of the competitive instruments available to banks to influence their market share in any given period. Thus this study of mobility will allow the discussion of the relevance of the of “switching costs”.
The third area of study involves the assessment of the market power exercised by banking institutions. In particular, it aims to establish the level of competitiveness and/or degree of coordination/collusion of the banking sector, both with respect to the deposit and loan interest rates and to advertising and the branch network.
Yet a further objective of this study is to measure the impact of the commissions banks charge their customers. Bank commissions are increasingly used as a means of profiting from the services offered. The use of a fairly wide margin may have an influence on the assessment of the competitive element of the market share, on its
mobility, on the market power exercised by institutions and even on their competitive behaviour.
Various authors have endeavoured to measure the impact of market structure on the banks’ profitability. The most common approach consists in testing the econometric relationship between a given index of profitability or the interest rates (deposit and loan) and particular market structures or other control variables. At the international level, the principal references to this “reduced form” approach, are Berger (1995), Berger and Hannan (1989), Evanoff and Fortier (1988), Hannan and Liang (1995), Heggestad (1979), Heggestad and Mingo (1976) and Rhoades (1977, 1982). Most of these studies are based on the economy of the United States of America and they all reveal an important conclusion: the most concentrated local markets are more profitable for banking institutions. In Gilbert’s classic work (1984), he presents an important review of empiric literature prior to 1984 and in Weiss (1989), this review is even more detailed.
Nevertheless, this “reduced form” approach has since been abandoned and more recent studies are founded on structural models based on the theory of industrial organisation (“new empirical IO”). Generally speaking, these studies depart from a model of oligopoly with a homogenous product in which several hypotheses are established, to allow an estimate of some behaviour parameters and/or their relationship to the market structure. Examples of this approach are the studies of Berg and Kim (1994), Nathan and Neave (1989), Spiller and Favaro (1984) and Shaffer (1989, 1993).
Some authors, on the other hand, prefer to adopt the hypothesis of product distinction, namely Hannan (1991), Hannan and Liang (1993) and Heffernan (1993). Amongst these, Hannan’s work (1991) comes to the fore. He presents a theoretical corpus which establishes the structure-behaviour-performance of the banking sector3. In this context, the traditional explicable variables of market power are: the level of concentration of the market within a given period and the market share of the institution in question, on the assumption that these two variables are positively related to market power. The former relates to the inverse relationship that exists between market concentration and competitiveness (the greater the concentration, the lower the
3
Hannan’s paper (1991) is also a development of the monopoly model from the Klein line (1971) - Monti (1972).
competitiveness, and therefore, the greater the banks’ capacity to practise prices above the marginal cost.) The latter results from the hypothesis that the larger banks (with a larger market share) have to face less elastic demands.
The choice between the “reduced from” approach and the “new empirical IO” approach is not obvious. Even though the “new empirical IO” approach offers an exact specification for the price-concentration relationship, it needs an explicit functional form to be imposed for the demand function – explicit, as in Berg and Kim (1994) and Shaffer (1993), or implicit, as it assumes the elasticity of constant demand, as in Spiller and Favaro (1984). In most cases the “new empirical IO” approach also demands the imposition of various hypotheses of symmetry. The researcher is thus faced with a dilemma regarding the imposition of the functional form: should it relate to the price-concentration relationship or the demand function – for more on this discussion see Pinho (2000).
The market power has been assessed through the exclusive analysis of competition via price and no price or through the combined analysis of competition via price and no price. Among the studies applied to Portugal that only analyse competition in interest rates we should mention Lopes (1994), Barros and Leite (1994, 1996), Antão (1996), Barros (1999) and Barros and Modesto (1999).
Regarding the combined analysis of price and no price competition, at the international level, Heggestad and Mingo’s study (1976) is a classic reference. Even though this dissertation assesses price and no price competition simultaneously, my approach differs from that of Heggestad and Mingo (1976). Whereas these authors estimated a system of equations in a reduced form, in which the interest rates and some proxies of services are used as dependent variables, my approach is based on a structural model of banking, which will give rise to optimal conditions of competitive instruments.
In Portugal, the assessment of market power based on the simultaneous analysis of price and no price competition has been carried out, above all, by Pinho (2000, 2001). Customer mobility in the Portuguese banking sector is studied above all by Pinho (1995a). He develops a model with dynamic adjustment of market shares for the Portuguese deposit market, over the period 1988-1992. One of the principal conclusions
of the study lies in the low mobility of market shares, which could reveal the existence of some switching costs.
This paper is organised as follows. Section 2 describes the theoretical and empiric model and section 3 presents the estimation procedure. Section 4 concludes.
2. THE MODEL
2.1. THE THEORETICAL MODEL
This paper aims to study the Portuguese deposit and lending markets. It is assumed that banks compete for market share. Thus, the total volume of deposits and loans in the economy, referred to as D and L respectively, is assumed as external to the banks. In this context D and L depend, essentially, on the economic cycle and the decisions on monetary policy conducted by the Bank of Portugal.
The individual volume of deposits and loans of each bank is, respectively: D s di,t iD,t (2.1) L s li,t iL,t (2.2) where siD,t and L t i
s, represent the market share on deposits and loans from company i in
the period t, respectively.
Pinho (1995a) establishes that significant switching costs exist on the Portuguese deposit market. The model that allows us to assess the existence of these costs will be a model with dynamic adjustment of market shares. According to this model, the market share of the deposits of the company in the order i in the period t siD,t depends, simultaneously, on the share of the potential market in this same period, taken as ,*
D t i
s , and of the market share of the previous period, taken as siD,t 1. The variations in the market share are affected by a mechanism of partial adjustment. As referred to by Gual (1993), the alteration of the competitive position of a bank will only influence the share of the potential market, so that a part of the market share will remain unaltered, due to a certain inertia of the deposit customers.
The same reasoning will be developed in relation to loan markets. This model will be described by the equation (2.3) on deposit markets and by the equation (2.4) on lending markets.
D D t i D t i D t i D t i s s s s 1 , * , 1 , , , with 0 D 1 (2.3) L L t i L t i L t i L t i s s s s 1 , * , 1 , , , with 0 L 1 (2.4)
The coefficient of partial adjustment represents the portion of the effective market share in the bank, in a given period, which is affected by variations in the share of the potential market. This parameter will allow us to assess the degree of mobility of market shares, as there is, of course, a positive relationship between the value of the parameter and that mobility. If, for example, the parameter takes the value of zero, it means that the whole of the bank’s market share within a given period depends exclusively on its market share in the previous period, and that mobility in the market share is non-existent. As the value of approaches one, so the mobility of the quota of the market increases and consequently, the greater is the capacity of alterations in the share of the potential market to alter the effective bank share.
We can rewrite the dynamics of the model as:
D t i D D t i D D t i s s s, ln ,* 1 ln , 1 ln (2.5) L t i L L t i L L t i s s s, ln ,* 1 ln , 1 ln (2.6)
The potential market share of each bank will depend on the use it makes of the competitive price and no price instruments at its disposal, as well as the use of these instruments by rival banks. The interest rates offered for deposits (r ) and charged on D loans (r ) are considered as competitive price instruments and advertising expenses L (ADV) and the number of branches (BR) are considered as no price competitive instruments.
In the case of rival banks, the competitive price instrument is given as rDr on deposit markets and as rLr on lending markets and the no price competitive instruments are given as ADVr for advertising and BRr for the number of branches.
For effects of empiric operation, rDr and rLr are defined as the average interest rates on deposits and loans of all the banks in the sector, with the exception of the bank in question; BRr is defined as the difference between the total branches of the sector and the bank in question, and ADVr as the difference between the total advertising expenses of the sector and the expenses of the bank in question.
It is assumed that no advertising goodwill exists, that is, given that the majority of advertisements used by the banks advertise products and rates with a short time span, one may consider that the effect of a given message goes out of date within the space of a year. Moreover, it is a fact that the popularity of brands depends on numerous other factors, which cannot be explained by advertising (e.g. the CGD, the best known bank, spent an almost insignificant amount on advertising during the period under analysis).
If we admit that elasticity is constant, the equation relative to the potential market share for deposits is:
t i BRr t i BR t i ADVr t i ADV Dr t i r D t i r D t i r r ADV ADVr BR BRr s, 0 Dln , Drln , ln , ln , ln , ln , ln * (2.7)
Likewise, the equation relative to the potential lending market share can be described as: t i BRr t i BR t i ADVr t i ADV Lr t i r L t i r L t i r r ADV ADVr BR BRr s, 0 Lln , Lrln , ln , ln , ln , ln , ln * (2.8)
For simplicity’s sake, it is assumed that the banks have three types of assets: loans l , investment policiesi S , and unremunerated reserves and, as liabilities, a i determined amount of deposits d . The level of unremunerated reserves is a fraction i
of the deposits. The equation for the bank’s balance will be di Si li di. It is considered that the banks are price-takers on the interbank monetary market. They apply the funds acquired at a rate of the interbank monetary market rS , net from unremunerated reserves. The bank incurs three operational marginal costs: cD for each euro deposited, cL for each euro conceded in a loan and cBR for each new
branch in operation. Marginal costs are taken as constant. The profit function of each individual bank will be:
t i BR t i t t i D D S D t i t t i L S L L t i t i, s, r r c , L s, r (1 ) r c , D ADV, c BR, (2.9)
The approach taken in this study is similar to that developed in Clarke (1995), which in turn is a generalisation of the Dorfman and Steiner (1954) model. It turns out that each bank aims to maximise profit through the interest rate set for deposits and loans, the amount spent on advertising and the number of branches.
In relation to the competitive price variables, the price conditions will be given as: 0 ) 1 ( , , , , , , t D t i D t i t i D D S t D t i D t i t i D dr ds c r r D s r (2.10) 0 , , , , , , t L t i L t i t i L S L t L t i L t i t i L dr ds c r r L s r (2.11)
The optimum solution of the competitive price instruments is given by the following equations: t i D D S D t i Dr t i Dr t i D t i D t i D t i D D t i r r c r d r d r s r s r , , , , * , , * , , (1 ) ln ln ln ln ln ln (2.12) t i L S L L t i Lr t i Lr t i L t i L t i L t i L L t i r r c r d r d r s r s r , , , , * , , * , , ln ln ln ln ln ln (2.13)
As in Clarke (1995), we shall use the term D
t i Dr t i r d r d , , ln ln
of the equation (2.12) and
the term L t i Lr t i r d r d , , ln ln
given bank in relation to its rivals, in the deposit interest rate and credit rate competitive instrument, respectively. These terms, which are also behaviour parameters, allow us to detect divergences in behaviour relative to a Nash situation, be it on deposit or lending markets. For a parameter value equal to zero, a Nash situation occurs, that is, each bank chooses its own interest rates regardless of the effects this decision will have on decisions taken by other institutions on the market. However, if the behaviour parameter value equals one, the banks coordinate their action in terms of interest rates, coming close to a cartel-like situation.
For simplicity’s sake in our estimation, the effects of the elasticities of conjectural variations will be described as rD
and rL , that is, D t i Dr t i rD r d r d , , ln ln and L t i Lr t i rL r d r d , , ln ln .
For each bank, the elasticities understood from the competitive price instruments will be: D t i Dr t i Dr t i D t i D t i D t i D rD t i r d r d r s r s , , , * , , * , , ln ln ln ln ln ln (2.14) L t i Lr t i Lr t i L t i L t i L t i L rL t i r d r d r s r s , , , * , , * , , ln ln ln ln ln ln (2.15)
In turn, in reduced form, the optimum solution in terms of deposit and loan interest rates is given by the equations (2.16) and (2.17) respectively.
t i D S rD t i rD t i D t i r c r , , , , (1 ) 1 (2.16)
t i L S rL t i rL t i L t i r c r , , , , 1 with , 1 L t i (2.17)
These equations can be equally presented so as to indicate deposit and loan price-cost margins, thus obtaining the expressions (2.18) and (2.19), respectively.
rD t i D t i t i D D S r c r r , , , 1 ) 1 ( (2.18) rL t i L t i L S L r c r r , , 1 with iL,t 1 (2.19)
By clarifying the various components of perceived elasticities, we see that:
rD r r D D t i t i D D S Dr D r c r r 1 x 1 ) 1 ( , , (2.20) rL r r L L t i L S L Lr L r c r r 1 x 1 , (2.21)
As inferred in the equations (2.18) and (2.20), the market power of each bank on the market, or rather, its capacity to create margins above those that would be applied in a situation of perfect competition depends negatively on the elasticity of demand perceived by the bank in relation to the deposit interest rate. The greater this elasticity, the more competitive will be the way in which the bank develops its activity in deposits.
In turn, the elasticity of demand for deposit interest rates perceived by the bank incorporates various components, namely, the adjustment coefficient associated with the mobility of the deposit market share, demand-price elasticity, the parameter relative to
sensitivity to the potential market share in relation to rival deposit interest rates and the behaviour parameter that reflects the level of coordination/coalition of the banks in the deposit interest rate instrument. Thus we understand the importance of the study of the relationships between the deposit margin created and the various components of the perceived elasticity of demand. The contributing factors for a lesser perceived elasticity of deposit demand and, consequently, increased power over the market are: a reduced demand-price elasticity, high sensitivity of the bank’s potential market share to rival deposit interest rates, a high degree of coordination among banks and a reduced coefficient associated to the bank’s potential market share.
Of course the deposit margin created will not depend directly on the values of the above-mentioned parameters, but rather on their joint effect. For example, if demand is very elastic, only by means of a high degree of collusion and/or low mobility of the deposit market will banks be able to create margins above the situation of perfect competition. Moreover, for low values in demand-price elasticity, a high margin may arise, even with limited collusion among banks and/or low mobility of the market share. Among the parameters determining perceived elasticity of deposit demand, special attention should be given to the parameter associated with the mobility of the market share. In a context of dynamic adjustment of market shares, the banks’ market power in deposits depends greatly on this parameter. We see that this interacts with the others. Demand-price elasticity, elasticity in relation to rivals and the parameter indicating the level of coordination among banks have an impact on the deposit margin which is always adjusted by the lambda coefficient. If the deposit market share is very low, the bank is far more capable of exercising its market power, independently of the elasticity of demand, elasticity in relation to rivals and the degree of coordination of the sector.
As regards lending markets, the equations (2.19) and (2.21) show that market power is negatively related to the elasticity of demand perceived by the bank as far as loan interest rates are concerned. As was the case of deposit markets, we see that, the margin comes out as the opposite of the perceived elasticity of demand.
The effects of the diverse components of the perceived elasticity of demand in relation to loan interest rates are, with the necessary adaptations, identical to those
elasticity of demand in loans, which will affect whether the bank will have greater market power, are: a lesser demand-price elasticity, a high sensitivity of the potential market share to rival credit interest rates, a high level of coordination among banks and a reduced coefficient associated with the market share of the bank’s potential market.
Once again one should emphasise the importance of the lambda coefficient in the expression of perceived elasticity. If the mobility of the lending market share is very low, the bank will achieve greater market power, even with high demand-price elasticity in relation to rival interest rates and a low degree of market collusion.
As for the competitive no price variables, namely, advertising expenses and the number of branches, the prime conditions are, respectively:
0 1 ) 1 ( , , , , , , , , t i D t i t t i D D S t i L t i t t i L S L t i t i dADV ds D c r r ADV s L c r r ADV (2.22) 0 ) 1 ( , , , , , , , , , BR t i t i D t i t t i D D S t i L t i t t i L S L t i t i c dBR ds D c r r BR s L c r r BR (2.23)
Developing the prime conditions, the following optimum solutions are obtained:
L t i t t i L S L t i t i t i L t i t i L t i L D t i t t i D D S t i t i t i D t i t i D t i D t i s L c r r ADV d ADVr d ADVr s ADV s s D c r r ADV d ADVr d ADVr s ADV s ADV , , , , , , , , , , , , , , , , , ln ln ln ln ln ln ) 1 ( ln ln ln ln ln ln * * * * (2.24) L t i t t i L S L t i t i t i L t i t i L t i L BR t i D t i t t i D D S t i t i t i D t i t i D t i D BR t i t i s L c r r BR d BRr d BRr s BR s c s D c r r BR d BRr d BRr s BR s c BR , , , , , , , , , , , , , , , , , , , ln ln ln ln ln ln 1 ) 1 ( ln ln ln ln ln ln 1 * * * * (2.25)
As was the case of competitive price instruments, the concept of “the elasticity of conjectural variations” must be applied to non price instruments. The terms which translate it, and will allow us to detect the degree of coordination/collusion among banks regarding advertising expenses and the number of branches, consist in the derived totals of equations (2.24) and (2.25), that is, in the expressions
t i t i ADV d ADVr d , , ln ln and t i t i BR d BRr d , , ln ln
, respectively. Once again, for simplicity’s sake, we shall represent the “ elasticities of conjectural variations” by ADV
or BR, depending on whether advertising or the number of branches is being referred to.
New perceived elasticities also result from equations (2.24) and (2.25): the perceived elasticities of advertising and the number of branches in relation to deposits and to loans.
For the perceived elasticity of advertising, we shall have:
t i t i t i D t i t i D t i D D ADV t i ADV d ADVr d ADVr s ADV s , , , , , , / , ln ln ln ln ln ln * * (2.26) t i t i t i L t i t i L t i L L ADV t i ADV d ADVr d ADVr s ADV s , , , , , , / , ln ln ln ln ln ln * * (2.27)
Then, for each bank, the perceived elasticity of branches in relation to loans, will be, respectively: t i t i t i D t i t i D t i D D BR t i BR d BRr d BRr s BR s , , , , , , / , ln ln ln ln ln ln * * (2.28) t i t i t i L t i t i L t i L L BR t i BR d BRr d BRr s BR s , , , , , , / , ln ln ln ln ln ln * * (2.29)
Applying the market share equations (2.7) e (2.8), the above elasticities can be represented as: ADV ADVr ADV D D ADV t i / , (2.30) ADV ADVr ADV L L ADV t i / , (2.31) BR BRR BR D D BR t i / , (2.32) BR BRR BR L L BR t i / , (2.33)
We are now in a position to rewrite the optimum solutions for advertising and the number of branches, and thus obtain:
L t i t t i L S L L ADV t i D t i t t i D D S D ADV t i t i r r c Ds r r c Ls ADV , , / , , , / , , (1 ) (2.34) BR t i L t i t t i L s L L BR t i D t i t t i D D s D ADV t i t i c s L c r r s D c r r BR , , , / , , , / , , ) 1 ( (2.35)
From the configuration of the equation (2.34), relating to the characterisation of the bank’s advertising policy, we can establish that the amount spent on advertising in a given year depends positively on the perceived elasticity of advertising in relation to deposits and loans and the margins created by both. In turn, the factors that affect this perceived elasticity are: the degree of mobility of the market share; elasticity regarding advertising; the elasticity regarding rival advertising and the degree of coordination among banks as regards advertising expenses.
As to the equation of the optimum level of the number of banks (equation 2.35), the principal difference in relation to the equation of the optimum level of advertising has to do with the presence of the marginal cost of the branches. Also the decision to open new branches is based on the perceived elasticity of the number of branches in relation to deposits and loans and in the bank’s margins on the same markets.
2.2. THE EMPIRIC MODEL
To put the afore-mentioned theoretical empiric model into operation, this chapter presents a group of adjustments to the model. In relation to the dynamic equations for market shares previously presented, there are no adjustments to be made. Nevertheless, with reference to the equations resulting from the model for the maximisation of profit of a banking company, two aspects need to be developed: on the one hand, one should include a coefficient of partial adjustment in the branches equation and, on the other hand, the parameter “elasticity of conjectural variations” should be defined empirically.
In relation to the first empiric specification, the reason underlying the use of a mechanism of partial adjustment in the branches equation is the existence of significant costs in opening up and closing down branches. The existence of these costs means that lending institutions react very slowly to variations in market conditions in the number of branches instrument. When a bank decides to open up a new branch, it has to confront the initial investment with the actual value of future cash flows. So a temporary reduction in bank margins does not imply closing down some branches, as future, positive cash flows will compensate for short-term losses.
This mechanism of partial adjustment can be modelled as follows:
1 , * , 1 , ,t it it it i BR BR BR BR (2.36)
In the model above, already applied in Cabral and Majure (1993) and Pinho (1995a, 2000), BR translates the actual number of branches the bank has and BR * their desired value, obtained via the condition of optimality (2.35). The parameter is the coefficient of partial adjustment.
So, for empiric effects, the branches equation is transformed into the following equation: 1 , , , , / , , , / , , 1 ) 1 ( t i BR t i L t i t t i L S L L BR t i D t i t t i D D S D BR t i t i BR c s L c r r s D c r r BR (2.37)
We shall now make some considerations about the empiric specification of the “elasticity of conjectural variations” parameters. The parameters rD
, rL, ADV and
BR
not only allow us to detect deviation of behaviour relating to a Nash situation, at the level of price and no price competitive instruments, but also enable us to determine the perceived elasticity of demand of those instruments, as was shown in the previous section. Consequently, the value for the parameter for the elasticity of conjectural variations is a fundamental indicator of each bank’s market power, in each period.
The traditional explanatory variations of market power in a context of differentiated product are concentration and the market share. In Hannan (1991), these two variables are recognised to be positively related to market power, the former through a lower elasticity of demand and the latter, through the reduction of perceived elasticity resulting from the greater dimension of the bank. Also in Pinho (2000, 2001), these variables are used to explain market power. Thus we shall use these two variables in the present study. As a measure of concentration, we shall use the Herfindal index for deposits (HERFD) and credit (HERFL), to estimate rDor rL, respectively. To estimate the parameter , relative to no price competitive instruments, Herfindal’s index for branches (HERFBR) will be the variable representing concentration. As for the variable representing the market share, we chose to consider the control variable LARGE (= 1 for “banks with a market share above 5%”) in the estimation of the parameters rDand rL and the variable branches’ market share sBR in order to estimate the parameter of the competitive no price instruments. It is assumed that, generally speaking, the dominant companies or those with a large market share have significant advantages over their customers, translated in terms of the margins applied to them.
Similarly the control variable PUB (=1 for “public banks”) was considered, so as to detect whether the competitive behaviour of public banks differed from private banks. Aspects of ownership are frequently explored in literature, often concluding that professionally managed banks take a more aggressive approach than cooperative or public banks, where maximising profit is not the chief objective. In Portugal, Barros and Modesto’s study (1999) is a key reference, as it establishes that the public institution Caixa Geral de Depósitos is far less aggressive in its behaviour than most private banks.
We shall therefore adopt the following specification of behaviour parameters for the competitive variables:
PUB LARGE
HERFD LARGED PUBD
CRD D rD 0 (2.38) PUB LARGE
HERFL LARGEL PUBL
CRL L rL 0 (2.39) PUB s
HERFBR SADV BR PUBADV
CRADV ADV ADV 0 (2.40) PUB s HERFBR SBR BR PUBBR CRBR BR BR 0 (2.41)
3. ESTIMATES AND RESULTS
3.1. THE DATA
The data used to estimate the previously presented model consist of a set of 175 observations obtained from a set of 24 banks operating on the Portuguese market, during the period 1988-1997. This sample represents more than 95% of the deposit and lending markets, including the major Portuguese banks. We should point out that the 175 observations were taken from an initial sample of 203 observations, as only the observations of banks with a market share of deposits above 0,5% were selected. Through this procedure we were able to eliminate some of the “noise” in the data, caused by the observations of very small banks.
The data for variables that are part of balance sheets and demonstrations of the banks’ results were obtained through the bulletins of the Portuguese Bank Association; information about branches was obtained from the same source and from the Bank of Portugal; and information about public spending came from the results of a market research institute called Sabatina. All variables expressed in monetary terms are at constant prices for 1995.
As there was no data available on the interest rates of diverse deposits (current and investment accounts) and on the various loans of each individual bank, we decided to work with average annual interest rates for each bank. The interest rate of the interbank monetary market S
r was calculated as the annual average of the monthly interest rates of the interbank market published by the Bank of Portugal.
As regards the marginal costs of deposits cD , loans cL and branches cBR , it was initially attempted to estimate costs using a flexible translog, following the methodology described in Pinho (1995b). However, the parameters resulting from this estimation turned out to be of little significance statistically, as well as producing numerous negative marginal costs. It was therefore decided to estimate the above-mentioned marginal costs using a cost function of the type:
t i BR t i L t i D t i CF c d c l c BR CT, , , , (3.1)
In the equation, the variable CTi,t represents the total cost of bank i in the
period t, defined as the sum of the costs of personnel, of other operational costs and of the annual amount of depreciation. CF translates the banks’ fixed cost. The remaining variables of the function are already known and refer to the individual amount of deposits and loans and the number of branches of each bank.
By estimating the (3.1) function, the results in table 1 were obtained.
Table 1 – Marginal cost estimates
Parameter Estimate Std Error t Ratio
CF 1 250 752.1 1.663 D c 0.00342046 0.00422 0.811 L c 0.00991146 0.00752 1.318 BR c 132.4 17.44 7.589 2 R 0.883
As the cost function estimates resulted in a high R2 and low t-ratios for the majority of the parameters, we can accept the existence of multicolinearity. However, given that the marginal costs have a purely instrumental character in the model and do not constitute the fundamental aspect of this study, we believe we can use that estimate. Furthermore, the function (3.1) does not aim to represent a costs function typical of the banks. Our aim is simply to assess, for a group of banks, how costs react to alterations in the product. In this context, equal marginal costs are obtained for all the banks.
One of the reasons why different marginal costs are considered for all the banks is the assumption that scale economies exist in the banking sector. However, in Pinho’s study (1995b), it is established that scale economies are not typical of most institutions. In this study it is argued that “the existence of scale economies is verified for the cases in which expansion is not governed by an increase in the branch network. In the more frequent, remaining cases these scale economies disappear for most institutions, maintained only by smaller banks”.
As was mentioned in the introduction, the estimation process of the model will have two different approaches: in the first approach, commissions will not be considered in the calculation of deposit and loan margins while in the second approach, those commissions will be included.
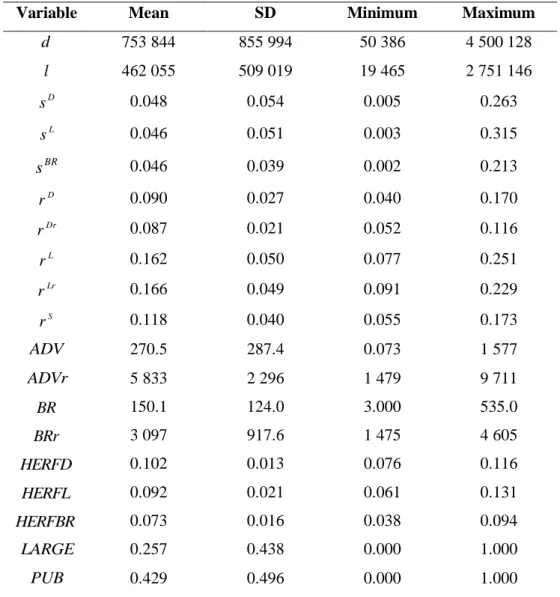
In the first approach, the descriptive data statistics, considering only the 175 observations, figure in table 2.
Table 2 – Descriptive statistics, excluding commissions
Variable Mean SD Minimum Maximum
d 753 844 855 994 50 386 4 500 128 l 462 055 509 019 19 465 2 751 146 D s 0.048 0.054 0.005 0.263 L s 0.046 0.051 0.003 0.315 BR s 0.046 0.039 0.002 0.213 D r 0.090 0.027 0.040 0.170 Dr r 0.087 0.021 0.052 0.116 L r 0.162 0.050 0.077 0.251 Lr r 0.166 0.049 0.091 0.229 S r 0.118 0.040 0.055 0.173 ADV 270.5 287.4 0.073 1 577 ADVr 5 833 2 296 1 479 9 711 BR 150.1 124.0 3.000 535.0 BRr 3 097 917.6 1 475 4 605 HERFD 0.102 0.013 0.076 0.116 HERFL 0.092 0.021 0.061 0.131 HERFBR 0.073 0.016 0.038 0.094 LARGE 0.257 0.438 0.000 1.000 PUB 0.429 0.496 0.000 1.000
3.2. THE ESTIMATION PROCESS AND RESULTS
The initial objective of this study consisted in estimating the system of non linear equations described by the set of dynamic equations of the market share of deposits (2.5) and loans (2.6) and the equations of behaviour relative to the optimum solution in terms of the interest rates of deposits (2.16) and loans (2.16), of advertising expenses (2.34) and the number of branches (2.37). However, the estimation using the method of non linear least squares (LSQ) of the TSP package presented problems in the use, in reduced form, of equations (2.16) and (2.17).
This being so, in the system of non linear equations to be estimated, instead of including the optimum solution of deposit and loan interest rates in a reduced form, the optimum solution was included in a structural form, resulting in the substitution of equations (2.16) and (2.17) by equations (2.12) and (2.13). This new system of equations is presented on the following two pages. The method applied was still that of non linear least squares.
Market share of deposits: D t i D t i BRr t i BR t i ADVr t i ADV Dr t i r D t i r D D t i r r ADV ADVr BR BRr s s, 0 D ln , Dr ln , ln , ln , ln , ln , 1 ln , 1 ln (3.2)
Deposit interest rate:
t i D D S PUBD LARGED CRD D r r D D t
i HERFD LARGE PUB r r c
r, D Dr 0 , (3.3)
Market share of loans:
L t i L t i BRr t i BR t i ADVr t i ADV Lr t i r L t i r L L t i r r ADV ADVr BR BRr s s, 0 Lln , Lrln , ln , ln , ln , ln , 1 ln , 1 ln (3.4)
Loan interest rate:
t i L S L PUBL LARGEL CRL L r r L L t
i HERFL LARGE PUB r r c
Advertising: L t i t t i L S L PUBADV BR SADV CRADV ADV ADVr ADV L D t i t t i D D S PUBADV BR SADV CRADV ADV ADVr ADV D t i s L c r r PUB s HERFBR s D c r r PUB s HERFBR ADV , , 0 , , 0 , (3.6) Branches: (3.7) 1 , , , , 0 , , 0 , BR 1 it t i L t i t t i L S L PUBBR BR SBR CRBR BR BRR BR L D t i t t i D D S PUBBR BR SBR CRBR BR BRR BR D t i BR c s L c r r PUB s HERFBR s D c r r PUB s HERFBR BR
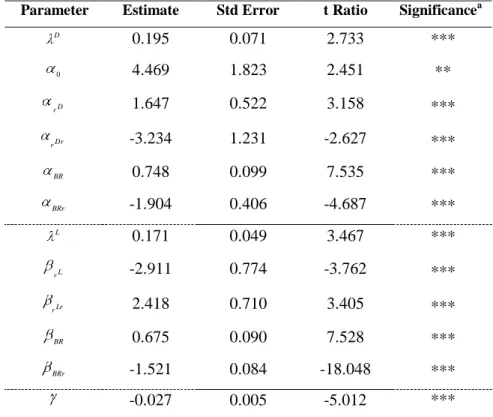
The six equations are estimated simultaneously for the following reason: not only do the equations for behaviour (3.3), (3.5), (3.6) and (3.7) result from the prime conditions of the same problem, which increases the possibility of positive covariance among its residues, but also these equations incorporate a set of parameters which result from the equations of market share (3.2) and (3.4). An obvious interaction is assumed between the price policies for bank products (deposit and loan interest rates) and their divulgation (advertising) and distribution (branches). This approach reveals the need to consider the diverse elements of marketing-mix of a product or service as mutually consistent. The results of the simultaneous estimation of the six equations appear in table 3 for the final model.
Table 3 - Estimation of the 5 equations of the model (final results) –excluding commissions
Parameter Estimate Std Error t Ratio Significancea
D 0.195 0.071 2.733 *** 0 4.469 1.823 2.451 ** D r 1.647 0.522 3.158 *** Dr r -3.234 1.231 -2.627 *** BR 0.748 0.099 7.535 *** BRr -1.904 0.406 -4.687 *** L 0.171 0.049 3.467 *** L r -2.911 0.774 -3.762 *** Lr r 2.418 0.710 3.405 *** BR 0.675 0.090 7.528 *** BRr -1.521 0.084 -18.048 *** -0.027 0.005 -5.012 *** a
The significance level of the estimated parameters is represented by * (95%), ** (98%) and *** (99%); number of degrees of freedom: 163.
Equation PseudoR2
Market share of deposits 0.970
Deposit interest rate 0.123
Market share of loans 0.950
Loan interest rate 0.482
Branches 0.977
Log Likelihood -116.2
The results obtained allow us to reject the hypothesis of coordinated behaviour by the banks, at all levels considered in the analysis, namely in deposit markets, lending markets and the number of branches. As in the result of applying the Wald Test, it was concluded that all the parameters of elasticity of conjectural variations ( D
, L
e BR
) are zero (considering a confidence level of 95%).
From the estimate of the same parameters, we cannot accept the hypothesis that market power depends on the level of concentration of that same market, on the bank’s dimension and type of ownership, both for deposits and loans and the branch network. The initial argument that the largest institutions have lower perceived elasticities of demand is not confirmed. The public banks did not reveal less competitive behaviour than the private banks, and thus are not able to exert greater power over the market.
The results in table 3 confirm the low mobility of deposit and loan market shares. In the deposits, only 19,5 % of the market share is sensitive to the action of competitive instruments4, while in loans, this percentage is even lower, at 17,1%. The high coefficient associated with the share of the previous year could result in a degree of inertia among deposit and loan customers and/or significant switching costs. This aspect is particularly important as it conditions the action of the banks considerably in using the diverse competitive instruments. On the one hand, the widespread use of competitive price and no price instruments, which underlie, for example, very aggressive growth strategies, could turn out to be too expensive when compared with the results achieved in the short term and medium term. On the other hand, the possible existence of switching costs could be quite favourable for the bank’s marketing policy,
4
In Pinho (1995a) this estimate was 11,9%. So we can say that there was an increase in the market share mobility on deposits in the last years.
in so far as these costs will more easily lead to customer loyalty (even though these costs in themselves may simply reflect the bank’s capacity to keep its customers).
As well as the low mobility evidenced, in general terms, on deposit and lending markets, it should be stressed that this phenomenon is more accentuated on the lending market. This is due, among other reasons, to the time limits and the complexity of the contracts. Loan contracts are normally established for long time periods (in housing loans the contract bond may last 30 years) which give stability to the customer/bank relationship, time wise. Loan contracts are also more complex than deposit contracts, often involving real guarantees, insurance, etc., which increases the inconvenience of switching bank, compared with deposits.
As for the effectiveness of competitive instruments, both in deposits and loans, the competitive price instrument comes out as most effective. Demand-price elasticity is above one on both markets, and actually approaches three on lending markets. By applying symmetry test t, as shown in table 8, the result was that the parameters associated with interest rates are symmetrical, even though this symmetry is more evident in loans. The impact of a unitary percentage variation of the bank’s lending interest rate on the market share is practically the same as a unitary percentage variation, to the opposite, of the loan interest rate of rivals. The reasoning is analogous for deposits.
As to the importance of the branch network as a competitive no price instrument, the case is similar to that of deposit and lending markets. The market shares (deposits and loans) of each bank are far more sensitive to the number of branches of its rivals than its own number of branches. In fact, on both markets, elasticity in relation to the number of rival branches is higher than one (1.9 and 1.5, respectively), while elasticity in relation to the bank’s own number of branches reaches values of approximately 0.7. Having tested the symmetry of the branch parameters (see table 8), the null symmetry hypothesis was rejected, considering a confidence level of 98% and 99%, for deposit and lending markets, respectively.
Even though we admit that advertising expenses influence the bank’s potential market share, it was impossible to validate this relationship because, as has been mentioned, all the advertising parameters were excluded from the analysis.
The value estimated for the adjustment parameter for the branch network 027
.
0 is somewhat surprising. This estimate differs, to a large degree, from the values found in Pinho (1995a, 2000). In these studies, even though low values were given for the parameter, they were always positive. In the present study we find an exogenous growth rate to each bank’s branch network. The number of branches in each year results from a growth policy defined for the branch network, consisting, in this case, of an average annual rate of 2.7%. It was not possible to validate the hypothesis of the model, according to which the number of branches in each year is a function of loan and deposit margins. Even though the number of branches affects the potential market share, the banks’ behaviour in the opening of new branches did not support the economic theory. There was a certain overbranching in the Portuguese banking sector, in that banks continued to open new branches every year, even when a reduction of margins was foreseen. It can therefore be concluded that banks ignore the effect of margins on the opening of new branches.
4. CONCLUSIONS
In order to study price and no price competition on Portuguese deposit and lending markets in the period 1988-1997, a system of simultaneous equations was estimated which included dynamic equations of the market share and the deduction of the prime conditions of a model of profit maximisation of banking companies. The principal objective of this study consisted in assessing the relative importance of three competitive instruments in determining the banks’ market shares, both in deposits and loans. The competitive instruments considered were deposit and loan interest rates, advertising expenses and the number of branches.
As parallel objectives, we aimed to analyse the degree of “coordination/collusion” of the sector in these instruments as well as the market power exercised by the banks and the mobility shown on deposit and lending markets. Two approaches were developed for their estimation. In the first phase, a more restricted concept of margins was used, excluding bank commissions from the analysis and, in the second phase, commissions were included. The aim was to assess how far commissions influenced the results of the first phase.
One of the principal conclusions of the study has to do with the fact that the decision regarding the amount of advertising expenses and the number of branches does not obey the model for maximisation of profit, either when applying a broader concept of margin or a more restricted concept, or without considering commissions. There was an increase in both the amount of advertising expenses and the branch network at the same time that there were narrower deposit and loan margins. The margins did not turn out to be an explanatory factor of advertising expenses and the number of branches. This affirmation, in relation to advertising, was due to the very poor results presented by the estimation when the advertising equation was included and, in relation to the branches, it resulted from the fact that the estimation of the adjustment coefficient associated with branches revealed a growth outside the branch network, independently of the margins.
The weak capacity of the competitive instruments to affect the banks’ market share was another important conclusion. The adjustment coefficient associated with the
degree of inertia of deposit customers and/or significant switching costs. It was also established that there was lower mobility in loans, perhaps due to longer time frames and the greater complexity of loan contracts. The use of a broader concept of margin, including commissions, caused a decrease in loan mobility.
As regards the competitive component of deposit and lending market shares, the greater efficiency of price competitive instruments should be noted. It was not possible to accept the hypothesis of anti-competitive behaviour by banking institutions, on all markets analysed. In the second approach of the model, only the public banks showed anti-competitive behaviour, but only on deposit markets. On lending markets the public banks are as competitive as the private banks. It was not possible to validate market power associated with the banks’ dimension and the degree of concentration of the market.
The results achieved by this study could be a contribution to the process of strategic decision-making of a bank. The reduced mobility shown in deposits and loans could allow managers to explore more fully the benefits of Customer Relationship Management tools. We may be in the presence of a banking sector with high switching costs, which to some extent translates the effort made to keep customers. In this context, managers should continue to use customer-based systems.
Investment in traditional competitive instruments could turn out to be unprofitable, especially in the short or the medium term. However, if the aim is to use these instruments, then managers should pay particular attention to price instruments, particularly the competitive value of commissions. The phenomenon of overbranching appears to have contributed to a reduction in the competitive importance of branches, over the past years. Generally speaking, managers should avoid a branch growth strategy. Finally, one should bear in mind that advertising is not a factor capable of significantly influencing the market share and therefore prudence is recommended in the use of this instrument.
5. REFERENCES
Antão, Paula (1996). Market power and price adjustment in the Portuguese banking sector: one approach with the error corrector mechanism. Economia, volume XX, 31-65.
Avery, R., (1991). Deregulation and location of financial institutions offices. Federal Reserve Bank of Cleveland, Economic Review, September.
Barros, Fátima and Leonor Modesto (1999). Portuguese banking sector: a mixed oligopoly? International Journal of Industrial Organization 17, 869-887.
Barros, Pedro Pita and António Nogueira Leite (1994). Conduct determinants in Portuguese banking. International Journal of Industrial Organization.
Barros, Pedro Pita, (1995). Post-entry expansion in banking: the case of Portugal. International Journal of Industrial Organization 13, 593-611.
Barros, Pedro Pita and António Nogueira Leite (1996). Competition in Portuguese commercial banking. Economia 20 (1): 7-30.
Barros, Pedro Pita, (1999). Multimarket competition in banking, with an example from the Portuguese market. International Journal of Industrial Organization 17, 335-352.
Berg, S., Kim, M., (1994). Oligopolist interdependence and the structure of production in banking: An empirical approach. Journal of Money, Credit, and Banking 26 (2), 404-431.
Berger, A., (1995). The profit-structure relationship in banking – tests of market power and efficient structure hypothesis. Journal of Money, Credit, and Banking 27 (2), 404-431.
Cabral, L., Majure, R., (1993). A model of branching, with an application to Portuguese banking. Bank of Portugal.
Clarke, R., (1995). Industrial economics. Blackwell Publishers Inc, 119-142.
Dorfman, R., Steiner, P. (1954). Optimal advertising and optimal quality. American Economic Review 44, 826-36.
Evanoff, D., (1988). Branch banking and service accessibility. Journal of Money, Credit, and Banking 20 (2), 191-202.
Evanoff, D., Fortier, D., (1988). Re-evaluation of the structure-conduct-performance paradigm in banking. Journal of Financial Services Research 1, 177-194.
Gasmi, F., Laffont, J., Vuong, Q., (1992). Econometric analysis of collusive behaviour in a soft-drink market. Journal of Economics & Management Strategy 1 (2), 277-311.
Gilbert, A., (1984). Bank market structure and competition: A survey. Journal of Money, Credit, and Banking, Part II 16, 617-645.
Gual, Jordi (1993). Competência en depósitos bancários. Moneda y Crédito, 196. Hannan, T., (1991). Foundations of the structure-conduct-performance paradigm in
banking. Journal of Money, Credit, and Banking 23 (1), 68-84.
Hannan, T., Liang, N., (1993). Inferring market power from time series data – the case of the banking firm. International Journal of Industrial Organization 11, 205-218. Hannan, T., Liang, N., (1995). The influence of thrift competition on bank business loan
rates. Journal of Financial Services Research 9, 107-122.
Heffernan, S., (1993). Competition in British retail banking. Journal of Financial Services Research 7, 309-332.
Heggestad, A., (1979). A survey of studies on banking competition and performance. In: Edwards, F. (Ed.), Issues in Financial Regulation. McGraw-Hill, New York, pp. 449-490.
Heggestad, A., Mingo, J., (1976). Prices, nonprices and concentration in commercial banking. Journal of Money, Credit, and Banking 8, 107-117.
Klein, M., (1971). A theory of the banking firm. Journal of Money, Credit and Banking, 3, 205-218.
Klemperer, P., (1987). The competitiveness of markets with switching costs. Rand Journal of Economics 18 (1), 138-150.
Lopes, Margarida (1994). Market power estimation in the Portuguese loan market, Trimester Bulletin – Bank of Portugal, 14(4): 69-74.
Monti, M., (1972). Deposit, credit and interest rate determination under alternative bank objective functions. In: K. Shell and G. Szego, eds, Mathematical methods in investment and finance, North-Holland, Amsterdam, 431-454.
Nathan, A., Neave, E., (1989). Competition and contestability in Canada’s financial system: Empirical results. Canadian Journal of Economics 22, 576-594.
Pinho, Paulo (1995a). Publicity as a competitive instrument. Estudos sobre o sistema bancário português, 91-99, Janeiro.
Pinho, Paulo (1995b). Scale economies and productive efficiency. Estudos sobre o sistema bancário português, 33-51, Janeiro.
Pinho, Paulo, (2000). The impact of deregulation on price and non-price competition in the Portuguese deposits market. Journal of Banking and Finance 24, 1515-1533. Pinho, Paulo, (2001). Do banks price their loans efficiently? Evidence from Portugal.
Rhoades, S., (1977). Structure-performance studies in banking: A summary and evaluation. Staff Economic Studies # 82, Board of Governors of the Federal Reserve System. Washington, DC.
Rhoades, S., (1982). Structure-performance studies in banking: An updated summary and evaluation. Staff Economic Studies # 119, Board of Governors of the Federal Reserve System. Washington, DC.
Roberts, M., Samuelson, L., (1988). An empirical analysis of dynamic non-price competition in an oligopolistic industry. Rand Journal of Economics 19 (2), 200-220.
Shaffer, S., (1989). Competition in US banking industry. Economics Letters 29, 321-323.
Shaffer, S., (1993). A test of competition in Canadian banking. Journal of Money, Credit, and Banking 25, 49-61.
Spiller, P., Favaro, E., (1984). The effects of entry regulation on oligopolistic interaction: The Uruguayan banking sector. Rand Journal of Economics and Management Science 15 (2), 244-254.
Videira, Arménio, (2000). Marketing and customer loyalty. Inforbanca, N.º 46, July/September
Weiss, L., (1989). Banking. In: Weiss, L (Ed.), Concentration and Price. MIT Press. Cambridge, MA, pp. 219-254.