UNIVERSIDADE DE LISBOA
FACULDADE DE CIÊNCIAS
DEPARTAMENTO DE INFORMÁTICA
ProGenViZ: a novel interactive tool for prokaryotic
genome visualization and comparison
Bruno Filipe Ribeiro Gonçalves
DISSERTAÇÃO
MESTRADO EM BIOINFORMÁTICA E BIOLOGIA COMPUTACIONAL
ESPECIALIZAÇÃO EM BIOINFORMÁTICA
UNIVERSIDADE DE LISBOA
FACULDADE DE CIÊNCIAS
DEPARTAMENTO DE INFORMÁTICA
ProGenViZ: a novel interactive tool for prokaryotic
genome visualization and comparison
Bruno Filipe Ribeiro Gonçalves
DISSERTAÇÃO
MESTRADO EM BIOINFORMÁTICA E BIOLOGIA COMPUTACIONAL
ESPECIALIZAÇÃO EM BIOINFORMÁTICA
Dissertação orientada por:
Professor Doutor João André Nogueira Custódio Carriço
Professor Doutor Octávio Fernando de Sousa Salgueiro Godinho Paulo
2014
i
Abstract
Everyday new sequencing data and draft microbial genomes are obtained by high-throughput sequencing (HTS) and made publicly available at NCBI Sequence Read Archive (www.ncbi.nlm.nih.gov/sra) and EBI European Nucleotide Archive (http://www.ebi.ac.uk/ena). It is now perceived that the limiting factor is not obtaining the sequence data but the current capacity of the existing analysis methods to extract relevant information from data. This procedure is still often dependent on the use of expensive software or open-source freely available software that commonly has a high level of complexity to operate. The combination of this factors are currently leading to large amounts of data in public databases, but its analysis are usually limited in nature.
The visual representation of data has a very important role in the perception of complex information. When used in combination with methods for comparison and querying of genomic data, different visualization methods can be used to facilitate and guide the identification of interesting features. In Microbiology, the ability to visualize and compare genomes can be applied in the development of genomic epidemiology studies, as well as to identify and characterize microorganisms by determining lineages associated to antibiotic resistance, pathogenicity and virulence. These methods can assist in the detection and prevention of infectious diseases. However, this is a recent area of research that is still missing visualization tools to compare prokaryotic genomes in terms of gene content variation that offer interactive ways to explore data. Here, we present ProGenViZ, a user-friendly web-application that gives options to visualize and explore several prokaryotic genomes and their annotations, also providing features to compare specific genomic regions. Moreover, it provides additional features such as the re-annotation of genes, ordering of draft genome sequences against a reference genome and subsequent annotation by annotation transfer from one or more references. ProGenViZ is available at http://darwin.phyloviz.net/ProGenViZ.
Keywords
Visual Analysis; Comparative Genomics; Prokaryotes; High-throughput sequencing;
Sequence annotation
iii
Resumo
Todos os dias, novos dados de genomas de vários organismos são obtidos através de sequenciação de alto débito (high-throughput sequencing ou HTS) e são tornados públicos no NCBI Sequence Read Archive (www.ncbi.nlm.nih.gov/sra) e no EBI European Nucleotide Archive (http://www.ebi.ac.uk/ena). Actualmente, o factor limitante não é a obtenção dos dados genómicos mas sim a capacidade actual dos métodos de análise para extrair informação relevante deles. Este processo é ainda muitas vezes dependente do uso de software de custo considerável ou, no caso de ser gratuito, apresenta um nível elevado de complexidade. A combinação destes factores estão a contribuir para a acumulação de dados nas bases de dados públicas mas que têm a sua capacidade de análise limitada.
A representação visual de dados complexos é bastante importante na percepção e apreenção de informação contida nos dados. Quando usada em combinação com métodos de comparação e exploração de dados genómicos, diferentes métodos de visualização podem ser usados para facilitar a identificação de caracteristicas relevantes em diversos estudos. Em Microbiologia, a capacidade de visualizar e comparar genomas pode ser aplicada em estudos epidemiológicos, bem como na identificação e caracterização de organismos através da determinação de linhagens associadas a resistência a antibióticos, patogenecidade e virulência, que podem assistir na detecção e prevenção de doenças infecciosas. No entanto, esta é ainda uma área de pesquisa recente onde faltam ferramentas de visualização que permitam comparar genomas de procariotas em termos de variação genómica em várias escalas e que ofereçam formas interactivas para explorar os dados.
Nesta tese foi desenvolvido o ProGenViZ, uma aplicação web que oferece opções para visualizar e explorar simultaneamente múltiplos genomas de procariotas e suas anotações, fornecendo também funcionalidades para comparar regiões genómicas específicas. Além disso, a aplicação fornece capacidades adicionais como a re-anotação de genes, ordenação de sequências de genomas parciais contra contra um genoma de referência e subsequente anotação por transferência de uma ou mais sequências de referência. ProGenViZ está disponível em http://darwin.phyloviz.net/ProGenViZ.
Para o desenvolvimento da estrutura básica da aplicação web foi utilizado o Bootstrap framework. A área de trabalho foi dividida em duas partes, uma com vários menus interactivos que permitem ao utilizador realizar várias análises aos dados carregados e outra com a representação visual das sequências genéticas e suas anotações. A aplicação aceita como input
iv
ficheiros no formato GenBank/EMBL, General Feature Format (GFF) e FASTA, bem como ficheiros com sequências múltiplas (multi-FASTA), tipicamente provenientes de genomas parciais.
O ProGenViZ apresenta uma nova abordagem para conseguir visualizar vários genomas de procariotas numa única imagem. Utiliza uma representação abstracta onde as sequências genómicas são divididas de acordo com as suas anotações em regiões para reduzir a complexidade da visualização. As regiões são depois divididas em várias porções de 500 pares de bases de acordo com o seu tamanho e apresentadas numa de duas representações visuais baseada em grafos - hive plot ou numa representação linear – que foram desenvolvidas utilizando o a biblioteca de JavaScript D3. Foram também produzidas várias formas de interação entre as duas representação visuais e o utilizador através de zoom em regiões específicas, mas também através da disposição de informações sobre cada região e de menus que fornecem funcionalidades adicionais que permitem explorar e comparar os ficheiros carregados.
Foi também desenvolvido um sistema de pesquisas que o utilizador pode realizar aos dados. É possível aceder a informação global sobre os ficheiros ou fazer pesquisas sobre regiões específicas. No caso do acesso a informação global sobre os ficheiros, o utilizador pode aceder a dados como o tamanho total das sequências e a percentagem que está anotada, ou a estatísticas associadas com a distribuição do tamanho das diferentes regiões e dos seus produtos. As distribuições do tamanho e dos produtos das regiões são representados graficamente na forma de um gráfico de barras e de um gráfico circular interactivos, que dão a capacidade ao utilizador de filtrar os dados que são mostrados.
Procuras por regiões específicas e comparações podem também ser feitas através das anotações – por nome ou por produto - ou através do uso de sequências internas ou externas para determinar regiões com homologia de sequência utilizando BLAST. Os resultados de todas as procuras e relações entre regiões são apresentados numa tabela de resultados e através de modificações específicas na representação visual. Quando são estabelecidas relações entre
regiões, essas relações são mostradas nas representações visuais através de ligações entre as regiões envolvidas, o que permite visualizar a sintenia entre as regiões de diferentes sequências
genómicas.
Além dos resultados do BLAST serem mostrados em forma de texto na tabela de resultados e através de modificações na imagem, foi também criada uma forma de visualizar os alinhamentos ao nível da sequência nucleotídica. Adicionalmente são ainda detectados single
nucleotide polymorphisms (SNPs) através da utilização de uma funcionalidade do software
v
Como actualmente as tecnologias de HTS permitem obter rapidamente informação sobre genomas parciais, no ProGenViZ foi também incorporada a possibilidade de visualizar e analisar ficheiros com múltiplas sequências provenientes de sequenciação destes genomas (contigs). Além de ser possivel aceder tanto às informações globais como realizar qualquer uma das procuras referidas anteriormente, foi também desenvolvida uma funcionalidade para ordenar os contigs contra um genoma de referência, o que fornece uma perspetiva global de quais e de que forma os contigs estão distribuídos ao longo da sequência de referência. Além disso, como normalmente as sequências parciais após serem geradas não têm qualquer anotação, foi também criada uma abordagem para anotá-las através de transferência de anotações de um genoma anotado de referência através da combinação dos resultados dos software Prodigal e BLAST. O Prodigal, um software de previsão de genes em procariotas, é utilizado para prever
coding sites (CDS) nos contigs enquanto que o BLAST é utilizado para determinar se alguma região do genoma de referência tem similaridade com o gene previsto pelo Prodigal.
Ao terem sido criadas maneiras de estabelecer relações entre regiões de diferentes ficheiros foi fornecida ao mesmo tempo uma forma de monitorizar a qualidade das anotações através de similaridade de sequência. Como algumas anotações pré-existentes podem estar erradas, foi desenvolvida uma funcionalidade para re-anotar o nome e o produto das diferentes
regiões.
Criámos também uma série de funcionalidades para exportar dados da aplicação. Podem ser exportados os resultados apresentados nas tabelas, imagens, sequências genómicas específicas, bem como toda a informação existente de regiões e sequências genómicas associadas a cada um dos ficheiros carregados na aplicação.
Para demonstrar as diferentes capacidades da aplicação são também mostrados três casos de uso. No primeiro caso de uso são procurados os genes pertencentes ao esquema MLST de Streptococcus pneumoniae em dois genomas anotados para focar as capacidades do programa de realizar procuras por genes através do seu nome, produto e sequência. Esta análise demonstra os actuais problemas das anotações automáticas onde nem sequer os genes essenciais para manter funções básicas da célula estão bem anotados. Foi também possível determinar a existência de inversões na localização de dois dos genes após análise da representação visual.
No segundo caso de uso são procurados os genes regulatórios inseridos no locus da biosíntese da cápsula do serotipo 1 de Streptococcus pneumoniae num ficheiro de contigs para ilustrar as capacidades da aplicação para encontrar regiões de interesse em contigs. Nesta
vi
análise é possível encontrar todos os genes regulatórios bem como outros pertencentes ao mesmo locus num único contig.
Finalmente, no último caso de uso, dois ficheiros com sequências parciais obtidas depois
de sequenciar dois organismos da estirpe Streptococcus pneumoniae OXC141 e um genoma
anotado da mesma estirpe são utilizados para mostrar as capacidades do programa para ordenar e anotar todos os contigs de um ficheiro contra uma referência. Com esta abordagem de transferência de anotação por homologia foi possível transferir de uma media de 87% de anotações da referência para os ficheiros de contigs.
Palavras Chave
Análise Visual; Genómica Comparativa; Procariotas;Sequenciação de alto débito; Anotação de sequências
vii
Acknowledgments
First of all, I would like to thank my supervisors João Carriço and Octávio Paulo for all the support they gave me through all the work done is this thesis. Especially to João, I am grateful for all the opportunities you gave me and for all the knowledge and motivation you were able to get into me. I must say that you are a true inspiration and model on how work should be done in these areas.
I would also like to acknowledge all my colleagues and researchers in the Microbiology and Infection Unit group of Instituto de Medicina Molecular who welcomed me with open arms for the last months. I am very thankful for all their help, suggestions and contributions to this thesis.
A big thanks to all my friends who were always there when I needed to refresh my mind. Many thanks to all my family, especially to my grandparents, for all the support though my entire life. I would like to apologize to them for not receiving as many attention as they deserved for the last months.
To Sofia, a thanks with the size of the world, for all the love, support, optimism and comprehension. Sometimes it was not easy, but you were always there for me.
And finally, a big thanks to my parents and my brother, to whom I dedicate this work, for everything they have done for me, since ever. Without your full support I would never be here.
ix
Contents
1 Introduction ... 2
1.1 Context and motivation ... 2
1.2 Contributions ... 3
1.3 Thesis outline ... 3
2 Background ... 6
2.1 DNA sequences ... 6
2.2 DNA sequencing technologies ... 7
2.2.1 First DNA sequencing technologies ... 7
2.2.2 Human genome project ... 9
2.2.3 High-throughput sequencing (HTS) technologies ... 10
2.3 Whole-genome sequencing (WGS) and Microbiology ... 12
2.4 Sequence alignment and annotation ... 13
2.4.1 Sequence alignment algorithms ... 13
2.4.2 Sequence annotation ... 15
2.5 Genome data visualization ... 16
2.5.1 Visualization theory ... 16
2.5.2 Genomic sequences and whole genome visualization ... 19
3 Developed framework ... 24
3.1 Overview ... 24
3.2 Implementation ... 24
3.2.1 Input processing ... 25
3.2.2 Main work area ... 25
3.2.3 Genomic data visualization ... 25
3.2.4 Querying on genomic data ... 29
3.2.5 Visualizing results of queries on specific genomic regions: Hits table and representation modification ... 33
3.2.6 Visualizing sequence alignment at nucleotide level ... 35
3.2.7 Operations with contigs ... 35
3.2.8 Editing gene annotations ... 36
3.2.9 Exporting Data ... 38
4 Use Cases ... 40
Use case 1 – Search for the MultiLocus Sequence Typing (MLST) scheme genes of Streptococcus pneumoniae ... 40
Use case 2 – Search for Capsule Biosynthesis locus (cps) genes in Streptococcus pneumoniae contigs ... 45
x
Use case 3 – Streptococcus pneumoniae OXC141 contigs annotation ... 48
5 Discussion & Final Remarks ... 52
5.1 Discussion ... 52
5.2 Final Remarks & Future Work ... 57
6 Bibliography ... 60
7 Appendices ... 68
Appendix-1 – Allele sequences of the MLST scheme genes of S. pneumoniae used in use case 1 ... 68
xi
List of Figures
Figure 2.1: Central dogma of molecular biology proposed by Francis Crick in 1970 ... 7
Figure 2.2: Representation of the Sanger's method to sequence DNA. ... 8
Figure 2.3: HTS platforms ... 11
Figure 2.4: BLAST results visualization from the NCBI website ... 14
Figure 2.5: A generic process for genome annotation ... 15
Figure 2.6: Ware’s diagram of the visualization process ... 18
Figure 3.1: The two distinct menus of the application. ... 26
Figure 3.2: Representation of a part of the Streptococcus pneumoniae OXC141 genome and definition of node and region. ... 27
Figure 3.3: The two visual representations developed... 28
Figure 3.4: Visual representations of the Streptococcus pneumoniae 70585’s product and gene size distribution ... 30
Figure 3.5: The different query results tables ... 32
Figure 3.6: Links between regions of different files... 34
Figure 3.7: The contig annotation process. ... 37
Figure 4.1: Global synteny of the MLST scheme genes in Streptococcus pneumoniae 70575 and Streptococcus pneumoniae 670-6B. ... 44
Figure 4.2: External sequence queries in contigs of Streptococcus pneumoniae INV 104 and annotation against an annotated reference genome. ... 47
xiii
List of Tables
Table 2.1: Summary of some of the currently available alignment viewers, genome browsers and
comparison viewers ... 21
Table 4.1: Results after performing basic queries by name for all genes from the MLST scheme
of S. pneumoniae. ... 41
Table 4.2: Results after performing basic queries by product for all genes from the MLST scheme
of S. pneumoniae. ... 42
Table 4.3: Results after performing external sequence basic queries of alleles taken from the
MLST database of all seven S. pneumoniae MLST scheme genes. ... 43
1
1
Introduction
2
1 Introduction
1.1 Context and motivation
In the recent years, high-throughput sequencing (HTS) has revolutionized the methods to obtain genomic data. Currently (November 2014) in NCBI there are 3249 prokaryotic genomes classified as complete and 13808 classified as draft genomes and each day more sequences are made publicly available. This ability to quickly get large volumes of information make HTS technologies able to be used in different types of studies, in particular the characterization of organisms and detection of sequence variation.
In Microbiology, HTS technologies provide the ability to obtain microbial draft genomes in a reduced period of time which can be used in the development of genomic epidemiology studies, as well as to identify and characterize microorganisms by determining lineages associated to antibiotic resistance, pathogenicity and virulence that can assist in the detection and prevention of infectious diseases[1]. However, despite the existence of the methods required to obtain genomic data, currently the limiting factor is the capacity of the existing analysis methods to extract relevant information from data since there are still missing visualization tools to compare prokaryotic genomes in terms of gene content variation that offer
interactive ways to explore data
.
Many of the software available are expensive or open-sourcefreely available software that commonly has a high level of complexity to operate, which limits the analysis of the data.
The creation of data driven images has been one of approaches to cope with the data from genomic sequences. The visual representation of data can join a single image information of one or more genomes and helps determine characteristics of the data that otherwise would not be possible such as genomic rearrangements through global representations of genomes or even sequence level variation when we have visual representations of nucleotide sequences. Also, when used in combination with methods for comparison and querying of genomic data, different visualization methods can be used to facilitate and guide the identification of interesting features.
Ideally, a tool to visualize and compare genomic data has to be able to import different available data formats, export the data and resulting visualizations, allow the comparison, display and exploration of unique sets of genes or entire genomes, as well as promote an interaction between the user and the image in order to assess the information at different levels[2]. However, the existing sequence comparison tools lacked some of these desired features. Some do not allow users to upload their own data and create difficult to interpret
3
representations or require installation of specific programs to be used. Others lack interaction between the user and the program, not giving control of the comparisons that are made. Also, a large majority of genome comparison applications focus only on a global associations, forgetting the relationships between specific sites in the genome.
Having all these concerns in mind, the aim of this thesis is to provide a public web-application to visualize, explore and compare prokaryotic genomes and draft genome data. We also want to offer other functionalities such as the re-annotation of genes, ordering of draft genome sequences against a reference genome and subsequent annotation transference from one or more references, allowing draft genome annotation of coding sequences.
1.2 Contributions
The contributions of this thesis to the area are:
A new user-friendly interactive interface for viewing, explore and compare multiple
genomes and draft genomes of prokaryotes, incorporating the BLAST[3], NUCmer[4] and Prodigal[5] software.
The creation of a novel genome abstraction method that uses two visual
representations based on graphs (Hive Plot and Linear) to display multiple genomes and draft genomes of prokaryotes and comparisons between them.
A visual interface to reorder draft genomes data against a reference genome, using
already established methodology.
The development of a system to annotate coding-sites (CDS) in draft genomes by
transferring annotations from one or several annotated reference sequences.
The development of a system to re-annotate genes.
1.3 Thesis outline
This thesis is composed of three distinct parts: background, developed framework and use cases. In the first part, we present a historical overview since the discovery of DNA to the development of the different sequencing technologies, some of the methods used to align and annotate sequences, as well as some of its applications. Also, we show the theory to be considered when building a data driven visual representation and the different categories of software currently available to visualize and compare genomic data. In the second part, the
4
functionalities of a new tool to visualize, explore and compare multiple prokaryotic genomes and draft genome data is described. Finally, some of the applications of the developed tool are shown.
5
2
Background
6
2 Background
In this chapter, we provide an historical overview of events since the discovery of DNA to the creation of DNA sequencing technologies, some of its applications in Clinical Microbiology and some of the methods used to align and annotate sequences. Then, the theory to develop a good visualization system, as well as the existing methods to visualize, explore and compare genomic data are discussed.
2.1 DNA sequences
Since the early days of scientific research, researchers attempt to discover the reasons behind different characteristics exhibited by a population of individuals. Gregor Mendel, the proclaimed father of genetics, gave the first steps in 1865 on this subject and described the laws of genetic traits transfer through the study of crosses between peas[6]. Knowing that something had to be responsible for the transmission of these characteristics, Ernst Haeckel in 1866 suggested that these factors would be located in the nucleus[7] and Friedrich Miescher isolated the first DNA molecule from leukocytes in 1869[8]. Parallel to the findings associated with cytology, new ideas and concepts associated with heredity and evolution emerged in 1858 with the Theory of Evolution by Natural Selection by Charles Darwin, that were later published in the book “On the Origin of Species by Means of Natural Selection”[9].
It was necessary to wait until the next decade for the DNA to be thoughtful studied by Avery, MacLeod and McCarty who proposed a hypothesis where the DNA would function as genetic material, contrary to the common belief that proteins fulfilled this role[10]. This results would be confirmed in 1952 by Hershey and Chase that used bacteriophages T2 to demonstrate that phagic DNA enters the bacteria while viral proteins not[11].
Despite the certainty of DNA as genetic material and its role in passing traits between organisms, its structure remained to be discovered. It was then, in 1953, that Rosalind Franklin and Maurice Wilkins, using an X-ray analysis, obtained the first data on the repetitive helix structure of DNA. Its double-helix molecular structure would finally discovered by James Watson and Francis Crick in the same year[12].
At that time, one of the puzzles that was still unsolved was how the replication would proceed in cell division. Many were the models proposed but it is the semi-conservative model, where each original semi-helix molecule function as a template for the production of two identical ones, that is currently accepted[13].
7
It was only after the proposal of the central dogma of molecular biology by Francis Crick in 1958[14], that would later be modified (Figure 2.1), that he and his colleagues would decipher the genetic code in 1961[15]. At the same time, new ways to manipulate sequences were being discovered that led to the possibility of using restriction enzymes to break DNA at specific sites and also to the production of the first pieces of recombinant DNA[16, 17].
Knowing that DNA was then linked to heredity and having now the ability to modify specific regions of sequences, it was necessary to begin developing tools to start characterizing the genomes of different organisms and to discover the differences between them.
2.2 DNA sequencing technologies
DNA sequencing techniques are very important in many areas of scientific research. A large number of scientific areas are taking advantage of these technologies, such as molecular biology, biotechnology, forensic science, genetics, ecology and environmental research[18–21]. However, a series of events were necessary to evolve from the sequencing of a very small number of nucleotides up to the megabases of information that are currently possible to obtain with the high–throughput technologies (HTS).
2.2.1 First DNA sequencing technologies
Early forms of DNA sequencing are quite time consuming, complex, and their laboratory work are very difficult and intense. The described sequence of the first 24 base pairs from the
Figure 2.1: Central dogma of molecular biology proposed by Francis Crick in 1970, with some
8
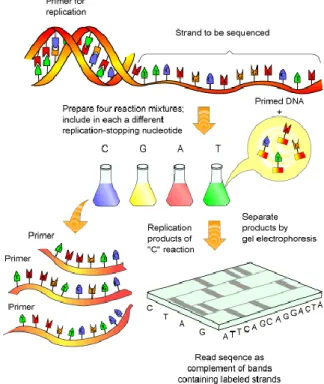
lac operator was pioneer and it was a job made by Maxam and Gilbert with a method known as wandering spot-analysis[22]. From that point on, efforts where directed to reduce the complexity on how to obtain sequences. The first breakthrough was in 1977 when also Maxam and Gilbert described a method to reveal the nucleotides of a sequence through the cleavage of DNA sequences in specific sites by chemical degradation and consequent hybridization in electrophoresis gel[23]. In the same year, Frederick Sanger began to develop an efficient technique to sequence DNA, the chain-termination[24](Figure 2.2). The method consists in the use of a primer that anneals with the desired sequence, a DNA polymerase, and a series of dideoxynucleotide triphosphates (ddNTPs) that inhibit chain extension to create sequences of various lengths. By using this method, it is possible to determine which position belongs to each nucleotide in the sequence only by their disposition at the electrophoresis gel. Through the development of these techniques and for the pioneering work that led, as consequence, to the creation of improved methods for DNA sequencing, Sanger and Gilbert shared the Nobel Prize for Chemistry in 1980[25].
During the next decade, Sanger’s sequencing was widely adopted by the community and was improved, mainly by the automation of the process. The first automated sequencer used a modification of the Sanger’s method that consisted in the use of specific fluorophores linked to each one of the nucleotides with its detection and interpretation being made computationally[26].
9
2.2.2 Human genome project
The Human Genome Project was a collaborative large-scale project which aimed at mapping and understanding all genes of the human being. The efforts to complete this project made it possible the development of new technologies, development of genomic maps of various organisms, as well as a well-designed sequence of the human genome[27].
The first serious thought to the possibility of sequencing the human genome were expressed in 1985 by the Director of University of California at Santa Cruz at the time, Robert Sinsheimer[28]. The idea would be considered a bit premature given the lack of resources to develop the project. However, in 1988, the U.S. National Research Council of the U.S. National Academy of Sciences proposed the beginning of the Human Genome Project (HGP), with a deadline of 15 years, despite the high cost of sequencing a nucleotide base at the time[27].
Since the early development of the project, one of the priorities was the creation of new methods to reduce the sequencing cost and increase the number of nucleotides sequenced per time unit[29]. Several steps were taken to reduce the necessary human intervention and thus make the process as automated as possible. Some factors were crucial to improve the sequencing processes, especially the emergence of commercial sequencing machines and the improvement of sequence assembly procedures[30].
With the emergence of capillary sequencing, which sequences DNA through a modification of the Sanger method and analyses several samples simultaneously[31], and also by the development of techniques that improved the data’s quality and throughput, such as the shotgun sequencing procedure[32], improved fluorescent dyes[33, 34] and specific polymerases for sequencing[35], it was possible to give a boost to the success of the HGP. Due to the cooperation between various groups, it was also possible to develop the idea of "open" culture and information sharing between researchers, technologies and software[27]. This was the first time that software played a major role in the determination of sequence similarity and assisted in genome assemblies.
In 2001, the first drafts of the human genome were published, with about 90% of the full sequence[36, 37]. In the following years, studies were carried out to increase the coverage and quality of those results[38].
For over two decades, sequencing was dominated by Sanger’s automated method. Although the evolution of techniques during this time led to the sequencing of the human genome, limitations associated with the expensive cost per base have shown that the creation of new technologies was needed to achieve the sequencing of various genomes in less time[39].
10
To make this possible, the priority was to develop tools capable of producing greater volumes of information, with greater coverage and lower financial costs, in order to produce whole-genome sequencing more quickly and with more quality. To achieve that goal, the HTS technologies were developed.
2.2.3
High-throughput sequencing (HTS) technologies
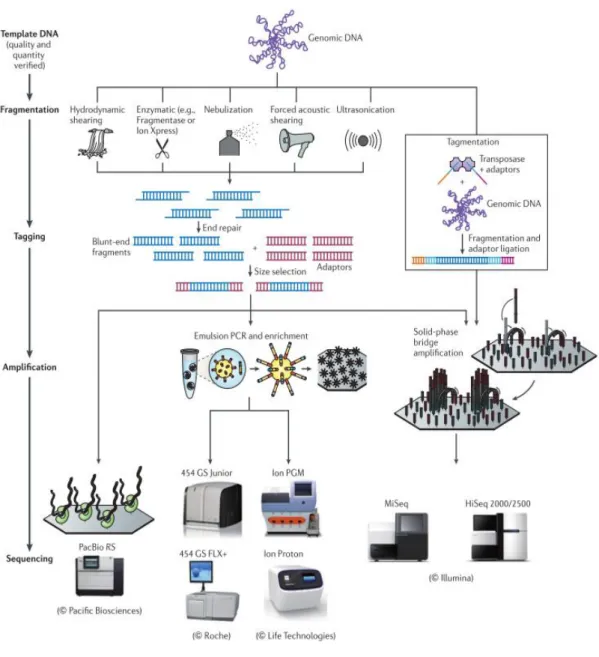
HTS technologies are a group of sequencing methodologies characterized by the production of a large amount of genomic data in a short period of time. They generate megabases of genomic information in the way of small DNA fragments – reads - which are then assembled into larger sequences – contigs - using specific assembly software. Currently, there are several HTS platforms available (Figure 2.3) that are organized into two major groups: those who need template amplification and those who use single molecule sequencing. Information about the technical aspects of the different technologies can be found described elsewhere[40, 41].
The differences between each sequencing technology are mostly associated with their monetary cost, read’s size and sequencing quality. However, has to be said that the sequencing error probability of these platforms continues superior when compared to machines with Sanger technology[42].
Technologies that need template amplification – also called next-generation sequencing technologies (NGS) - differ primarily in 3 parameters: library creation, template amplification, and sequencing method. According to the amount of data that are capable of producing, platforms belonging to this category can range from the expensive high-end instruments that generate massive amounts of sequencing data such as the HiSeq instruments, Genome Analyzer IIx, SOLiD 5500 series and the 454 GS FLX+ system, to the most recent bench-top instruments with less throughput but ideal for rapid sequencing analysis and for microbial applications, such as MiSeq, 454 GS Junior and Ion Personal Genome Machine. On the other hand, single molecule sequencing platforms use a real time sequencing approach that as the advantage of eliminating the possible artefacts generated by sequence amplification and ends the need to make library preparations[43]. However, they have a high error rate and are extremely expensive. The Helicos BioSciences’ HeliScope Single-Molecule Sequencer was the first single-molecule sequencing platform and more recently was developed the PacBio RS from Pacific Biosciences.
All these technologies revolutionized the sequencing methods and now we have the ability to produce genomic data thousands of times more cheaply than is possible with Sanger sequencing, something that would have been unthinkable a few years ago. These technologies
11
led to the current ability to obtain sequences of entire genomes and analyse them. In the next sections are described some of the whole genome sequencing (WGS) applications in Microbiology and also some of the existing methods to analyse DNA sequences such as sequence alignment methods and the strategies used to discover and infer gene locations in the sequences. Moreover, some of the existing software to visualize, explore and analyze sequencing data are described.
Figure 2.3: HTS platforms. Are described the different library preparation procedures and the methods
12
2.3 Whole genome sequencing (WGS) and Microbiology
HTS technologies enabled the development of whole genome sequencing (WGS) which leads to the generation of draft genomes that can be applied in different branches of Biological Sciences. Nevertheless, it is through the comparison of multiple genome sequences that relevant facts in the genome organization can be found. Comparative Genomics is a large-scale, holistic approach that compares two or more genomic sequences to discover the similarities and differences between them and to study the characteristics of the individual genomes[44]. Through this methodology, it is possible to study genomic rearrangements, find orthologs or paralogs, and compare gene content, among others.
One of the research areas that has benefited both from WGS as Comparative Genomics is Microbiology. The ability to sequence entire microbial genomes in a short time with bench-top sequencers and the identification of genomic regions of interest by comparing with reference sequences, is something that is currently within reach of all laboratories. Especially for bacteria, Comparative Genomics is being used for the fast identification of strains and to infer their evolutionary history, as well as to discover novel virulence factors and vaccine targets[45].
The potential of WGS for diagnosis and epidemiological studies was recognized in the last years[46, 47]. Although in the present WGS is still expensive to be used commonly in clinical microbial laboratories, its application in clinical samples in the future could reduce diagnostic times and thereby improve disease control and treatment. In the last few years, WGS has already been applied in outbreak investigations[48, 49]. Moreover, approaches to determine the efficacy of a comparative analysis to detect strain manipulation leading to increased virulence or antibiotic resistance in case of epidemic outbreak or a bioterrorist attack have been studied[50].
WGS is also revolutionizing molecular genotyping methodologies, mainly the sequence base typing methods[47]. Currently, methods like MultiLocus Sequence Typing (MLST) use only specific fragments of seven housekeeping genes to identify strains. This method, due to its limited number of target loci, as shown some lack of discriminatory power for resolving closely related strains, while providing an excellent tool for global population analyses. By analysing a broader range of loci on the scale of hundreds or thousands, WGS is proving to be a disruptive technology in the field, offering the highest discriminatory power available for epidemiological studies[47].
All these new perspectives that the combination of comparative genomics with WGS provide, not only for Clinical Microbiology but also for numerous other areas, will surely
13
revolutionize the genetic analyses that are made today. However, we are still on the early days of this novel technology and there is a long road ahead. We must develop better automatic annotation pipelines to deal with the continuous increase of genomic data and reduce the current persistent annotation errors. Moreover, we must create novel algorithms for quality control to guide the needed manual curation analysis. Also, visualization and genome mapping tools demand less complexity of use and a better representation of genome structures at different levels. The growth of Comparative Genomics analysis and its effective application in research and clinical settings will depend on how fast we can overcome these limitations.
2.4 Sequence alignment and annotation
A great variety of tools have been developed during the years to carry out studies using sequencing data since there is a need to analyse the information obtained from HTS. Sequence comparison, alignment, and annotation are some of the areas that need specific methods and software to produce the best results possible, more quickly and efficiently[2].
2.4.1 Sequence alignment algorithms
The main tools for sequence analysis and comparison are the sequence alignment algorithms. Sequence comparison allow users to obtain results that are biologically relevant such as search for orthologous genes[51], detection of variants[52], establish evolutionary relationships[53] and produce genome assemblies[54]. In these tools, most of the algorithms are grouped in one of three categories: algorithms based on hash tables, algorithms based on suffix trees and algorithms based on merge sorting[55]. This classification depends on the auxiliary data structure that is used in those algorithms.
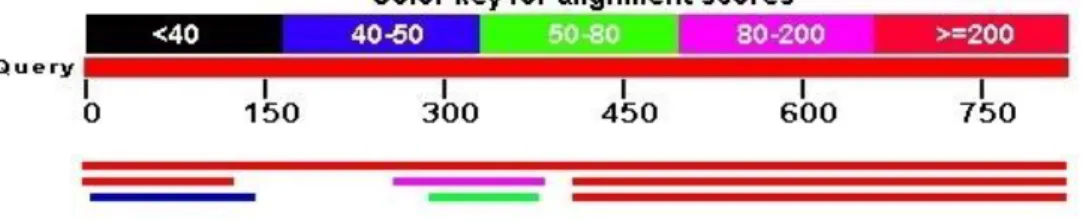
One of the most popular algorithms to align sequences is BLAST[3] (Figure 2.4), an algorithm based on hash tables which allows comparisons between a query sequence and a database of sequences to find regions of local similarity. BLAST algorithm is available at the National Center for Biotechnology Information (NCBI) and may also be used locally. There are several programs based on BLAST that can be used, adapted to different types of sequences and operations. Some are used to compare nucleotides (BLASTN), others to make comparisons between protein and nucleotide sequences (BLASTX) or just between proteins sequences (BLASTP). The algorithm works in three steps[56] and many variables can be changed to adjust the sensitivity and speed of the comparisons between the query sequences and the database.
14
In the first step, there is a filtering of low complexity regions and then the query sequence is divided into sub-sequences. In a second stage, the previously generated sub-sequences are searched in the database and the results act as seeds for the determination of high-scoring segment pairs (HSPs). The search for these sub-sequences of defined size reduces the total number of comparisons that are required. Finally, there is a merge of seeds without gaps, followed by an extent on both sides using the Smith-Waterman algorithm[57] to find the best alignment possible. Only the alignments with a score higher than the cut-off score (S) determined are listed and returned as maximal scoring pairs (MSPs).
BLAST has been one of the most essential tool for research in Biological Sciences. Revolutionized the way of how to do analysis in various fields of research, answering several questions that could not be answered in laboratory and made the bioinformatics analysis accessible for researchers around the world. However, other alignment tools have emerged that have some useful characteristics for certain kinds of studies. Algorithms based on suffix trees have an approach which seek for the reduction of inexact matching by first identifying exact matches and only then build inexact alignments. One of those tools is MUMmer[58] package, a software that allows from alignment of entire genomes, and also alignment of contigs against a reference using NUCmer algorithm (nucleotide MUMmer)[4]. MUMmer has an approach that combines suffix trees, longest increasing subsequence (LIS), and the Smith-Waterman algorithm, to try to find regions that are exactly equal between two sequences (maximal unique matches - MUMs). Those regions function as starting points for the alignment. In the case of NUCmer (nucleotide MUMmer)[4], it uses MUMmer to map contigs against a reference sequence. Then, it uses a clustering algorithm on the MUMs to determine their location in the reference.
With the use of HTS and the ability to produce draft genomes in a short time, contigs can play an important role in the detection of genetic variations among organisms by detecting specific regions within them. However, there are few tools available that use contig files and allow their comparison with other sequences.
Figure 2.4: BLAST results visualization from the NCBI website (http://blast.ncbi.nlm.nih.gov/Blast.cgi).
15
Other alignment algorithms have been created to deal with specific sequencing data[59, 60]. Two of those alignment applications are inserted on the third category of alignment tools, the ones based on merge sorting. Slider[61] and Slider II[62] are programs that were developed specifically to improve the alignment and SNP detection of the Illumina’s output. They use an auxiliary table with pre-defined sized fragments from the reference sequence, which are then sorted in a lexicographically form. After this, read alignments with exact matches and one-off matches are determined and the SNP prediction takes place.
2.4.2 Sequence annotation
Obtaining the DNA sequence is just the starting point. The main goal is to retrieve its information. Annotation can be defined as “a process by which structural or functional information is inferred for genes or proteins”[63] and it is essential for sequence interpretation. Because of that were developed pipelines to annotate genomic sequences (Figure 2.5).
Usually, sequence annotation relies on an automated annotation and a posterior manual curation[64]. However, at the rate that genetic information is produced, it is impossible to annotate all genes manually.
One of the critical steps to produce automatic annotations is the prediction of genes. There are several programs for this purpose but each of them has characteristics that make them more suited for the use in a particular species or type of gene that is intended to predict[65]. In the case of Prokaryotes, genes are organized in specific ways, having characteristic elements such as transcription promoter and terminator, operator, ribosome binding site (RBS), and start and stop codons between open reading frames (ORF). In order to predict the gene locations, the developed algorithms are based
on the detection of these elements, mainly ORFs, in order to get an idea of how genes are organized and distributed throughout the genome. One of the programs that allows the
Figure 2.5: A generic process for genome
16
identification of genes in prokaryotic sequences is Prodigal[5]. It uses a “trial and error" approach to search for genes, which begins with the search for all start and end codons included in the sequence. Then, a score is assigned to each possible gene which takes into account the bias of GC and the size of the open reading frame.
After the identification of possible gene locations, the search for homologs is typically made by BLAST-based comparison of sequences[66, 67] and then the annotation from the best hits are transferred.
Annotated genomes can be used to detect differences between organisms. However, the accuracy of automated methods used to assign annotations have been questioned over time due to errors that have been accumulating in databases[68]. Errors can emerge at different stages of the annotation process: during sequencing, as a result of gene-calling procedures, and in the process of assigning gene functions[68]; and can lead to misleading results in different types of analyses. Therefore, in order to opt for an approach to detect and compare genomic regions by their annotations, these errors have to be diminished through methodologies to detect them and then re-annotate those genomic regions efficiently.
2.5 Genome data visualization
With the increasing ability to obtain whole-genome data, the need to develop tools to visualize, explore and analyse it as increased drastically. In the following sections, some design principles and theories to take into account when building a visualization software are described as well as some of the existing tools available to visualize, explore and compare sequencing data.
2.5.1 Visualization theory
Although many genomic data analysis can be carried out automatically, the large amount of information and complexity of the results make their understanding a difficult process and human judgment is often needed to interpret the results in the light of biological knowledge. The creation of visualization methods is one of the paths to overcome these problems.
Visualization has a very important role in human perception. The human mind can process very complex information through the use of vision. We managed to get more information by sight than by all other senses combined. The human visual system is great to look for patterns recognition, and the process is facilitated through the specific visualization techniques. Although we can create mental images, the thought process is facilitated when we have diagrams, maps,
17
information graphs or other way of data representation at our disposal that allow us to solve problems through visual thinking[69]. According to Ware, information visualization is “the use of interactive visual representations of abstract data to amplify cognition", promoting mental operations with rapid access to information derived from images[69].
One of the great advantages of using images to represent data is the ability to gather large amounts of data, being possible to understand the information given by thousands of objects together. It also promotes the perception of properties of the data that would otherwise be difficult to understand, like artefacts and other errors, thus also functioning as a way of quality control.
Visual Analytics is a field of study that promotes the connection between the human and the data through the use of visual interfaces in order to obtain information the easiest way possible[70]. It also tries to increase the humans’ capacity to understand and reason about complex data, revealing at the same time some relationships that can be unexpected[70]. It was defined by Thomas et.al as “the science of analytical reasoning facilitated by interactive visual interfaces”[71] and it as the following main focus areas of study:
Creation of visual representations and interaction techniques to exploit the human eye’s
broad bandwidth pathway to let users see, explore, and understand large amounts of information simultaneously.
Use data representations and transformations that convert all types of conflicting and
dynamic data in ways that support visualization and analysis.
To create efficient forms of visualization, it is necessary to know the characteristics of the data that will be used and the operations to be carried out. To help understand how a visual representation should be made in order to improve cognition, during the years were developed a group of representational principles (adapted from[70]):
Appropriateness Principle – The visual representation should provide just the
information that is needed for the task. Additional information may be distracting and makes the task more difficult.
Naturalness Principle – Experiential cognition is most effective when the properties of
18
Matching Principle – Representations of information are most effective when they
match the task to be performed by the user.
Principle of Congruence – The structure and content of a visualization should
correspond to the structure and content of the desired mental representation.
Principle of Apprehension - The structure and content of a visualization should be
readily and accurately perceived and comprehended.
An information display system needs to have two main components: representation and interaction[72]. The representation is associated with the way that the data is arranged and displayed, while interaction involves a “dialogue” between the user and the system in order to analyse the information. This is quite important because through interaction, the limits of a static representation may be exceeded, further enhancing cognition. In his book[69], Ware states that data visualization is divided into four phases: collection and storage of information, pre-processing to transform data into comprehensible information, image production, and finally the interaction with the perceptual and cognitive system of the human (Figure 2.5). Ware also says that there is an interaction between the different phases through feedback loops,
Figure 2.6: Ware’s diagram of the visualization process. The human interact with the different data
19
which correspond to possible interactions of the user with the viewing system leading to its modification.
There are a number of established techniques to provide an effective interaction interface. Dam et al. defined an interaction technique as the way of using a physical input or output to promote the realization of a task in a dialogue between human and computer[73]. Shneiderman[74], after summarizing what for him should be a framework to follow for the design of information visualization applications: “Overview first, zoom and filter, then details-on-demand”, developed a taxonomic system to classify interaction techniques that help to understand how interaction can be added to a visual representation of data:
Overview: Gain an overview of the entire collection. Zoom: Zoom in on items of interest.
Filter: filter out uninteresting items.
Details-on-demand: Select an item or group and get details when needed. Relate: View relationships among items.
History: Keep a history of actions to support undo, replay, and progressive refinement. Extract: Allow extraction of sub-collections and of the query parameters.
Since then, several studies have proposed taxonomies with different levels of specificity that can be consulted elsewhere[72].
Visualization increases the ability to make sense of very complex data groups, such like the information generated by sequencing technologies. This makes the manual inspection of the data and the analysis of the results easier. It can also be complemented with the use of automatic methods of data analysis to successfully deal with large genomic datasets[2].
2.5.2 Genomic sequences and whole genome visualization
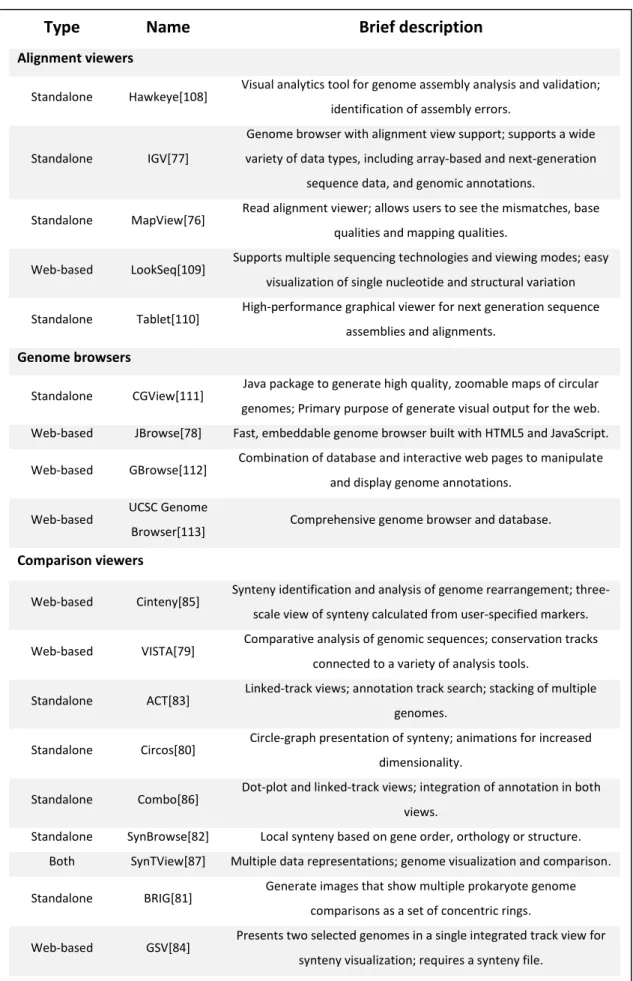
The study of DNA sequences and whole genomes of organisms became possible due to the great advances in sequencing technologies. However, to be able to make sense of all the information that is generated, it was necessary to create visualization methods to analyse the complex data that is produced. In recent years, several specific tools – alignment viewers, genome browsers, comparison software - were developed. There are a large number of applications that fall into one of these three categories and each of them has certain characteristics that makes them more capable of performing specific analysis. A summary of some of the tools that can be currently used can be found in the Table 2.1.
20
To specifically view reads alignment, assembly viewers such as EagleView[75] and MapView[76] were developed. This software category deals with large amounts of information and focus primarily on the ability to navigate, providing visual ways to test the alignment quality and to detect sequence variation. The representation of complete genome sequences remains a complicated task for these type of tools but they try to surpass their difficulties by an interactive navigation and through a division of the genomic sequence into a series of sections. This allows an optimization of the use of computer memory and increases the processing speed. To facilitate the exploration and analysis of results after an assembly or to explore complete genomes, a series of tools called genome browsers were produced. These programs are characterized by disposing sequencing data or genomes and their annotations with the help of a graphical interface, and by enabling the analysis of specific regions of interest. One of those tools is the Integrative Genomics Viewer (IGV)[77], which enables the analysis of multiple genomic regions simultaneously and allows the visualization from complete genomes to specific sequences using different levels of complexity. There are also genome browsers operating as web applications, such as the JBrowse[78]. Both genome browsers and alignment viewers have problems related to the large amount of data that can be disposed and the maximum number of genomes that can be visualized at the same time. In the future is necessary to create ways to browse and filter through the information you want to view, and enable data and visual representation editing.
In the last years were also created a series of sequence comparison software to visualize relationships between genomic data - adapted or not to the comparison of microorganisms – that use different ways to represent comparisons. Some are more useful for global genome comparisons, while others to local ones. VISTA[79] is a web-based application that represent global comparison between two genomes, showing regions with peak identity. Software like Circos[80] and BLAST Ring Image Generator (BRIG)[81] display multiple whole genome comparisons and are characterized by a circular arrangement of information which are more suited to represent global comparisons between genomes. Others use linear representations of sequences which are more focused for local comparisons. In these cases the comparisons are represented by bands or lines. SynBrowse[82] is a web-based tool that shows global and microsynteny between two genomic sequences and allows to browse for annotations and specific comparisons. Artemis Comparison Tool (ACT)[83] and Genome Synteny Viewer (GSV)[84] allow the comparison of two or more genomes, showing sites of local similarity using bands in a horizontal linear layout. ACT compares the sequences through the use of BLAST[3] or parses files directly from other comparison tools like MUMmer[58], while GSV needs a synteny
21
Type
Name
Brief description
Alignment viewers
Standalone Hawkeye[108] Visual analytics tool for genome assembly analysis and validation; identification of assembly errors.
Standalone IGV[77]
Genome browser with alignment view support; supports a wide variety of data types, including array-based and next-generation
sequence data, and genomic annotations.
Standalone MapView[76] Read alignment viewer; allows users to see the mismatches, base qualities and mapping qualities.
Web-based LookSeq[109] Supports multiple sequencing technologies and viewing modes; easy visualization of single nucleotide and structural variation Standalone Tablet[110] High-performance graphical viewer for next generation sequence
assemblies and alignments.
Genome browsers
Standalone CGView[111] Java package to generate high quality, zoomable maps of circular genomes; Primary purpose of generate visual output for the web. Web-based JBrowse[78] Fast, embeddable genome browser built with HTML5 and JavaScript. Web-based GBrowse[112] Combination of database and interactive web pages to manipulate
and display genome annotations. Web-based UCSC Genome
Browser[113] Comprehensive genome browser and database.
Comparison viewers
Web-based Cinteny[85] Synteny identification and analysis of genome rearrangement; three-scale view of synteny calculated from user-specified markers. Web-based VISTA[79] Comparative analysis of genomic sequences; conservation tracks
connected to a variety of analysis tools.
Standalone ACT[83] Linked-track views; annotation track search; stacking of multiple genomes.
Standalone Circos[80] Circle-graph presentation of synteny; animations for increased dimensionality.
Standalone Combo[86] Dot-plot and linked-track views; integration of annotation in both views.
Standalone SynBrowse[82] Local synteny based on gene order, orthology or structure. Both SynTView[87] Multiple data representations; genome visualization and comparison. Standalone BRIG[81] Generate images that show multiple prokaryote genome
comparisons as a set of concentric rings.
Web-based GSV[84] Presents two selected genomes in a single integrated track view for synteny visualization; requires a synteny file.
Table 2.1: Summary of some of the currently available alignment viewers, genome browsers and
22
file to view the comparisons. Cinteny[85] is able to represent global and local synteny among multiple genomes on 3 levels of complexity, also providing reference genomes to visualize relationships between them. Another way to visualize comparisons is through dot plots. Combo[86] shows whole genome comparisons and provides two ways to view comparisons, by dot-plot or by horizontal linear layout. Also, it supports annotations that are arranged along the axes. Finally, SynTView[87] is a web-based/desktop application to visualize genomes and comparisons of microbial organisms, which offers several ways to represent data.
23
3
Developed Framework
24
3 Developed framework
3.1 Overview
ProGenViZ is an open-source freely available web tool to compare prokaryotic genomes and HTS contig data that provides an interactive way to explore genomic data and to visualize global and local relationships between genomic regions. Moreover, it provides additional features such as the re-annotation of genes, ordering of contigs against a reference and annotation of contigs by transfer from an annotated sequence.
Throughout the description of the developed framework, italic words will mark commands that can be accessed in the application or some new terms used to identify and explain certain features of the program.
Source code is available at https://github.com/B-UMMI/ProGenViZ and the tool is available at http://darwin.phyloviz.net/ProGenViZ.
3.2 Implementation
ProGenViZ was developed using a client-server approach. On the client-side we have the processing of visualization and user interaction through a web browser, while on the server-side we have all the operations leading to the creation of the basic data structures needed for visualization representation.
The Bootstrap framework[88] was used to develop the basic structure of the web application and D3 JavaScript framework[89] to carry out all the operations associated to the creation of visual representations and user interaction.
On the server-side, in order to process genomic data, we used Python[90] scripts to parse all input files and convert them to JavaScript Notation Format (JSON)[91], BLAST to search for genomic sequences, Prodigal to predict prokaryotic gene locations, and MUMmer to order contigs and find single nucleotide variations.
In the following sections we provide a more detailed description of several implementation aspects.
25
3.2.1 Input processing
ProGenViZ accepts three distinct file formats as input: the GenBank/EMBL format, which provides the genomic sequences and their features, the General Feature Format (GFF) which only provides information about features of genomic sequences, and the FASTA format which gives only the genomic sequence itself. More detailed information about the different file formats can be found elsewhere [92–94].
To process each of these formats, we use Python scripts to create two JSON files required to create the genomic data representation and perform other tasks. One of the JSON files as information about the genomic features, while the other as the genomic sequences itself if applicable.
Because the GFF format does not contain genomic sequences, we offer an additional option to upload GFF and FASTA files together. When this happens, we merge the information of the genomic sequences provided by the FASTA file with the features provided by the GFF.
We also developed a different kind of input processing for files that have more than one genomic sequence. In the case of FASTA files with multiple contig sequences, an additional step is taken in the input processing to add a specific attribute to the JSON file, which uniquely marks each sequence. This approach is essential to represent each individual sequence properly in the place reserved for the uploaded file in the visual representation.
3.2.2 Main work area
After the user uploads the first file, they are directed to the main work area. This area is divided into two parts: actions menu and visual representation area.
The actions menu gives access to a group of features that the user can use to explore and extract information of the uploaded files and to control some aspects of the visualization (Figure 3.1-a). The different functions of each action will be described throughout this chapter.
In the second part, the visual representation area, is where the representation of files will be displayed. The way of how genomic data is shown to users is described in the following sections.
3.2.3 Genomic data visualization
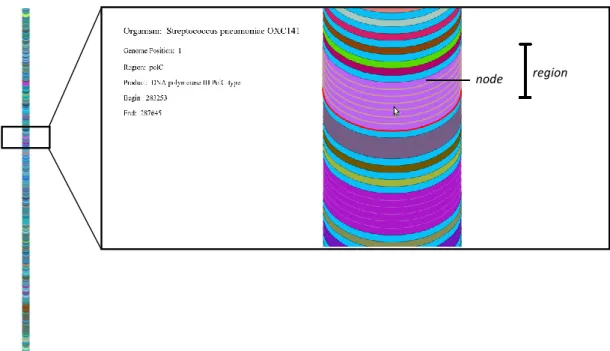
To be able to view several complete prokaryotic genomes in a single image we had to create an abstract representation of the genomic sequences and their annotations to reduce the complexity of the visualization (Figure 3.2). To do this we created two levels of abstraction.
26
First we used an approach where we divided all genomic sequences into regions according to their annotations. These annotations can be coding sites (CDS) and non-coding sequences that generate products such as tRNA and snRNA. Since not all regions of a genome are associated with an annotation, non-annotated regions are classified as undefined.
The second abstraction level was the division of all regions into intervals of 500 nucleotides, which we define as nodes. A node is thus the minimal size representation for a
region in this tool. Therefore a region will be represented as many nodes as multiples of 500bp
corresponding to its size. Regions with less than 500bp are still considered a single node. It is important to notice that what we achieve is an approximate representation of the length of the genome data and not a real one. Nodes are then represented as ellipses in all visual representations that are created.
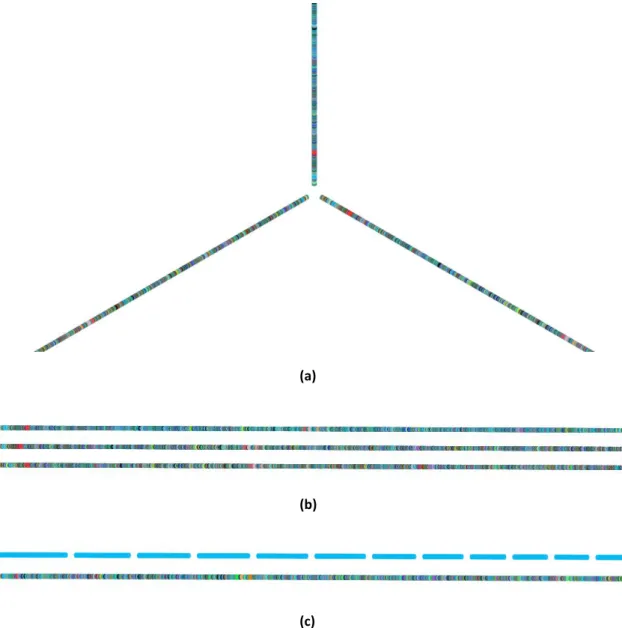
We used the D3 JavaScript library as framework to develop the two ways to visualize genomic data. D3 allows to create powerful visualization components based on data and here it was used to transform all genomic data into an interactive representation.
In this tool, the representations of the genomic data and relationships between them are based on graphs. A graph is a representation of a set of objects, usually called vertices (singular
vertex), where the relationships that exist between them are established by edges or links. In
both visual representations developed each vertex has information about a single node.
The main visual representation in ProGenViZ is based on Hive Plots[95](Figure 3.3-a). Hive Plots are characterized by displaying vertices in a linear layout and by clustering different
(a) (b)
Figure 3.1: The two distinct menus of the application. (a) Actions menu. (b) Right-click menu that is
27
vertices along a radial axis according to some property of the data[95]. We used the implementation in D3.js of Hive Plots by Mike Bostock’s[96] as template for developing this visual representation.
To represent the different genomes in the Hive Plot we grouped the different nodes according to the file to which they belong. Depending on the number of files, the radial axis is divided into equal parts and the different linear layouts with all nodes belonging to a given uploaded file are disposed counter-clockwise. Near the centre of the display, we have nodes corresponding to the initial regions of the genome.
On the second visualization mode, the Linear representation (Figure 3.3-b), all nodes from different files are shown in a linear layout with a pre-set distance between them. Nodes are disposed from left to right and files added later are placed below the ones already displayed forming a stack.
On both visual representations, if a file is classified as having multi-FASTA sequences, all sequences are displayed in the same linear layout but separated from each other (Figure 3.2-c) in the same order provided in the file.
The interaction by the user with the visual representation is made through zoom and padding operations, and also by mouse-over interaction with the different regions. When the mouse pointer hovers a particular region, information about it pops-up in the upper left side of
node region
Figure 3.2: Representation of a part of the Streptococcus pneumoniae OXC141 genome and definition of
node and region. Different colours represent different products. In the case indicated in the image, the region corresponding to PolC gene consists of seven nodes, which means that the gene has a length
between 3500-3999 base pairs. Mouse-over the region shows the information displayed on the left side of the visual representation.