A Work Project, presented as part of the requirements for the Award of a Master Degree in Management from the NOVA - School of Business Economics.
PERCEPTION OF ECO-FRIENDLY PRODUCTS THROUGH THE PACKAGING DESIGN – THE IMPACT OF COLOR AND MATERIAL
Jéssica Pascoal Batista, 3388
A Project carried out on the Master in Management Program, under the supervision of: Luis F. Martinez
Abstract
Consumers’ concerns with the environment lifted sustainability to become a higher priority in their shopping habits. Companies try to respond to this green demand, but their communication is failing, and consumers cannot effortlessly differentiate a green from a nongreen product on the shelf. An extensive literature on green marketing and green products has been conducted over the last years, yet there is relatively little research on the role of packaging as an influencer of environmental perceptions. The purpose of this research is to demonstrate how visual stimulus of a package can enhance consumers’ perception of eco-friendliness. Hence, we have conducted an experimental research to analyze packaging elements such as the material and color (study 1) and presence of an environmental claim (study 2). Through four online questionnaires, with a total of 456 participants, we demonstrate two main conclusions: first, how the material of a package can influence the perception of an eco-friendly product and the importance of the combination with an environmental claim, and second, by presenting two different types of the color green (light and dark) to the participants, if its contrast has an impact on being perceived as eco-friendly.
Keywords: Green products, Eco-friendly packaging, Green color, Environmental claims,
Purchase intention.
Acknowledgements
I would like to thank professor Luis Martinez for the excellent research assistance and guidance throughout the whole thesis. Further, my parents’ financial and emotional support were essential throughout my studies. Also, my sincere thank all my friends for their fantastic help sharing the questionnaires among their friends, Inês Araújo for her guidance on the statistical component and Cátia Pereira for her Photoshop skills. Last but not the least, my thanks and appreciation to my boyfriend, Hendrik Bartels, for the fantastic motivational words since the very beginning and valuable support on reviewing writing matters.
Table of Contents
1. Introduction……….3
2. Literature Review………...…….4
2.1. Environmental Issues and the Green Trend……….4
2.2. Shaping perceptions with the color………6
2.3. Communicating with the Package Material………7
3. Study 1………...8
3.1. Procedure ………..8
3.2. Measures………11
3.3. Sample………11
3.4. Results and Discussion………11
4. Study 2………...13
4.1. Procedure………...13
4.2. Measures………15
4.3. Sample………15
4.4. Results and Discussion………16
5. General Discussion……….17
5.1. Managerial Implications………17
5.2. Theoretical Contributions………..18
5.3. Limitations and Future Research……….19
6. Conclusion………...20
7. References………...21
8. Appendixes………..25
1.
Introduction
“The most important thing is to forecast where customers are moving, and be in front of them.” - Philip Kotler
Consumption of goods and services has increased enormously over the last decade, which caused a decrease of natural resources and aggravated the environmental conditions worldwide (Chen and Chai, 2010). As a result, consumers have been trying to adopt sustainable habits by changing their purchases toward environmental products (Bockman et al. 2009; Schmeltz, 2012). Nonetheless, the adoption rate of green products has been falling (Clifford and Martin, 2011).
Extant research has focused on profiling the typical green consumer (Schlegelmilch et al. 1996; Shrum et al. 1995) and understanding the willingness and motivation behind acquiring green products (Griskevicius et al. 2010; Doorn and Verhoef 2011). However, the understanding of the package environmental cues and its consumers’ perception is still limited (Rokka and Uusitalo, 2008), although the role of the package in consumer’s selection of eco-friendly products is critical to communicate an environmental message through its visual elements (Rundh, 2005).
Our study extends the existing research on green color, as an enhancer of the environmental perception, by combining two saturation levels of the green color (light and dark) with the packaging material, such as plastic and paper, and the existence of an environmental claim. By that, it narrows the observed gap in the literature in which the effect of the packaging’s visual elements on consumer’s perception of a product’s sustainability impact is not sufficiently observed compared to other consumer’s perceptions, such as nutrition labels, package volume or product taste (Huang and Lu, 2016; Krishna, 2007; Dong and Qian, 2013).
The remainder of this report includes a literature review, followed by two studies which include an explanation of the methodology, the analysis of the results and final discussion. Then, we present managerial and theoretical implications. Lastly, limitations and suggestions for future research are reported.
2.
Literature Review
The beginning of the twenty-first century was notable by consumers growing environmental consciousness and awareness of the consumption’s negative impact in several environmental problems worldwide (Leonidou et al., 2010; Svensson and Wagner, 2012). Therefore, consumers are modifying their purchase and consumption behavior to reduce their environmental impact. As a result, the demand for green products has increased exponentially in the market. Nevertheless, it is a challenge for brands to provide a clear communication of green products, and consumers are unable to quickly differentiate between green and non-green products (Lu et al. 2013).
2.1. Environmental Issues and the Green Trend
An enormously increase of goods and services consumption over the last decade caused severe damage in the environment such as global warming, an increase of pollution, and a decrease of natural sources, worldwide (Chen and Chai, 2010). In most countries, household consumption of products accounts for more than 60% of all environmental impacts of consumption (UNEP 2010).
With pollution levels growing every year, environmental concern has rapidly become a central topic for companies that are increasingly using green opportunities (Molina-Azorín et al., 2009; Haden et al., 2009). Also, awareness of the environmental issues has increased consumers’ willingness to save the environment from further deterioration throughout their
Consumers became more interested in products that cause less pollution, use fewer natural resources, and are less harmful to the overall environment (Luchs et al. 2010; Mackoy et al. 1995). Research from Chen (2010), demonstrate that consumers are not only eager to purchase green products that are not harmful to the environment but also to pay more for those products.
Environmentally friendly products are characterized as products that minimize the environmental impact of their consumption (Janssen and Jager, 2002). Ottman et al. (2006), adds to the definition that green products are those protecting or enhancing the natural environment with the conservation of energy and resources and by reducing or eliminating the use of toxic agents, pollution, and waste.
Therefore, companies are using this green trend to introduce more sustainable products in the market and build a competitive advantage (Magnier and Schoormans, 2015). Still, the number of successful environmentally friendly products is not satisfactory (Gleim et al. 2013). Companies are not considering all the visual elementsof a package to communicate their environmental messages yet. Furthermore, research on the behavioral pattern of consumers demonstrates that the green consumer is a confused consumer (Davis, 1993; Crane, 2000) due to low awareness and knowledge of green products.
Current research on the effect of packaging’s visual elements shaping consumers perceptions about product eco-friendliness only focus on the color and suggests that a green packaging enhances product’s environmental perception (Seo and Scammon,2017). However, a package also includes other visual elements, such as saturation of the color, type of material and existence of the environmental claim, which can shape product’s environmental perception, and enhance purchase intention. Thus, we propose the following research question:
RQ. Which packaging’s visual elements increase consumers’ eco-friendly perception of environmental products?
2.2. Shaping Perceptions with the Color
Color is an integral element of marketing communications (Schmitt and Pan, 1994), a marketing tool able to attract consumers and shape their perceptions. Labrecque (2015), suggests that a brand can establish an effective visual identity and position itself among competitors through the color. One of the critical functions of color is to provide meaning which makes daily lives easier and allows consumers to identify products quicker. A study suggests that 60% of the first impressions of products comes from color (Romaniuk and Nenycz-Thiel, 2014).
Color is a topic with extensive research in the academic literature yet, color in the context of green products is still an underexplored aspect of marketing. Color hue was studied in a recent research conducted by Seo and Scammon (2017), in which the authors demonstrate the positive effect of the color green of a packaging on consumers’ environmental perception of the brand. Nonetheless, the other two dimensions of color, saturation, and value (Labrecque et al. 2013) have not been considered yet in this context.
Different color saturation (i.e., intensity) in the background of a package produces different meanings on the healthiness of a product (Dong, 2013). For instance, if the background of a package is displayed in a vivid and high saturated color, consumers perceive the product to be unhealthy, and on the other hand, a less saturated color gives the perception of healthiness to a product (Mead and Richerson, 2017). Following this finding and combining it with the result Seo and Scammon (2017), we propose to study the influence of the saturation of the color green in the context of environmental products and perceptions. Thus, the following hypothesis is presented:
H1. A product with a dark green packaging will be considered environmentally different from a packaging a light green packaging, both combined with an environmental claim.
2.3. Communicating with the Package Material
Packaging plays an important role in marketing (Rundh, 2005). Its primary role is to generate consumer attention and create differentiation on the shelf. Consumers often make the first judgments about brands and products based on their packages (Orth and Malkewitz, 2008). Additionally, the packaging is also a communication vehicle growing significantly, and thus traditional brand building mass media is decreasing (Belch and Belch, 2001).
Since the 90’s, the environmentally friendly packaging is increasingly being demanded in the market. Consumers want a reduction on the packaging and the use of materials that can be recycled or reused like paper (Faccio et al. 2015). The material of a package communicates different meanings to consumers depending on their materials’ perception. On the one hand, the paper is perceived as more impactful due to its process of production, but on the other hand, plastic creates many concerns on consumers due to its recyclability (Klaiman et al., 2016). Following the research of Seo and Scammon (2017), which conclude that a package using a green background and combined with an environmental claim is perceived by consumers as eco-friendlier than in other colors, we add one more variable, which is the material (plastic vs. paper), to understand how consumers perception of product’s environmental friendliness. This way, is likable that consumers will perceive a product with a package made of paper rather than plastic to be eco-friendlier, and thus the following hypothesis is proposed:
H2. A product using a green packaging combined with an environmental claim will be perceived as environmentally superior when its package is made of paper rather than plastic.
Marketers noticed the importance of environmental labels as a marketing tool to attract green consumers (D’Souza et al. 2006). Consumers are more likely to choose a product with an environmental claim than without (Giannelloni, 1998). As consumers take into consideration the information displayed in the claims, the material needs to be in line with these claims (Jerzyk, 2016), otherwise the brand trust can be damaged (Darke et al., 2009). Therefore, as for the color green that needs to be complemented with an environmental claim, it is expected that the same should happen to the paper material, and thus the following hypothesis is proposed:
H3. A paper package will produce more positive perceptions of the brand’s environmental impact only when combined with an environmental claim.
3. Study 1
The current study aims at identifying which elements of the package will make the perception of a product environmentally superior. Following the recent findings of Seo and Scammon (2017), green color as a facilitator of the environmental claim and thus superior environmental perception of the product, we will extend this research through green color saturation and package material combined with an environmental claim to understand the impact on consumers’ environmental perception and purchase intention.
3.1. Procedure
In this research, we have followed a quantitative approach, more specifically an experimental design. In other words, 2 (dark vs. light green) x 2 (paper vs. plastic package) between-subjects design is applied to examine the possible interaction effect. Therefore, two questionnaires were designed in the platform Qualtrics and applied online through Facebook. Participants were randomly assigned to only one of the questionnaires.
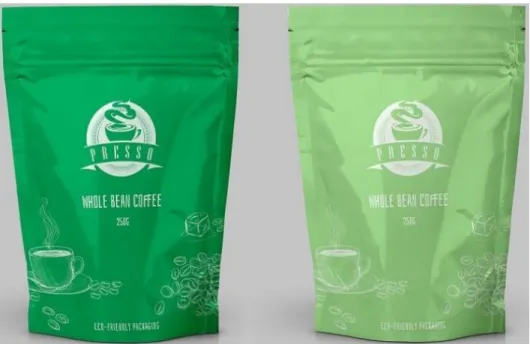
For the purpose of this study, four designs of coffee’s packages were created from scratch using photoshop to avoid biases in responses. In questionnaire A we have used two packages of coffee made of plastic (figure 1), one in dark green and another in light green, and in questionnaire B we have displayed two packages of coffee made of paper (figure 2), one in dark green and another in light green. All packages of coffee had the same brand name in the center, and a claim “Eco-Friendly Packaging” displayed in the bottom.
Figure 1 - Coffee Package made of paper in dark green (left side) and light green (right side).
Before starting collecting data, a pilot test was conducted with eight persons (four for each questionnaire) with different gender, age, nationality and academic background. The purpose of the test was to identify unclear wording and format of questions and access how long it takes participants to complete the questionnaire. Consequently, some mistakes were identified and corrected for better comprehension of the questions.
Both questionnaires had the same questions, yet with different pictures of a package of coffee. The first part of the questionnaire has a package of coffee with dark green background and the second part show the same picture but with a light green background. The questionnaires started with a short introduction about the aim of the research explaining that the goal was to analyze people’s purchase and consumption of coffee.
In the first section, participants started the questionnaire by answering a question regarding their frequency of consumption of coffee’s packages to support our cover story (Koo and Suk 2016). In the second section, a dark green package of coffee in plastic (or paper) was displayed, and participants answered three questions which were related to the environmental friendly perception and environmental impact of the products (Seo and Scammon. 2017), and their likelihood of purchasing the package shown (Dong, 2013). In the third section, we exhibited a light green package of coffee in plastic (or paper) and repeated the same questions. In the following section, both products were displayed, and participants had to choose which they were more likely to buy and perceived as eco-friendlier.
Finally, participants indicated whether they were colorblind or not and answered demographic questions regarding age, gender, nationality, and level of education. All participants were informed in the beginning that the study was on a voluntary basis, and that information provided would be kept confidential.
3.2. Measures
Multi-item reflective measures were implemented by adopting scales previously validated in other studies on consumer behavior concerning packaging and colors. The data collection intended to determine whether the hypotheses should be accepted or rejected. To evaluate the influence of the saturation of the color green and the material of the package on consumers’ perception of eco-friendly products, participants rated how environmentally friendly they perceived the product to be, on a 7-point items scale (1 = very unfriendly, 7 = very friendly) and how they perceived the product in terms of its environmental impact (1 = very negative, 7 = very positive), as applied in a very recent research conducted by Seo and Scammon (2017).
3.3. Sample
In total, 341 persons participated in the questionnaires. However, 27 were considered invalid because of color blindness. Thus, our sample has a total of 314 persons, more precisely 141 people in questionnaire A (paper package), and 173 people in questionnaire B (plastic packaging). The size of the sample enables us to ensure reliability and be representative of the population.
The distribution of the questionnaires had no limitations as we aimed for a diverse sample of the population. Therefore, our sample ages from 18 - 44 years old, from which more than 50% belonged to the group 25-34 years old. Within the participants, 59,4% were female, and 40,6% were male, and Portugueses and Germans are leading regarding nationality (appendix 1).
3.4. Results and Discussion
The collected data was analyzed through a quantitative approach, using the software SPSS 23. The assumption of normality was not validated for the dependent variables, using the Kolmogorov Smirnov test (n > 50) for all groups. Thus, there is not a Normal distribution
for the entire population, since all groups have a p-value of less than .05 (α of reference). However, the violation of the assumption of normality about parametric results has been studied continuously (Maroco, 2010). As the homogeneity of variances is validated, the parametric test chosen is the ANOVA Two-Way that allows comparing more than two populations defined by two independent factors (Maroco, 2010).
Our data omitted those who reported being colorblind (n = 314). The dependent variables were purchase intention (PI) and environmentally friendly (EF), the independent variables are the saturation of the green color (light green and dark green) and the packaging material (paper and plastic). The data was analyzed with a 2 (dark green vs. light green) × 2 (paper package vs. plastic package) between-subjects ANOVA.
Regarding the perception of the dark green and light green package, the statistical test revealed that, the package coloured with dark green (M = 4.710; SD = 1.415) is not significantly different, nor in the EF nor PI, in comparison with the package coloured with light green (M = 4.490; SD = 1.587). There was not a significant difference in both, dark and light green paper and dark and light green plastic package, for both variables (EF (F (1,1) = 1.270; p = .250) and PI (F (1,1) = .540; p = .450)).
In terms of package material, there was a significant two-way interaction between material and environmentally perception (EFP (F (1,1) = 34.360; p < .001) and PI (F (1,1) = 6.050; p = .010)). The statistical test revealed that the package made of paper is perceived as being more environmentally friendly (M = 5.120; SD = 1.239) than the package made of plastic (M = 4.170; SD = 1.570). Thereby, consumers are more willing to purchase the package made of paper (M = 3.080; SD = .944) than the package made of plastic (M = 2.820; SD = .938).
produces the higher environmental perception of a product than a plastic packaging when combined with an environmental claim, and thus our hypothesis has been confirmed.
4. Study 2
Following study 1, in which the package made of paper is perceived by consumers as environmental friendlness, we purpose to analyse in a second study the level of eco-friendliness perception of the paper. Thus, study 2 aims to analyze whether the positive impact of the paper material observed in study 1 was driven by the paper material alone or the combination with the environmental claim “Eco-Friendly Packaging”.
Thereby, if the paper material alone is enough to create more favorable environmental perceptions, then the positive impact of paper material should be observed even without the presence of an environmental claim. However, the paper packaging alone may not be enough to create favorable environmental perceptions of a product as the paper packaging may have a positive impact on environmental perceptions only when it is paired with an environmental claim. If the positive impact of the paper material is driven by the combination of the paper package with an environmental claim, then more positive environmental perceptions should be observed only on the paper package with an environmental claim.
4.1. Procedure
An experimental design was also selected for this study, and the data was analyzed with a linear regression to understand the impact of the existence or absence of a claim in the paper package. Again, two questionnaires were developed using the platform Qualtrics and distributed online through Facebook. Participants were randomly assigned to only one of the questionnaires.
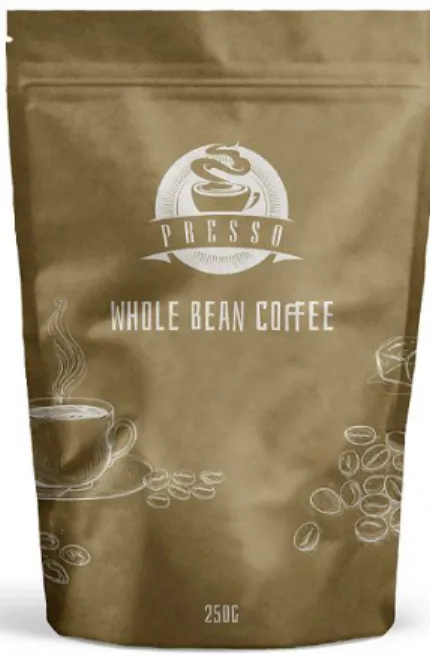
Using Photoshop one more time, we have manipulated the previous paper packages and change the color to brown, the natural color of the paper, to give a better perception of
the material. Thus, in one package we have kept the claim “Eco-Friendly Packaging” under the brand name (figure 1), and in the other package we have removed it (figure 2).
Figure 1 – Paper package with claim Figure 2 – Paper package without claim
Similar to the previous study, the only difference between these two questionnaires were the pictures: one questionnaire used figure 1 and the other questionnaire used figure 2. A test was conducted with four persons with different gender, age, nationality and academic background before starting collection date. Opposite to the last time, no unclear questions or mistakes were detected.
The start of the questionnaires is equal to the previous ones. First, an introduction hides the real aim of the research to avoid biases with a question regarding the frequency of coffee purchase to support the cover story (Koo and Suk, 2016). Next, a picture of the paper package of coffee in its natural color (brown) was displayed with (or without) the claim “Eco-Friendly Packaging”, and four questions followed it. The first two questions were about environmental friendliness perception (Seo and Scammon, 2017), then the participants likelihood to purchase the product (Dong, 2013) and, lastly, their overall feeling about the
questions regarding age, gender, nationality, and level of education. All participants were informed in the beginning that the study was run in a voluntary basis, and that information provided would be kept confidential.
4.2. Measures
As an extension of the first study, we have used the same approach and measures. To analyse the influence of the claim in the paper packaging on consumers’ perception of eco-friendliness, participants rated how environmentally friendly they perceived the product to be, on a 7-point items scale (1 = very unfriendly, 7 = very friendly) and how they perceived the product in terms of its environmental impact (1 = very negative, 7 = very positive), as applied in a very recent research conducted by Seo et al. (2017). To measure the purchase intention, we used a 5-point scale ranging from 1 = ‘‘definitely will buy’’ to 5 = ‘‘definitely will not buy’’ which was previously used by Mullet et al. (1985). In addition to the previous study, these questionnaires had a question regarding the overall feeling about the brand, measured with a bipolar scale of five-items: unappealing/appealing, bad/good, unpleasant/pleasant, unfavorable/favorable and unlikable/likable (Spears and Singh, 2004).
4.3. Sample
The number of participants in both questionnaires was 115 persons, the first questionnaire (with the claim) obtained 54 answers and the second (without the claim) obtained 61 answers. The size of our sample allowed us to assure reliability of the results.
The questionnaire was distributed to every person who had interest in participating in our research. Within the participants, female gender dominated one more time representing 68,7% of the total participants, while male represented 31.3%. The age ranged between 18 - 44 years old, from which more than 50% belonged to the age group 25-34 years old. Within the participants, Portuguese and German nationality represented more than 80% of the total participants, with the first on the top of the list (appendix 1).
4.4. Results and Discussion
Following a similar approach to the previous study, the data was also analyzed with the support of the software SPSS 23. The dependent variables are Environmental Friendly (EF), and Purchase Intention (PI) and the independent variables are “with the claim” and “without the claim”. Using the Kolmogorov Smirnov test (n > 50), the assumption of normality was not validated for the dependent variables, and thus there is no Normal distribution for the entire population since all groups have a p-value of less than .05 (α of reference). However, the violation of the assumption of normality about parametric results has been studied continuously (Maroco, 2010).
In order to find out if there is a relation between the dependent variables, we used the non-parametric Mann-Whitney test. Comparing two populations from which independent samples were taken against the EF dimension (Maroco, 2010). There are statistically significant differences between the groups for the variable EF (p = .004), but there are no statistically significant differences for the variable PI (p = .886).
Furthermore, a simple linear regression was performed for the feeling towards the brand through which the regression model was statistically significant (F (1; 52) = 19,978; p <0.001). Through the analysis of the standardized regression coefficients (EF), we conclude that participants have a positive and higher feeling of the brand towards the package with an environmental claim (β = .527) than the package without an environmental claim (β = .332)
Finally, the statistical test revealed that the paper package with the claim (M = 67.21) is perceived as being more environmentally friendly than the paper package without claim (M = 57.61). Consistent with H2, the positive effect of the paper material was observed only when the paper package also included an environmental claim, and thus our hypothesis has been confirmed.
5. General Discussion
The purpose of this research was to examine the relationship between packaging elements and consumers’ perception of environmentally friendly products and enrich the literature on green products by demonstrating which and how packaging elements enhance the perception of environmental friendliness on products, as well as purchase intention.
Green products’ consumers are confused and are not able to distinguish a green product easily from a nongreen product. Our findings show that a green paper package, rather than a green plastic package, will facilitate consumers to form their environmental perceptions. In addition, the paper packaging enhances consumers’ environmental perception of the product only when combined with an environmental claim. Furthermore, the more environmentally friendly is the product perceived, the better is the purchase intention. Also, the positive feeling towards a brand has a positive impact on the purchase intention and environmental friendly perception of a product.
The following table summarizes the hypotheses of this study.
Table 1 - Summary of Hypotheses
Hypotheses Results Decision
A product with a dark green packaging will be considered environmentally different from a packaging a light green packaging, both combined with an environmental claim.
EF (p = 0.25) PI (p = 0.45)
Not Confirmed
H2. A product with a green packaging combined with an environmental claim will be perceived as environmentally superior when its package is made of paper rather than plastic.
EF (p < 0.001)
PI (p = 0.01) Confirmed
H3. A paper package will produce more positive perceptions of the brand’s environmental impact only when combined with an environmental claim.
EF (p = 0.004)
Confirmed
5.1. Theoretical Contributions
This study builds on recent research about green color and its impact to enhance the degree of fluency to read the packaging environmental information of a product (Seo and
Scammon 2017). Building on this research, our study makes the following theoretical contributions.
We demonstrate that other packaging elements such as the material also has an impact on the ease of processing the information (perceptual fluency theory). A paper packaging will facilitate the consumer to read environmental information of a package due to paper’s association with nature. In addition, we also show that the effect of the paper material is only relevant when combined with an environmental claim on the packaging, in other words.
Furthermore, based on the finding that the color green together with an environmental claim enhances the perception of an environmental product (Seo and Scammon 2017) and the research color saturation that demonstrates differences between higher and lower saturation on color, we demonstrate there is no difference between high and low saturation of the color green in consumers’ environmental perception of a product.
5.2. Managerial Implications
Companies are trying to follow the green trend and increasingly focusing on either making one of their current brands eco-friendlier or developing a new brand to cover this opportunity in the market. However, companies are not communicating their green products in the right way, and consumers cannot effortlessly distinguish a green product from a nongreen product. Besides, companies invest a significant part of their budget in packaging and label since it has been proven to be one of the most effective tools to attract consumers’ attention on the shelf. Research has shown that different packages communicate different meanings to consumers, through visual package elements, such as material, shape, size, color, and imagery.
Our findings can be the foundation to green brands which are struggling to communicate with their target, and thus support brand managers to reposition the brand.
have a higher positive impact on consumers’ environmental perceptions, and consequently in their purchase intention. Moreover, it is essential to combine it with an environmental claim, otherwise the product will not be perceived as eco-friendly. However, the perception of packaging materials may differ among the category of products and consumers’ level of knowledge about green products, and thus brand managers must consider this. In conclusion, a brand needs to consider color, material, and claim to communicate their identity and create a positive feeling to the consumer.
5.3. Limitations and Future Research
The present research has some limitations that must be considered in future research. The first limitation is the time which may have restricted the robustness of this project, for instance, the absence of a color blindness test. Furthermore, the limited number of pages may have driven to the omission of additional valuable content to this study.
This study was developed through an online survey and the scales used to analyze the constructs, although they have an adequate validity and reliability, may not be the most appropriate. In future investigations, and with a longer time horizon, other scales should be tested. Also, the development of real situations may be of great added value for the literature (Tsai and Lee, 2007). Hence, future research should create real in-store scenarios with a limited time to look at the product according to the real time spent in front of the shelf to have more accurate results.
Another limitation of this study is the package design, which has many elements that can shape perceptions, and thus may have created biases and misperceptions. Also, many claims can be applied to an eco-friendly product with different levels of impact on consumers’ perception. Hence, future research should not only explore elements of the package, such as logo, shape, imaginary and size but also repeat the use of color and material with other combinations of environmental claims to validate the results of this research.
Regarding the saturation of the color green, two limitations should be taken into account for future research. Firstly, the gap between the light and dark green color may not have been strong enough, and secondly, the participants should have been assigned to different color conditions so that the results would have less contamination by extraneous factors.
Lastly, our study was limited to one product category (coffee), and thus future research should address another category of products, for instance, products from which consumers require a high (e.g., laundry products) or less performance (e.g., toilet paper). In conclusion, it is clear the need for more research in the future to confirm the veracity and consistency of the presented results.
6. Conclusion
The packaging design shapes consumers’ perceptions about the product and, consequently, influences their purchase decision. The literature exhibits numerous studies that analyze the impact of the visual elements of a packaging on consumers’ perception, such as on the nutrition labels, quality, or taste, yet research in the context of friendless environmental products is still insufficient. Thereby, the study examined how key packaging elements, such as color, material, and claim, influence consumers’ eco-friendly perception of a green product and their purchase intention. Hence, although the present research has some limitations, it is a significant contribution to the marketing literature on packaging’s design elements and green products. Furthermore, our conclusions may be taken into consideration by brand managers to help them designing their green product packages and ensure clear communication.
7. References
Bech-Larsen, T. (1996). Danish consumers' attitudes to the functional and environmental characteristics of food packaging. Journal of Consumer Policy, 19, 325-339.
Bockman, S., Razzouk, Y., & Sirotnik, B. (2009). Going green – from left to center stage: An empirical perspective. Journal of the American Academy of Business, 14 (2), 8–17. Chen, Y. S. (2010). The drivers of green brand equity: green brand image, green satisfaction,
and green trust. Journal of Business Ethics, 93 (2), 307-319.
Chen, T. B., & Chai, L. T. (2010). Attitude towards the environment and green products: Consumers’ perspective. Management science and engineering, 4 (2), 27- 39. Crane, M., & Newman, M. C. (2000). What level of effect is a no observed effect?
Environmental Toxicology and Chemistry, 19, 516–519.
Clarke, T., & Costall, A. (2008). The emotional connotations of color: A qualitative investigation. Color Research and Application, 33, 406–410.
Darke, P. R., Ashworth, L., & Main, K. J. (2009). Great expectations and broken promises: Misleading claims, product failure, expectancy disconfirmation and consumer distrust. Journal of the Academy of Marketing Science, 38 (3), 347–362.
Davis J. J., (1993). Strategies for environmental advertising. Journal of Consumer Marketing, 10 (2), 19-36.
D'Souza, C., Taghian, M., & Lamb, P. (2006). An empirical study on the influence of environmental labels on consumers. Corporate Communications: An International Journal, 11 (2), 162-173.
Dong, P. (2013). The effect of package color on food calorie judgment. AMA Winter Educators' Conference Proceedings, 24, 438–439.
Doorn, V. J., & Verhoef, P. C. (2011). Willingness to pay for organic products: Differences between virtue and vice foods. International Journal of Research in Marketing, 28 (3), 167-180.
Giannelloni J.L. (1998). Behaviors related to the protection of the environment and their Determinants: A Review of Marketing Research. Research and Application in Marketing, 13 (2), 49-72.
Gleim, M. R., Smith, J. S., Andrews, D., & Cronin Jr, J. J. (2013). Against the green: A multi-method examination of the barriers to green consumption. Journal of Retailing, 89 (1), 44-61.
reputation, and conspicuous conservation. Journal of Personality and Social Psychology, 98, 343-355.
Haden, S. P., Oyler, J. D., & Humphreys, J. H. (2009). Historical, practical and theoretical perspective on green management: An exploratory analysis. Management Decision, 47, 1041-1055.
Hoegg, J., & Alba, J. W. (2007). Taste perception: More than meets the tongue. Journal of Consumer Research, 33, 490-498.
Huang, L & Lu, J. (2016). The Impact of Package Color and the Nutrition Content Labels on the Perception of Food Healthiness and Purchase Intention. Journal of Food Products Marketing, 22 (2), 191-218.
Janssen, M. A., & Jager, W. (2002). Stimulating diffusion of green products - Co-evolution between firms and consumers. Journal of Evolutionary Economics, 12 (3), 283-306. Jerzyk, E. (2016). Design and Communication of Ecological Content on Sustainable
Packaging. Journal of Food Products Marketing, 22 (6), 707–716.
Klaiman, K., Ortega, D. L., & Garnache, C. (2016). Consumer preferences and demand for packaging material and recyclability.Resources, Conservation and Recycling,115,1–8. Koo, J., & Suk, K. (2016). The effect of package shape on calorie estimation. International
Journal of Research in Marketing, 33 (4), 856-867.
Kotler, P. T. & Keller, K. L. (2012). Marketing Management (14th ed.). New Jersey: Pearson
Education.
Labrecque, L. (2012). Competent Blue and Sophisticated Purple: Examining the Relationship Between Color and Brand Personality. Journal of the Academy of Marketing Science, 40, 711–727.
Labrecque, L.I., Patrick, V.M. & Milne, G.R. (2013). The Marketers’ Prismatic Palette: A Review of Color Research and Future Directions. Psychology & Marketing, 30, 187-202.
Leonidou, L. C., Katsikeas, C. S. & Coudounaris, D. N. (2010). Five decades of business research into exporting: a bibliographic analysis. Journal of International Management, 16 (1), 78-91.
Lin, Y., & Chang, C. A. (2012). Double Standard: The Role of Environmental Consciousness in Green Product Usage. Journal of Marketing, 76 (5), 125-134.
Liability: Potential Negative Effects of Ethicality on Product Preference. Journal of Marketing, 74 (5), 18-31.
Magnier, L. & Schoormans, J. (2015). Consumer reactions to sustainable packaging: The interplay of visual appearance, verbal claim and environmental concern. Journal of Environmental Psychology, 44, 53-62.
Marôco, J. (2010). Statistical Analysis with PASW statistics (ex-SPSS). 5ª ed. Pero Pinheiro: Report Number.
Marôco, J., & Bispo, R. (2005). Statistics applied to Social and Human Science. 2ª ed. Lisbon: Climepsi Editores.
Mead, J. A. & Richerson, R. (2007). Package color saturation and food healthfulness perceptions. Journal of Business Research, 82, 10-18.
Molina-Azorín, J. F., Claver-Cortés, E. , López-Gamero, M. D., & Tarí. J. J., (2009). Green management and financial performance: A literature review. Management Decision, 47 (7), 1080-1100.
Nenycz-Thiel M., & Romaniuk J. (2014). The real difference between consumers'
perceptions of private labels and national brands. Journal of Consumer Behavior, 13, 262–269.
Ottman, J. A., Stafford, E. R., & Hartman, C. L. (2006), Avoiding green marketing myopia: ways to improve consumer appeal for environmentally preferable products. Environment, 48, 22-36.
Polonsky, M. J., Bailey, J., Baker, H. et al. (1998). Communicating Environmental
Information: Are Marketing Claims on Packaging Misleading? Journal of Business Ethics, 17, 273-281.
Rokka, J., & Uusitalo, L. (2008). Preference for green packaging in consumer product choices – Do consumers care? International Journal of Consumer Studies, 32, 516– 525.
Rundh, B. (2005). The multi‐faceted dimension of packaging: Marketing logistic or marketing tool? British Food Journal, 107 (9), 670-684.
Schmitt, B. H., Pan Y., & Tavassoli N. T. (1994). Language and Consumer Memory: The Impact of Linguistic Differences between Chinese and English. Journal of Consumer Research, 21 (3), 419–431.
Schlegelmilch, B.B., Bohlen, G.M., & Diamantopoulos, A. (1996). The link between green purchasing decisions and measures of environmental consciousness. European
Schmeltz L. (2012). Consumer-oriented CSR communication: focusing on ability or morality? Corporate Communications: An International Journal, 17 (1), 29-49. Seo, J. Y., & Scammon, L. D. (2017). Do green packages lead to misperceptions? The
influence of package colors on consumers' perceptions of brands environmental claims. Marketing Letters, 28, 357-369.
Shrum, L. J., McCarty, J. A., & Lowrey, T. M. (1995). Buyer characteristics of the green consumer and their implications for advertising. Journal of Advertising, 24(2), 71–82. Spears, N. & Singh, S. (2004). Measuring Attitude Toward the Brand and Purchase
Intentions. Journal of Current Issues and Research in Advertising, 26, 53-66.
Svensson, G., & Wagner, B. (2012). Business sustainability and E‐footprints on Earth's life and ecosystems: generic models. European Business Review, 24 (6), 543-552. Tsai, D., & Lee. H. (2007). Will you care when you pay more? The negative side of targeted
8. Appendix 8.1. Appendix 1 – Demographicas 8.1.1. Study 1 8.1.2. Study 2 40.6 % 59.4 % Graphic 1 - Gender Male Female 43.5 % 51.8 % 4.8% Graphic 2 - Age 18 - 24 25 - 34 35 - 44 59.4 % 14.4 % 3.5% 1.6% 21.0% Graphic 3 - Nationality Portuguese German French Italian Other 31.3 % 68.7 % Graphic 1 - Gender Male Female 33.9 % 61.7 % 4.3% Graphic 2 - Age 18 - 24 25 - 34 35 - 44 67.0 % 18.3 % 1.7% 0.9% 12.0% Graphic 3 - Nationality Portuguese German French Italian Other