Abstract—There is already significant research targeting B3G systems. The vision for this new generation includes provision of a broadband component for which various implementation technologies are being considered, one of them being MC-CDMA. The 4MORE project focuses at the system concept on techniques believed to be crucial to reach the broadband capabilities envisioned, namely Multiple Transmit Multiple Receive (MTMR) antennas and cross-layer design (L1 and L2). Specifically, the joint application of dynamic resource allocation with double Alamouti encoding and cross-layer signalling are considered to ensure seamless IP packet transport with broadband capabilities. The simulation results have shown that the 4MORE system can match the anticipated throughputs required for the cellular component of B3G systems.
Index Terms- 4MORE, MC-CDMA, MIMO, Dynamic
Resource Allocation, Alamouti.
I. INTRODUCTION
he European vision for B3G systems incorporates a fully IP-based integrated architecture offering any service, at any time[1]. In order to accommodate future services
requiring high capacity, a broadband component is envisioned with a maximum information bit rate of more than 2-20Mbps in a vehicular environment and possibly 100Mbps in indoor to pedestrian environments, using a 50-100MHz bandwidth. One of the most promising technologies for this broadband component is Multi-Carrier Code Division Multiple Access (MC-CDMA), which allows combining the merits of OFDM (Orthogonal Frequency Division Multiplexing) with spread-spectrum techniques. In Japan [2] there has been in recent years a very strong
emphasis on this technology including the realization of some field trials. At the European level and within the IST (Information Society Technologies) Program, the MATRICE [3] project has undertaken research in order to
define and validate access and transmission concepts based on MC-CDMA technology to address the broadband component of future cellular systems.
In the 4MORE project [4], the intention was to complement
the MATRICE and advance one step towards implementation though the design of a System on Chip (SoC) for a 4G terminal employing multiple antennas and based on MC-CDMA techniques. 4MORE objectives are to research, develop, integrate, and validate a cost effective, low power SoC solution for multi-antenna MC-CDMA mobile terminals based on the joint optimization of L1 (Layer1) and L2 (Layer 2) functions. In this paper, we aim to address the system level aspect of the 4MORE
air-.
interface in an attempt to quantify the broadband capabilities of the system thanks to the MIMO (Multiple Input Multiple Output) signal processing techniques introduced at L1. Furthermore, in order to utilise efficiently the 4MORE L1 spectral efficiency offered, we propose an uplink Dynamic Resource Allocation (DRA) scheme that ensures the seamless transport of variable size IP packets over the air-interface. The DRA constitutes link adaptation, H-ARQ (Hybrid- Automatic Repeat reQuest) type II and scheduling based on maxC/I (maximum Carrier-to-Interference ratio). The combination of these radio resource management entities ensures that variable size IP packets are mapped to a pre-defined set of radio block sizes, and are transported over the air-interface according to the H-ARQ protocol timing sequence. Furthermore, using cross-layer design techniques, we can ensure that each user is scheduled in a manner so as to ensure the highest average over-the-air (OTA) cell throughput.
In this paper, we aim to address the uplink system level performance for the 4MORE broadband air-interface based on the joint application of DRA with the latest technology in MIMO signal processing techniques at L1 using cross-layer signalling. This paper adopts the following structure: section II describes the 4MORE physical layer transmission chain; section III details the link level interface approach required to model the packet transmission quality at the system level; whilst the proposed uplink dynamic resource allocation scheme is given by section IV; simulation results are depicted in section V; and finally the conclusion in section VI.
II. PHYSICALLAYER PLATFORM
A. Physical layer description
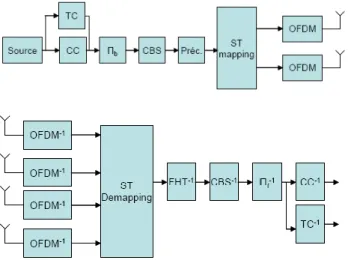
Fig. 1 shows the synoptic view of the V0 (version 0) UL (uplink) 4MORE simulation chain that were used for generating the LUTs (Look-up-tables) for evaluating packet error at the system level. The transmitted bit vector is initially block encoded with the duobinary turbo code (DTC) channel coding with coding rates equal to ½, 2/3 or ¾; then the bits are interleaved and symbol mapping is performed following QPSK, 16QAM or 64QAM modulation.
The MC-CDMA technique allows several users to transmit simultaneously in the same bandwidth by using orthogonal Walsh-Hadamard spreading codes that lead to reduced Multiple Access Interference (MAI) in UL communication. The “Precoding” block is a Fast Hadamard Transform and simulates the SS-MC-MA (Spread Spectrum-Multi-Carrier- Multiple Access) technique. Following the precoding stage, the symbols are subjected to Alamouti space time block
4MORE Uplink System Level Performance
M. Shateri†, V. Monteiro††, J. Rodriguez††, A. Gameiro††, R. Legouable†††, N. Ibrahim††††
Centre for Communication Systems Research, Guildford, GU2 7XH, United Kingdom† Instituto de Telecomunicaçoes, 3810-193 Aveiro, Portugal. Email [email protected]††
RD Rennes, 4 Rue du Clos Courtel BP 91226, 35512 Cesson Sevigne, France††† FT R&D ,38/40 Rue du General Leclerc, 92794 Issy Les Moulineaux, France††††
coding [5], and OFDM modulated onto each transmit antenna. The MIMO channel is modelled according to the 3GPP/3GPP2 standard [6] and adapted for the 4MORE project at 5GHz in the 50MHz bandwidth. To achieve this, we have used an adaptation of the BRAN E channel model at 60 km/h velocity.
After passing through the channel, at the reception, the OFDM demodulation is carried out by a simple and unique Fast Fourier Transform (FFT) applied to the sum of the Nu different users’ signals. The received signal is STBC (Space Time Block Codes) MIMO decoded that consist in Alamouti's combining and equalization by using the frequency channel estimates. The resulting signal is de-spread, de-mapped, de-interleaved and decoded. For the decoding process the symbols at the input of the decoding process are weighted by the reliabilities of the propagation channel corresponding to the Log-Likelihood Ratios (LLR) of the channel. At the end of the simulation chain, we computed the PER (Packet Error Rate) of the transmission by comparing the input bit stream with the decoded bit stream. If, after the channel decoding at least one error occurs within the packet, then it is viewed as an erroneous packet.
Fig. 1 UL 2x4 MIMO MC-CDMA 4MORE synoptic (Tx. and Rx.) B. Frame structure
The main goal of the proposed set of system parameters is to provide flexibility to the frame structure to allow either a 2x2 or a 2x4 (TxxRx) system. The chosen frame represented by Fig. 2 is a 10 ms frame constituting 15 slots of 0.667 ms, as defined for UMTS; although the MAC layer transmission time interval (TTI) is set to 2ms duration. Each slot is dedicated either to uplink or downlink communications. The number of DL slots can be different from the number of UL slots allowing the operator to deal with the asymmetrical traffic requirements of the users. The allocation of UL and DL slots in the frame is determined by the network and can change at each new frame depending on traffic conditions. The base station (BS) regularly informs each MT (mobile terminal) in advance through a control channel about the allocation that has been chosen for the next frames.
Each UL and DL slot is composed of several symbols along the frequency and time dimensions of the OFDM frame. These symbols may be synchronisation or pilot symbols (denoted by P in Fig. 2) or data symbols (denoted by D in Fig. 2). The duration of each symbol includes the duration
of the OFDM symbol itselfi.e. TFFT,plus the duration of the
OFDM guard interval, T∆, which may carry a cyclic prefix.
time frequency P PD D D D D D D D D D D D D D G P PD D D D D D D D D D D D D D G P PD D D D D D D D D D D D D D G … …… … … … … P PD D D D D D D D D D D D D D G P PD D D D D D D D D D D D D D G P PD D D D D D D D D D D D D D G DL UL DL DL DL UL DL DL UL DL UL frame structure slot structure
Fig. 2 Conventional 4MORE frame and slot structures.
The sampling frequency is denoted as fS.
At the end of each slot, a TDD guard time is introduced to avoid interference between UL and DL communications. During this guard time, no information is transmitted thus introducing spectral efficiency losses; mainly when 2 consecutive slots are dedicated to the same transmission link. The duration of this TDD guard time TG is related to
the cell range.
1) Time frame structure
For the uplink 2x4 MIMO MC-CDMA transmission mode: • One OFDM symbol per slot is devoted to
synchronisation (S)
• Full OFDM pilot symbols are inserted in the slot to regularly estimate the channel at the moving terminal (P)
The chosen time structure for the uplink is represented in Fig. 3.
Fig. 3 Timeslot structure for the uplink allowing SFT=4 with 2 hopping
areas.
2) Frequency frame structure
From the number of pilot sub-carriers required for efficient common phase error (CPE) correction, the frequency structure of each OFDM data symbol depicted in Fig. 4 has been obtained. Among the 672 modulated subcarriers, each user transmit over a subchannel composed of 28 adjacent subcarriers. These 28 subcarriers are composed of ND=24
subcarriers for useful data symbol transmission and NP = 4
pilots for CPE used for frequency offset compensation. Between each subchannel is inserted NZ = 1 null subcarrier
for subchannel isolation to avoid intercarrier interference between users. So, the spectrum is subdivided into NB = 24
subchannels allowing up to 24 simultaneous users to transmit.
Frequency OFDM symbol structure (NB=24, ND=24, NP=4, NZ=1)
Fig. 4 Frequency frame structure in uplink.
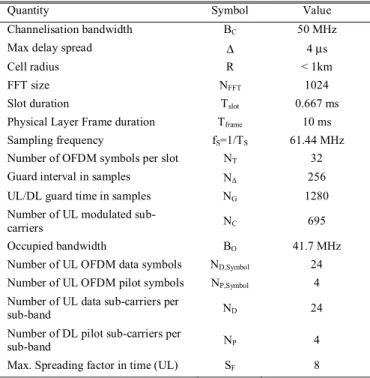
THE COMPLETE SET OF FRAME RELATED PARAMETERS ARE GIVEN BY Table I [7].
TABLE I
SYSTEM PARAMETERS
Quantity Symbol Value
Channelisation bandwidth BC 50 MHz
Max delay spread ∆ 4 µs
Cell radius R < 1km
FFT size NFFT 1024
Slot duration Tslot 0.667 ms
Physical Layer Frame duration Tframe 10 ms
Sampling frequency fS=1/TS 61.44 MHz
Number of OFDM symbols per slot NT 32
Guard interval in samples N∆ 256
UL/DL guard time in samples NG 1280
Number of UL modulated
sub-carriers NC 695
Occupied bandwidth BO 41.7 MHz
Number of UL OFDM data symbols ND,Symbol 24
Number of UL OFDM pilot symbols NP,Symbol 4
Number of UL data sub-carriers per
sub-band ND 24
Number of DL pilot sub-carriers per
sub-band NP 4
Max. Spreading factor in time (UL) SF 8
C. 4MORE Data Rates
Table II shows the available data rates on the 4MORE V0 UL. These are the MCS (Modulation Coding schemes)/transport formats that have been considered for LUT generation, and which are also used by the link adaptation unit at the MAC layer for resource allocation.
TABLE II
DATA RATES AND SPECTRAL EFFICIENCY FOR DIFFERENT MODULATION AND CODING RATES
QPSK, 16QAM and 64QAM modulations associated with duobinary turbo code (DTC). Spectral efficiency and useful data rates attainable per user for each modulation/coding scheme.
III. LINK LEVEL INTERFACE
In 4MORE, the resource allocation is very dependent on the channel evolution since the link adaptation and the packet scheduling uses channel state information to exploit the channel variability to improve packet transmission reliability. Thus, in order to be able to simulate accurately the effect of these functionalities, the Actual Value Interface (AVI) is considered. In contrast to WCDMA for which each coded symbol is spread over the whole bandwidth, in OFDM (and MC-CDMA system with reduced spreading factor) system, each symbol can be seen as mapped on a different sub-carrier or set of sub-carriers. Thus each codeword symbol experiences a different channel condition and therefore the instantaneous mean channel value can not be considered as a reliable quality metric; for this case another quality metric is considered: the Exponential
Effective SINR.
A. EESM ( Exponential Effective SINR Mapping) methodology
The transmission of a coded block over different sets of sub-carriers results in a number of SINR measures that equals the number of sub-carriers sets, which can be quite high. Hence, data compression is mandatory. The coded symbol SINR can be given by:
L h G SINR L m p m actual p / 1 0 2 , =
∑
− = (1)where Gactual is the actual geometry; hm,P , is the complex
amplitude of the mth sub-carrier in the pth subcarrier set; and
L is the spreading factor (MC-CDMA system)
The set of coded symbols SINRs are mapped to a single value named the Effective SINR value. This value can be used to match AWGN LUTs. The EESM [8] expression determines how the Effective SINR is obtained from the multiple SINR's on the different subcarriers:
− =
∑
= − P p SINR eff p e P SINR 1 1 ln β β (2)where β is to be optimized for every link mode (MCS) based on link level simulation results.
B. Interface Calibration
The LUTs employed in conjunction with the studied interfaces are obtained from link-level simulations using a transmission over AWGN channels. Such LUT have to be generated for each employed MCS. A large number of BLER (Block Error Rate) simulation points have to be obtained with the frequency selective channel model to calibrate the interface for each MCS. For each of the Nsim simulated BLER points lying in the range of interest, a predicted BLER, denoted by BLERpred,k(β) is obtained for each simulated point k. BLERpred,k(β) is then compared to the BLERk obtained by simulation and β can be optimised by attaining the least squares fit between the simulated and the predicted BLER points. The cost function to be minimized is:
∑
∑
= = − = ∆ = sim sim N k k N k k k pred f 1 2 1 2 ,( ) BLER| | BLER| BLER | β β (3)The remaining ∆BLER for the optimised value of β can be used as an indicator of the quality of the calibrated Link to System (L2S) interface.
C. EESM with MIMO
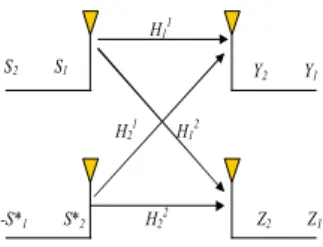
The EESM approach can be directly extended to orthogonal MIMO schemes, e.g. 2x2 and 4x2 Alamouti Receiver Diversity, used in 4MORE. These techniques are known to enhance the channel quality link but keep the throughput unchanged in order to preserve orthogonality. As an example, after despreading, the SINR at the output of the 2x2 Alamouti scheme in Fig. 5 can be written as:
L h h h h G SINR L m mp mp mp mp actual p / 1 0 2 , , 4 2 , , 3 2 , , 2 2 , , 1 + + + =
∑
− = (4)S2 S1 -S*1 S*2 H11 H12 H21 H22 Y2 Y1 Z2 Z1
Fig. 5 2x2 Alamouti MIMO scheme
And thus the methodology is kept the same. Moreover, no need for further calibration in case of orthogonal MIMO scheme since it considered only an enhancement of the channel link quality. Since the EESM objective is to match all kind of channel variations with the AWGN behaviour through the β variable and (2), the new MIMO channel quantity resulting from the Alamouti combination can be seen as an instance of the possible channel realizations.
IV. UPLINK DYNAMIC RESOURCE ALLOCATION
The base station allocates radio resources dynamically according to a four frames cycle mechanism:
• Phase A1: The BS computes the Resource Allocation map to be used for data transmission during the phase C1.
• Phase B1: The BS broadcasts the Resource Allocation map (except the power information) determined during the phase A1, so that all users in the cell have the information required to modulate the packets they will transmit during the Phase C1.
• Phase C1: The MS sends data according to the Resource Allocation map determined during phase A1. • Phase D1: The MS receives ACK (Acknowledgement)
messages from users having received their packets successfully during phase C1, and receives NACK (Negative Acknowledgement) from BSs having received their packets un-successfully during phase C1. These received messages will be used in the next phase A1 to select users to be scheduled in the following phase C1.
We define four different Hybrid ARQ (HARQ) channels numbered from 0 to 3. Each HARQ channel corresponds to one TDMA channel within a four frame cycle. Equally, we define four HARQ processes per MS, numbered from 0 to 3. The HARQ Process number n of mobile k is synchronized with the HARQ channel n of the base station. As shown by Fig. 6, the HARQ channels of the base station are time multiplexed, enabling the base station to achieve continuous transmission.
Fig. 6 HARQ data transmission cycle
The proposed DRA will always try to select the MS having the best propagation conditions so as to maximize cell throughput. Data blocks will be prioritized or discarded according to the time they have spent waiting in the queues.
DRA takes into account the following resource allocation constraints:
• Multiple users can transmit simultaneously over different sub-bands during one sub-frame, but each MS can have only one active HARQ process.
• Open loop power control performed for deciding on
Pdata, allocated to data transmission
• Perfect control signalling is assumed in downlink and uplink.
The determination of the resource allocation by the DRA during the current sub-frame requires several steps:
A. Updating Parameters DRA parameters 1) Processing ARQ messages
Each MS identified by the MS ID, will update the DRA parameters according to the ARQ messages received during the previous sub-frame. Therefore, there are several cases to distinguish: If an MS ID has received an ACK for the active ARQ, then the ARQ process is de-activated; However, if an MS ID has received a NACK for the active ARQ process, then the priority timer is activated. Thus, if the MS ID has not been scheduled within the priority time duration then its priority is set to high. Furthermore, if the NACK corresponds to a first transmission Non-Acknowledgement then the packet discard timer is set. If the packet has not been scheduled within this time, the packet is discarded.
2) Updating priority levels
For each active ARQ process of each MS ID, if the data block of the ARQ process has been waiting for a re-transmission for more than priority time, its priority must be set to high. The priority counter is also de-activated. For each un-active ARQ process of each MS ID, if the queue is not empty, then its priority must be set to low.
3) Updating Priority List
The two priority lists are updated. The ARQ processes that have a high level of priority are inserted into the high
priority list. The ARQ process with a low level of priority
and that are waiting for a packet to be transmitted are included in the low priority list.
B. Packet Scheduling
If the high priority list is not empty, then the ARQ process corresponding to the MS having the best SIR among the ARQ process of the list are selected. Otherwise, if the low
priority list is not empty, the ARQ process corresponding to
the MS having the best SIR among the ARQ process of the
low priority list is selected. Otherwise, no ARQ process is
scheduled. The scheduled MS ID is then allotted to the link adaptation unit that chooses MCS type according to the channel reliability and the available transmission formats available which are given by Table II. There are two cases to consider: if the selected MS ID and ARQ process requires a re-transmission, then the same MCS as for the first transmission is selected and the retransmission counter is incremented; if the selected MS ID and ARQ process requires a first transmission, then the number of bits that can be mapped onto one RU is deduced and the required number of bits from the user queue are withdrawn. Thus a subsequent packet concatenation/segmentation unit ensures that the variable size IP packets are encapsulated within the predefined radio block sizes; padding bits are used to ensure all radio blocks are filled.
C. Interaction with the physical layer.
Finally the following inputs are sent to the physical layer for data transmission:
• Dynamic Resource Allocation table that provides the MS, and ARQ process scheduled for transmission on the current sub frame.
• HARQ table that gives the selected MCS, and the data block.
V. SIMULATION RESULTS
The simulations were performed on a combined-dynamic snapshot simulator, where the mobiles are created at the beginning of each run, and remain active for the complete run duration. Furthermore, the pathloss and shadowing values remain constant within a run, whilst the fast fading is updated on each TTI (transmission time interval). Simulations were conducted in indoor environment where each run corresponds to 300 seconds of real time. The system level simulation parameters are given by Table III.
TABLE III
SYSTEM SIMULATION PARAMETERS
Symbol Quantity Value
fc carrier frequency 5GHz
PBS BS max. tx. Power 17 W
PMS MS max. tx. Power 0.5 W
No Thermal Noise density -174 dBm/Hz
NFm MS Noise figure 9 dB
CT Cell type tri-sectored
dis Cell radius 600 m
TTI TTI (Transmit Time Interval) 2 ms
Ts time slot duration 0.667 ms
Ue no. of users per sector 50
CQId delay between CQI measurement and
use of CQI by the BS
2 Fd
CQIm time between two CQI measurements 2 Fd
Nbtx Max nb of re-transmissions 3
S user speed 3 km/h
Gms Mobile Antenna Gain 0 dBi
Gbs BS Antenna Gain 14 dB
Antp tri-sectored antenna pattern As in [9]
HPt high priority timer 5 Fd
Dt discard timer 30 Fd
σs shadowing standard deviation 8 dB
cis inter-site correlation 0.5
dsh shadowing de-correlation length 20 m
The results obtained by simulations are based on the following assumptions:
o Scheduler operating in Max C/I and Round Robin modes
o No QoS (Quality of Service) guaranteed
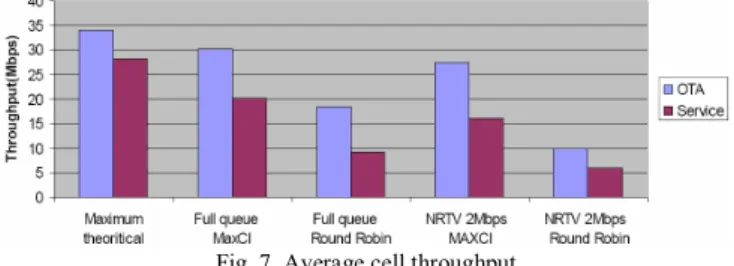
In Fig. 7 we show the simulated average OTA and service sector throughput for different service types. Where the OTA is the total number of bits transmitted over the air-interface, and the service throughput is the number of successfully transmitted bits within the simulation time. It can be seen that the maximum possible theoretical OTA throughput per sector is 31.4Mbps if the link adaptation were to allocate the highest MCS consistently to all users which are scheduled. However, the maximum achieved OTA throughput per sector is about 30 Mbps. In practice even users close to the base station may experience a deep fade due to the statistical variation of the channel and thus forcing the maxC/I to schedule users which are closer to the cell edge with a lower order MCS. Since all users are served at least once by the BS, packets retransmissions are likely to occur by those users at the cell edge since there is inadequate signal quality to support even the lowest MCS
option thus resulting in the discrepancy between service throughput and the OTA.
Fig. 7 Average cell throughput
It was observed that 21 Mbps service throughput can be achieved assuming a full queue traffic model with MaxC/I scheduling. The useful transmission bandwidth for the UL is 9.98 MHz resulting in a spectral efficiency of 2.1 b/s/Hz.
VI. CONCLUSION
The 4MORE vision aims to provide candidate solution to the cellular component of B3G systems by providing broadband services to the end-user in a seamless manner. 4MORE aims to provide 100 Mbps throughput in the indoor environment using STBC in the form of Alamouti encoding with MIMO. In this paper we provide a system level analysis of the 4MORE transmission chain in order to evaluate whether we can effectively exploit the spectral efficiency offered by the physical layer, and taking into account the additional losses introduced by the MAC layer due to control signalling. Simulation results have shown that 2.1 b/s/Hz spectral efficiency can be achieved establishing 4MORE as a viable candidate air interface for beyond3G cellular networks.
ACKNOWLEDGMENTS
The work carried out in the 4MORE project has been supported by the European Commission in the framework of FP6 with contract number IST-2002-507039, and the Treaty of Windsor Anglo-Portuguese Research Programme 0906-II-AG.
REFERENCES
[1] E. Gustafsson, and A. Jonsson, "Always best connected," IEEE Wireless Communications, vol. 10, no. 1, pp. 49-55, Feb. 2003.
[2] H. Atarashi, N. Maeda, S. Abeta, M. Sawahashi, ‘Broadband Wireless Access based on VSF-OFCDM and MC/DSCDMA,’
Proc. of IEEE PIMRC 2002, vol. 3, pp. 992-997, Sept. 2002.
[3] The IST MATRICE project. Available: http://www.ist-matrice.org. [4] The IST 4MORE project. Available: http://www.ist-4more.org. [5] S. M. Alamouti. A simple transmit diversity technique for wireless
communications. IEEE Journal on Selected Areas in
Communications, 16(8):1451-1458, Oct. 1998.
[6] 3GPP2 TR 25.996, 2003-05, “Network spatial channel model for multiple input multiple output simulations (release 6),” 3GPP spatial channel AHG, sCM-134, Apr. 2003.
[7] J. Rodriguez et. al, “D2.1: Definition of framework for joint layer design and optimization”, 4MORE WP2, Sept. 2004. http://www.ist-4more.org.
[8] Ericsson, “Effective SNR mapping for modelling frame error rates in multiple-state channels,” 3GPP2-C30-20030429-010.
[9] France Telecom R&D, “WCDMA-HSDPA system level simulator calibration”, Montreal, Canada, Tech. Rep. 3GPP R1-04-0499, May 2004.