DOI: http://dx.doi.org/10.1590/2446-4740.04717 Volume 33, Number 4, p. 362-369, 2017
Introduction
Skateboarding over the last decade has become a popular sport in Brazil. A 2009 study conducted by the Datafolha Research Institute aimed to measure the size of the skateboarding community in the Brazilian population, revealing that 3.8 million individuals were practicing the sport at that time. The survey was repeated in 2015 and showed a 123% growth in participants, with 8.5 million skateboarders (Confederação…, 2016).
The International Olympic Committee (IOC) made an important worldwide announcement regarding skateboarding on the 3rd August 2016, agreeing to the
inclusion of the sport of skateboarding in the Tokyo 2020 Olympic Games. The Tokyo 2020 Skateboarding Commission (TSC), together with the IOC, will oversee the insertion and regulation of the sport of skateboarding in the Olympics (Tokyo…, 2016).
Modern skateboarding (Street) uses the urban architecture (banks, walls, steps, handrails) as obstacles, with the skateboarder making use of a variety of different types of tricks to overcome the obstacles (Candotti et al., 2012). Research has shown the practice of skateboarding in urban regions to present a greater risk of injuries and accidents (Everett, 2002), where the most affected are children and untrained beginners (Department…, 2013; Fountain and Meyers, 1996; Forsman and Eriksson, 2001). Given the growing popularity of this sport and its intrinsic risk factor, alternative ways to assist the development of this discipline should be pursued, and the use of computer-assisted assessment (CAA) may be a promising tool.
Exertion Games, also called exergames, are games where the application of physical effort by the user is necessary (Muller et al., 2008). Studies have already proven that interactive simulations can lead to an improvement in sports performance, such as with skating and ice speed skating (Stienstra et al., 2011), rowing (Broker and Crawley, 2001), and even swimming (Marc et al., 2009).
Development of a skateboarding trick classiier using accelerometry
and machine learning
Nicholas Kluge Corrêa
1*, Júlio César Marques de Lima
1, Thais Russomano
2, Marlise Araujo dos Santos
31 Aerospace Engineering Laboratory, Microgravity Center, Faculty of Electrical Engineering, Pontiical Catholic University of Rio
Grande do Sul, Porto Alegre, RS, Brazil.
2 Center of Human and Aerospace Physiological Sciences, Faculty of Life Sciences & Medicine, King’s College, London, England. 3 Joan Vernikos Aerospace Pharmacy Laboratory, Microgravity Center, Faculty of Electrical Engineering, Pontiical Catholic
University of Rio Grande do Sul, Porto Alegre, Brazil.
Abstract Introduction: Skateboarding is one of the most popular cultures in Brazil, with more than 8.5 million skateboarders. Nowadays, the discipline of street skating has gained recognition among other more classical sports and awaits its debut at the Tokyo 2020 Summer Olympic Games. This study aimed to explore the state-of-the-art for inertial
measurement unit (IMU) use in skateboarding trick detection, and to develop new classiication methods using supervised machine learning and artiicial neural networks (ANN). Methods: State-of-the-art knowledge regarding
motion detection in skateboarding was used to generate 543 artiicial acceleration signals through signal modeling, corresponding to 181 lat ground tricks divided into ive classes (NOLLIE, NSHOV, FLIP, SHOV, OLLIE). The classiier
consisted of a multilayer feed-forward neural network created with three layers and a supervised learning algorithm (backpropagation). Results: The use of ANNs trained speciically for each measured axis of acceleration resulted in error percentages inferior to 0.05%, with a computational eficiency that makes real-time application possible. Conclusion: Machine learning can be a useful technique for classifying skateboarding lat ground tricks, assuming that the classiiers are properly constructed and trained, and the acceleration signals are preprocessed correctly.
Keywords Skateboarding, Accelerometry, Neural networks, Pattern recognition, Machine learning, Exergames.
This is an Open Access article distributed under the terms of the Creative Commons Attribution License, which permits unrestricted use, distribution, and reproduction in any medium, provided the original work is properly cited.
How to cite this article: Corrêa KN, Lima JCM, Russomano T, Santos MA. Development of a skateboarding trick classifier using accelerometry and machine learning. Res Biomed Eng. 2017; 33(4):362-369. DOI: 10.1590/2446-4740.04717.
*Corresponding author: Aerospace Engineering Laboratory,
Microgravity Center, Faculty of Electrical Engineering, Pontiical
Catholic University of Rio Grande do Sul, Avenida Ipiranga, nº 6681,
Partenon, CEP 90619-900, Porto Alegre, RS, Brazil. E-mail: nicholas.
Skateboarding-based exergames currently have no realistic interactive interface; the controls generally used by these games do not allow true movement or control of the skateboard. Nevertheless, advances in the development of micro-electromechanical sensors and inertial measurement units (IMUs) can assist in developing tools giving more realism (Skog and Händel, 2006).
The Tilt ‘n’ Roll was a prototype game developed by Anlauff et al. (2010), whereby a conventional skateboard was equipped with IMU sensors (3D accelerometer and gyroscope) that allowed the accelerations imposed on the skateboard to be monitored, and the differentiation of three tricks; Ollie, Frontside Ollie, and Bail (incorrect attempt/fall). A linear discriminant analysis (LDA) was
used for trick classiication, with 0.5 s windows to detect
events in the IMU signal, sampled at 70 samples/s.
The LDA classiier was modeled through a database
composed of 20 tricks collected for each class.
The classiication method showed a 90% true positive classiication, and real-time application was possible in
modern smartphones (Anlauff et al., 2010).
More recently, IMU sensors (3D accelerometer and gyroscope) combined with a trick detection algorithm
have been developed, in which four different classiication methods (Naive Bayes, Partial Decision Tree, Support Vector Machine, K-Nearest Neighbor) were compared
to distinguish between six different tricks; Ollie, Nollie,
Kicklip, Heellip, Pop Shove-it and 360-Kicklip (Groh et al., 2015). With a scale adjusted to 16g and 2000°/s, and signals sampled at 200 sample/s, the detection algorithm was able to point correctly to 323 of the 343 signals produced, resulting in a sensitivity of 94.2%. The Naive
Bayes and Support Vector Machine methods achieved the best results, with 97.8% of true positives. However, both these classiication methods developed in the study
produced a considerable computational effort, given the great number of extracted features for each trick detected (Groh et al., 2015).
The aforementioned studies used similar methods of data acquisition and detection, and both used linear regression techniques to classify the sample space. Furthermore, both studies pointed to a need for more
eficient and faster classiication algorithms so that larger
groups of tricks can be detectable, especially considering the wide variety of existing techniques used in Street skateboarding (Anlauff et al., 2010; Groh et al., 2015).
At present, machine learning is becoming increasingly
employed as an eficient solution for problems in several ields of knowledge. In the biomedical sector, artiicial
neural networks (ANNs) are used in situations involving
biometrics (face, iris, ingerprint and voice recognition),
image processing (convolutional neural networks),
and modeling biological structures with deep neural architecture (Haykin, 2001). The present study used
neural networks to develop a classiication method for skateboarding trick signals, using artiicial acceleration
signals as samples. A multilayer feed-forward neural network (MFFNN), allied with a supervised learning algorithm (scaled conjugate gradient, SCG), was used
to classify 543 artiicially generated signals.
Methods
Artiicial samples
Artiicial signals were generated using the software MATLAB 2015 and Signal Processing Toolbox,
based on the indings of previous studies (Groh et al.,
2015) and considering what is known about the acceleration and movement typifying each of the tricks chosen to incorporate in this study. Geometric representations of the real experience were modeled through the interpolation of triangles, with base and height determined by a Gaussian distribution (within a limit inferred by inspection of the reference signals).
An artiicial signal compatible with the references used
was obtained through calculating the moving average (MA of 2nd order) of the geometric representations. Allowing the base and height values of the triangles for a random Gaussian distribution permitted the generation of different signals with a similar appearance to the
real phenomenon. The method proved to be eficient
in generating a signature similar to that found in the literature (Groh et al., 2015). This process was performed for each trick class and its three signatures (X, Y and Z).
The artiicial signals generated were later added with
Gaussian noise to mimic the noise usually captured during the acquisition of physical phenomena. Thus, a total of 543 signals, 181 X-axis, 181 Y-axis, 181 Z-axis, were generated. Figure 1a shows the orientation of the
IMU axis of measurement in reference to the ictional
skateboard, and Figure 1b shows the type of signatures produced for each axis and class.
Five classes were used for development of the
trick classiiers. A total of 181 tricks were used with
a random distribution between 50 and 30 samples per class, being 32 Nollie (NOLLIE), 42 Nollie Backside
Shove it (NSHOV), 37 Kicklip (FLIP), 32 Backside Shove it (SHOV), and 38 Ollie (OLLIE). The regular
reference stance frame (foot positioning) was adopted
for the classes OLLIE, NOLLIE and SHOV, and the goofy foot stance for the classes NSHOV and FLIP.
This measure was used to test the interference of the
Detection of events and windowing
The signals were processed using the Signal
Processing Toolbox. Windowing was applied using the peaks of acceleration in the artiicial signals as reference;
perturbations above 5.000 mg (g = 9.8 m/s2; mg = g ×10-3) from the baseline correspond to the beginning of an event, while those above 10.000 mg help differentiate the event of interest from other disturbances in the signal.
It was estimated that 90 discrete points of acceleration
at most, sampled at 52 samples/s, would be suficient to
window any of the evaluated tricks. These methods and the chosen sample rates were based on similar studies (Anlauff et al., 2010; Groh et al., 2015) and sample rates used in IMU units for human motion detection.
Classiication heuristics
A sample size of 84 artiicial signals (28 X-axis
signals, 28 Y-axis signals, 28 Z-axis signals) for each
of four different Targets (OLLIE, FLIP, NSHOV and SHOV) was used in order to develop a classiication
method. The NOLLIE class was not used in this step to simplify the problem, given the similarity between OLLIE and NOLLIE (Groh et al., 2015).
The signals were at irst divided by axis origin
(X, Y or Z) so that patterns in samples from the same
class and axis could be extracted. Deinition of the
samples (Targets) that best represented each class and
axis was achieved through cross-correlation (Xcorr) between samples belonging to the same axis and
target (FLIP1X, FLIP2X, FLIP3X ... FLIP7X), and
the cross-correlation of each possible permutation was calculated for each of the axes of the four classes evaluated.
Cross-correlation between two signals generates
a further signal, whereby the maximum peak (σCrr)
is a measure of the similarity between the signals cross-correlated. These correlation peaks were used to
ind the signals that best represented their class (Target).
The Targets were composed of those signals that reached higher correlation values among their class and axis, each having the best ranked X, Y and Z signal as a reference
for comparison and classiication.
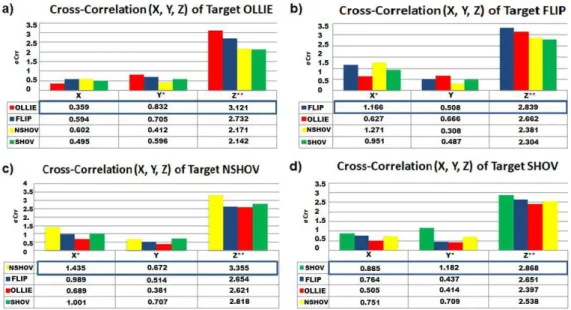
It is possible to create a classiication method based
on which axis best differentiates each class. Figure 2 illustrates the comparison (cross-correlation) between 84 signals and each Target previously assembled. The results are the arithmetic mean of the correlation
peaks (σCrr) of each comparison. The highlighted blue
line corresponds to the results of the Target when ranking its own class of signals.
These results showed which classes (and their
respective axis) are most likely to be falsely classiied,
also showing how the Z-axis is the most relevant in the
classiication of any class.
Figure 1. (a) Direction of linear acceleration axis; (b) Classes (NOLLIE, NSHOV, FLIP, SHOV, OLLIE) - artiicial signatures for acceleration
Through these indings a method that uses correlation coeficient values to score the result of each Target
in relation to the input signals was implemented. Table 1 shows a confusion matrix where the mean of the
correlation coeficients between the signals belonging
to the Z-axis are presented. Green depicts the value of the correlation between the class with itself, in red the class with lower correlation, and in blue the classes most
likely to be classiied incorrectly.
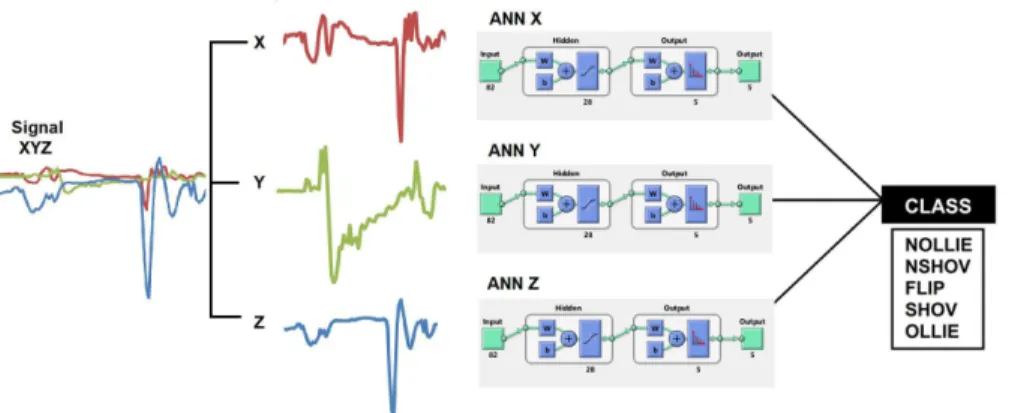
ANN architecture and training
The adopted heuristics (classiication by separate axis) was implemented using the Pattern Recognition Tool of
the Neural Network Toolbox. Signals were windowed at 82 points and 459 samples were used for training and
validation of the ANN XYZ (Artiicial Neural Network trained in the classiication of all axes), divided into
367 samples (80%) for training and 92 samples (20%) for validation. ANNs trained with only one of the axes (ANN X, ANN Y and ANN Z) were prepared with
153 samples, 80% for training and 20% for validation. The performance of the trained networks was measured by the minimum cross-entropy values obtained.
The developed ANNs are all MFFNNs that have three layers, an input with 82 neurons, a hidden layer with 28 neurons and a tan-sigmoid transfer function, and an output layer with 5 neurons and softmax transfer function. The learning algorithm used to train the network was SCG (scaled conjugate gradient back propagation) and an illustration of the network can be seen in Figure 3.
The following metric was adopted to deine the
number of neurons in the hidden layer (Hecht, 1989):
train e
in out
N N
N N
×
≤ + (1)
where Neis the number of neurons in the hidden layer,
N is the number of patterns, train the maximum allowed
error (~1%), Nin the number of inputs and Nout the
number of neurons on the output layer.
Figure 2. Mean values of cross-correlation for all Targets: (a) OLLIE; (b) FLIP; (c) NSHOV; (d) SHOV. **axis with greater signiicance in the
Target classiication; *intermediate signiicance; axis with less signiicance has no marking; σCrr – peak correlation score.
Table 1. Confusion matrix of the correlation coeficients among classes (Z-axis).
Class Correlation coeficients
1 NOLLIE 0.875 0.781 0.642 0.433 0.732
2 NSHOV 0.781 0.824 0.630 0.567 0.496
3 FLIP 0.642 0.630 0.704 0.384 0.657
4 SHOV 0.433 0.567 0.384 0.633 0.164
5 OLLIE 0.732 0.496 0.657 0.164 0.861
NOLLIE NSHOV FLIP SHIOV OLLIE
1 2 3 4 5
Results
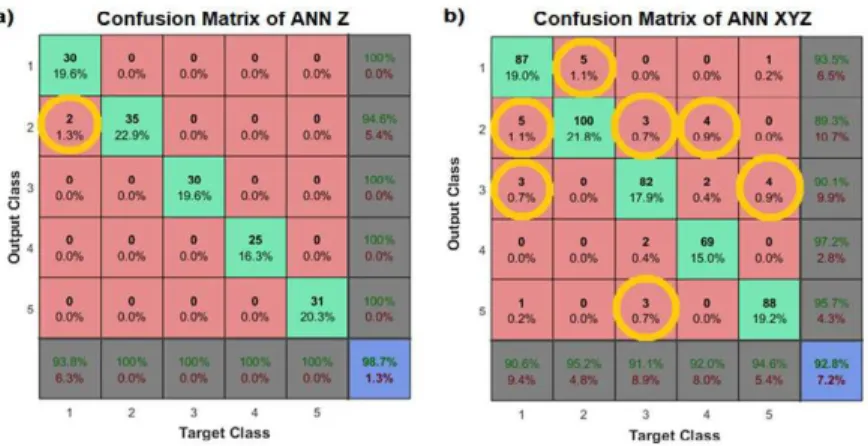
Figure 4 shows the decrease in cross-entropy values
(low values mean good classiication) during training
and validation of the ANN Z (a) and the ANN XYZ (b). The validation of ANN XYZ obtained the minimum cross-entropy value in the 42nd iteration, with a value of 0.078475. On the other hand, the performance values were improved in the evaluation of ANN Z; trained on only one axis it obtained a minimum cross-entropy value
of 0.019549 in the 23rd iteration. This cross-entropy value represents the best ANNs trained during this study.
However, the cross-entropy values of the specialized
ANNs were always lower than the non-specialized ANNs. Figure 5 presents the confusion matrices of both networks, where the total percentage of correctly and
incorrectly classiied tricks during the training and
validation steps can be visualized. The number of
true classiications is lagged in green, false positives
in red, and circled in yellow are the classes that
Figure 3. Schematic view of the ANNs.
Figure 4. (a) Performance of ANN Z - cross-entropy vs. number of iterations (epochs); (b) Performance of ANN XYZ - cross-entropy vs. number
of iterations (epochs).
caused the highest number of false positives for each target. ANN Z (Figure 5a) obtained 98.7% accuracy
(error = 1.3%), and the percentage of true classiications
of the ANNs X and Y are 94.8% (error = 5.2%) and 96.7% (error = 3.3%), respectively. Figure 5b shows the confusion matrix of ANN XYZ, with true positive rates of 92.8% (error = 7.2%).
The accuracy of the ANN XYZ, when tasked with
the classiication of a single-axis, was also improved.
The classification of the signals corresponding to the X, Y and Z axes obtained the respective results: 88.2% (error = 11.8%), 89.5% (error = 10.5%) and 96.1% (error = 3.9%). Again, discrimination by the
Z-axis obtained the best result. However, the classiication performance of the X and Y axes is signiicantly lower
for the ANN XYZ than the X and Y ANNs, a result that
justiies the choice of using an ANN trained speciically
for each axis.
The computational effort and performance of the two
classiication methods were quantiied by measuring the runtime of each classiier (in seconds) as a function of
the number of samples. Table 2 presents the performance of the Cross-Correlation (Xcorr) and ANN methods.
Table 2 shows the ANN method classiies with a higher speed (up to 10-3 seconds) and a greater number of signals than the method using cross-correlation
coeficients (σcorr). In addition, performance reduces (± 50 × 10-3 seconds) when the classiication of more
than one trick (3 acceleration signals) is required.
Figure 6. Schematic of the classiier formed by specialized ANNs.
A low error percentage can be obtained with a fast
computational response, as classiication by ANNs
allows the use of only the data coming from a single axis of acceleration (Z-axis). By classifying each of the three axes with the specialized ANNs developed in this study, we can decrease the error percentage to 0.04%, as presented in Figure 6.
Discussion
The Z-axis was found to be the most effective discriminator among the classes evaluated, given the
signiicantly higher cross-correlation values expressed by
the Z-axis in comparison to the other axes, as presented in Figure 2. In addition, analysis of the confusion matrix
generated by the correlation coeficients between the
created Targets and the input artiicial signals (Table 1)
revealed a similar pattern to the number of false positives obtained by ANN XYZ.
Neural networks were able to classify 5 tricks (15 signals) in 10-3 seconds. Although both classiiers (ANN and Xcorr) were able to produce a response in less than 6x10⁻³ seconds, the computational effort of the
Xcorr classiier increased signiicantly, 70 × 10-3 seconds, as the number of correlations to be calculated increased,
making it impossible to develop a fast classiier with a
larger class sample space.
The ANN XYZ incorrectly classiied 7.2% of the
tricks, however, it can be seen from the confusion matrices (Figure 5) that similarities between the acceleration
Table 2. Performance of the classiiers (ANN and Xcorr).
ANN train
ANN
validation Xcorr Xcorr Xcorr
Seconds 0.1 - 0.8 0.001 - 0.003 0.004 - 0.006 0.045 - 0.050 0.068 - 0.070
signals for some of the classes affected the classiication of the network, such as with the Xcorr method. It is
clear that incorrect classiications between classes are
due to the presence of similarities, as exposed by the Xcorr method. In the situation of the NOLLIE and
NSHOV class, for example, both tricks are executed
with a similar foot positioning (Nollie), while for the
NSHOV and SHOV class, both tricks have a rotation of
180º around the Z-axis, but in opposite directions due to stance inversion (regular-goofy).
The eficiency of the classiier developed in this study
compares favorably with those from previous studies. Groh et al. (2015) achieved 97.8% true positives for the
Support Vector Machine and Naive Bayes classiiers,
categorizing tricks into 6 different classes, with each trick having 54 features calculated, such as the mean, variance, kurtoses, and spectral density, among other parameters obtained by the IMU signal analysis. A study by Anlauff et al. (2010) obtained 97% true positives using
an LDA classiier, categorizing into 3 different classes. During classiication seven features were extracted from
each event for processing (3D accelerometer, 3D gyroscope, force sensing resistor - FSR). The designed Tilt ‘n’ Roll
classiier proved a good choice for real-time application, however, the classiier was only able to differentiate two
classes of tricks using the data from the IMU sensor, with the FSR required to classify the extra third class
(Bail). Both studies highlighted the need for a classiier
that could cover a greater number of classes without
losing computational eficiency (Anlauff et al., 2010;
Groh et al., 2015).
The proposed classiication by axis proved to be an eficient procedure with minimum dimension use,
low-density separation and promising results for real-time application. The combination of IMU and machine learning as a pattern recognition method can perhaps
provide real-time activity and logging. However, eficiency can be lost due to overitting and high density in class
separation when working with large data groups with a multilayer perceptron trained in a supervised manner.
The use of deep neural networks (deep learning) and
semi-supervised training (Pseudo-Label) is recommended
for future studies. Both the machine learning techniques have low density in class separation, low computational
cost, and a high classiication rate for cases with a large
group of classes (Bengio et al., 2012; Donghyun, 2013). Currently available technologies, whether being the
quality of IMU or eficiency of artiicial intelligence, can
create extremely useful tools, especially in applications involving sensors and human motion recognition. More realistic tools can be developed with high positive
rate classiication and real time response for CAA in
skateboarding and other disciplines.
Acknowledgements
This research was supported by the Coordination for
the Improvement of Higher Level Personnel (CAPES), and the National Council for Scientiic and Technological Development (CNPq). The authors would like to thank
the researchers from the Microgravity Center at the
Pontiical Catholic University of Rio Grande do Sul (PUCRS).
References
Anlauff J, Weitnauer E, Lehnhardt A, Schirmer S, Zehe S, Tonekaboni K. A method for outdoor skateboarding video
games. In: Shen RL, Inami M, Haller M, Kitamusra Y, editors. ACE’10: Proceedings of the 7th International Conference
on Advances in Computer Entertainment Technology; 2010 Nov 17-19; Taipei, Taiwan. New York: ACM; 2010. p. 40-4.
Bengio Y, Courville A, Vincent P. Representation learning:
a review and new perspectives [internet]. Ithaca: Cornell University Library; 2012. 30 p. [cited 2012 Jun 24]. Available from: https://arxiv.org/pdf/1206.5538.pdf.
Broker JP, Crawley JD. Advanced sport technologies: enhancing olympic performance. In: Proceedings of The International
Symposium on Biomechanics in Sports [internet]. 2001. [cited 2001 Oct 31]. Available from: https://ojs.ub.uni-konstanz.de/ cpa/article/view/3920/3637.
Candotti CT, Loss JF, Silva RE, Melo MO, Teixeira RB, Delwing GB, Noll M. Lower limb force and performance in skateboarding: an exploratory study. Rev Bras Ciênc Esporte. 2012; 34(3):697-711. http://dx.doi.org/10.1590/S0101-32892012000300012.
Confederação Brasileira de Skate. Dados do esporte. CBSk [internet]. 2016. Available from: http://umti.com.br:8040/ paginas/dados-do-esporte.
Department of Research & Scientific Affairs. Skateboarding safety [internet]. Rosemont: AAOS; 2013. [cited 2001 Oct 31]. Available from: http://orthoinfo.aaos.org/topic.cfm?topic=a00273.
Dong-Hyun L. Pseudo-Label: the simple and efficient
semi-supervised learning method for deep neural networks. In:
Goodfellow I, Erhan D, Bengio Y, editors. Proceedings of The
ICML 2013 workshop: challenges in representation learning
- WREPL [internet]; 2013 June 21; Atlanta. 2013 [cited 2013
Aug 26]. Available from: http://deeplearning.net/wp-content/ uploads/2013/03/pseudo_label_final.pdf.
Everett WW. Skatepark injuries and the influence of skatepark design: a one year consecutive case series. J Emerg Med. 2002; 23(3):269-74. PMid:12426018. http://dx.doi.org/10.1016/ S0736-4679(02)00528-0.
Forsman L, Eriksson A. Skateboarding injuries of today. Br J Sports Med. 2001; 35(5):325-8. PMid:11579065. http://dx.doi. org/10.1136/bjsm.35.5.325.
Groh BH, Kautz T, Schuldhaus D, Eskofier BM. IMU: based trick classification in skateboarding. In: Proceedings of The
KDD Workshop on Large-Scale Sports Analytics; 2015 Aug 10; Sydney, Australia. New York: ACM; 2015. p. 1-7.
Haykin S. Redes neurais: princípios e prática. 2. ed. Porto Alegre: Publisher Bookman; 2001.
Hecht NR. Theory of the Backpropagation. In: Proceedings
of The IJCNN: International Joint Conference on Neural Networks; 1989 Jun 18-22; Washington. Washington: IJCNN; 1989. p. 593-605.
Marc B, Förster K, Tröster G. Swim master: a wearable
assistant for swimmer. In: Proceedings of The 11th International
Conference on Ubiquitous Computing; 2009 Sept-Oct 30-03; Orlando, Florida. New York: ACM; 2009. p. 215-24.
Muller F, Gibbs M, Vetere F. Taxonomy of exertion games. In: Proceedings of The 20th Australasian Computer-Human
Interaction Conference; 2008 Dec 8-12; Cairns, Australia.
Australia: OZCHI; 2008. p. 8-12.
Skog I, Händel P. A versatile PC-based platform for inertial navigation. In: Proceedings of The 7th Nordic Signal Processing
Symposium; 2006 Jun 7-9; Reykjavik, Iceland. NORSI; 2006. Stienstra J, Overbeeke K, Wensveen S. Embodying complexity through movement sonification: case study on empowering
the speedskater. In: Proceedings of The 9th ACM SIGCHI Italian Chapter International Conference on Computer-Human
Interaction: Facing Complexity; 2011 Sep 13-16; Alghero, Italy. New York: ACM; 2011. p. 39-44.