Revista Brasileira de Recursos Hídricos
Versão On-line ISSN 2318-0331RBRH vol. 21 no.1 Porto Alegre jan./mar. 2016 p. 152 - 167 Artigo Científico/Técnico
Benício Emanoel Omena Monte1, Denis Duda Costa2, Mahelvson Bazilio Chaves3, Louis de Oliveira Magalhães4 and Cintia B. Uvo5
1,3,4 Federal University of Alagoas, Center for Technology, Maceió, AL, Brazil
[email protected]; [email protected]; [email protected]
2, 5 Lund University, Department of Water Resources Engineering, Lund, Sweden
[email protected]; [email protected] Received: 30/06/15 - Revised: 31/08/15 - Accepted: 13/11/15
ABSTRACT
Overbank looding caused by historically high lows, such as that in the Rio Mundaú watershed (lying between the states of Alagoas and Pernambuco) in 2010, has been the cause of widespread damage. The purpose of work described in this paper was to propose a mapping of areas liable to looding in the township of Rio Largo (Alagoas) in the Rio Mundaú watershed by means of an “off-line” coupling of the hydrological/hydraulic models (MGB-IPH/ HEC-RAS), through consideration of extreme loods with different return periods for discharge. The hydrological model had a parameterization appropriate for extreme loods, using as input rainfall data with different return periods. Calibration and validation of the hydrological model were adequate in drainage areas larger than 1500 km2, but were less acceptable in headwater drainage areas where different geology and soil cover gave rise to surface runoff. The
hydraulic model showed good agreement with point observations of lood levels in 2010 in both rural and urban areas along the water-course (R² = 0.99; RMSE = 1.41 m and CV (RMSE) = 0.04). In urban areas distant from the river, however, lood levels were over-estimated, indicating a need to use more detailed Digital Elevation Models. Flood events with return period greater than 50 years have the potential to cause great damage (loods exceeding 0.46 km2 in the urban area). The study showed that the use of coupled models was a viable approach for mapping areas liable to looding, when it is not possible
to analyse local low frequencies in support of a hydraulic model.
Keywords: Floods. Models. Coupling.
Inundações ribeirinhas ocasionadas por cheias históricas, como, por exemplo, no ano de 2010 na bacia hidrográica do rio Mundaú (entre os estados de Alagoas e Pernambuco), promovem danos de grandes proporções. O objetivo deste trabalho foi propor um mapeamento de áreas inundáveis no município de Rio Largo (Alagoas), bacia hidrográica do Mundaú, através de acoplamento “off-line” de modelos hidrológico/hidráulico (MGB-IPH/HEC-RAS), con-siderando eventos de cheias extremas com diferentes tempos de retorno de vazão. Foi utilizada uma parametrização voltada para eventos extremos de cheia no modelo hidrológico, utilizando como entrada dados de chuva para diferentes tempos de retorno. A calibração e validação do modelo hidrológico foi adequada em áreas de drenagem superiores a 1.500 km², o que não foi veriicado em áreas de drenagem próximas a nascentes, as quais possuem geologia e tipo e cobertura do solo que propiciam escoamentos supericiais. O modelo hidráulico indicou boa correspondência com os dados pontuais das marcas de cheia do ano de 2010 em áreas rurais e urbanas perto do curso d’água (R² = 0,99; RMSE = 1,41 m e CV (RMSE) = 0,04). Entretanto, em áreas urbanas distantes do rio, houve uma superestimação, assinalando a necessidade do uso de Modelos Digitais de Superfície mais detalhados. Eventos de cheia com tempo de retorno acima de 50 anos possuem grande potencial de danos (inundação acima de 0,46 km² na área urbana). Este estudo indicou o uso de modelos acoplados foi viável para representar o mapeamento de áreas inundáveis, quando não é possível realizar uma análise de frequência local de vazões para subsidiar o modelo hidráulico.
Palavras Chave: Inundações. Modelos. Acoplamento.
Hydrological and hydraulic modelling applied to the mapping of lood-prone areas
Modelagem hidrológica e hidráulica aplicada ao mapeamento de áreas inundáveis
RESUMO
RBRH vol. 21 no.1 Porto Alegre jan./mar. 2016 p. 152 - 167
inTRODUCTiOn
Overbank loods resulting from high lows have had
important socio-economic consequences all over the world. During the period from 2001 to 2014, more than a billion of
the world’s people were affected by looding, and almost 80
thousand died (EM-DAT/OFDA/CRED, 2015). The main
hydrologic-hydraulic factors giving rise to looding are relief,
type and intensity of precipitation, vegetation cover, drainage capacity, geology, river morphology with extension of channel
and loodplain, channel-loodplain interaction and roughness. To minimize the socio-economic impacts of looding,
solutions for preventing it have consisted of either structural or non-structural measures. Usually, non-structural measures are
inancially more viable, focussing on prevention and conservation
to give better harmony between the environment annd urban areas along the river (TUCCI, 2007).
One of the more widely known non-structural measures
is the mapping of areas susceptible to looding, a inancially viable
option which is useful in risk studies. Flood mapping commonly uses 1D and 2D hydraulic mathematical models (conceptual or empirical) to represent the hydraulic phenomena that determine
water-levels (1D and 2D) and the area looded These hydraulic
models can also be coupled to hydrological models (COLLIS-CHONN; COLLIS(COLLIS-CHONN; TUCCI, 2008; COLLISCHONN et al., 2007; PAIVA; COLLISCHONN; BUARQUE, 2013; PAZ et al., 2011) and to atmospheric models (DMITRIEVA; PESKOV, 2013; SRINIVAS et al., 2013; TRAPERO; BECH; LORENTE, 2013), to give a complete conceptual representation of all the processes involved.
The coupling of hydrological and hydraulic models
has been a valuable tool in lood studies (BALLESTEROS et
al., 2011; BONNIFAIT et al., 2009; GRIMALDI et al., 2013; PAZ et al., 2011; SARHADI; SOLTANI; MODARRES, 2012; SURIYA; MUDGAL, 2012), because it enables future scenarios to be simulated from limited input data. Moreover, this coupling combined with additional data and modelling procedures, such as remote-sensing (BATES et al., 2006; CHORMANSKI et al., 2011; RABER et al., 2007) and Geographical Information Systems (GIS) (CASAS et al., 2006), adds greatly to the opti-mization and display of results.
Hydraulic modelling requires information that
adequa-tely represents looded areas, including (a) data or estimates of lows upstream of the reach of interest (SARHADI; SOLTANI;
MODARRES, 2012) and (b) good quality data on regional topo-graphy and bathymetry (HORRITT; BATES, 2001; NICHOLAS; WALLING, 1997). Lack of adequate topographic and bathymetric
data can cause problems for the description of looded areas
given by the hydraulic model (HARDY; BATES; ANDERSON, 1999; HORRITT; BATES; MATTINSON, 2006; SANDERS, 2007), because the channel bed and morphology of the region adjacent to the water-course are inadequately represented.
In general, townships within the Mundaú hydrographic
basin have urbanized lood-plains and experience repeated looding, sometimes causing extreme damage (1914, 1941, 1969,
1988, 1989, 2000, 2010), showing their fragility in the face of
lood events (FRAGOSO JÚNIOR; PEDROSA; SOUZA, 2010).
After the damage in the Mundaú basin caused by the loods of
1988 and 1989, studies recommended protective measures such
as increased drainage capacity, containment of lood-water by
reservoirs, reforestation, channel works and the installation
of lood warning and control systems (ALAGOAS; PNUD;
OAS, 1990). Despite these many recommendations no action, either structural or non-structural, was effectively undertaken. Furthermore, river-side townships in the Mundaú basin have
had no studies that quantify the extent of looding caused by
extreme events, even though such studies would yield information relevant to society and underwrite planning and management for public policy and decision-making.
Hence, the aim of the present work is to explore the
possibility of mapping areas liable to looding in the township of
Rio Largo (AL) by means of coupled hydroloical and hydraulic models in a GIS environment, using hydrological events with different return periods.
METHODOLOgY
Study Area
The area of the Rio Mundaú drainage basin is 4,126 km², and is situated between the states of Pernambuco and Alagoas. The study area for the hydrological model comprises the whole of the drainage basin (Figure 1) but the hydraulic model uses only one reach of the main river with length 4.64 km, within the urbanized area of the Rio Largo (AL) township (Figure 1).
The prevailing climate within the basin, according to
the Köppen classiication, is of type Bsh, with precipitation
and mean annual temperature approximately 800 mm and 18ºC respectively (COTEC, 1999).
According to measurements taken at the Fazenda Boa Fortuna gauging station (Código 39770000 – ANA), nearest to
the basin outfall and upstream of the Rio Largo, the mean low
is 25.78 m³/s, with peak discharges greater than 1000 m³/s and
low lows less than 10 m3/s (COTEC, 1999). The topography
is steeply sloping, suggesting rapid surface low. In the basin
headwaters the altitude is near 1000 m; in the lower reaches, altitude reaches a minimum of 8 m (COTEC, 1999).
In the headwaters and middle reaches, the geology is determined by the Pernambuco-Alagoas Massif of crystalline
rocks, igneous or metamorphic in origin, with low iniltration
capacity; the basin’s lower reaches are derived from the Sergipe -Alagoas sedimentary basin, which occupies only a small part
of the basin where iniltration capacity is higher.
Monte et al.: Hydrological and hydraulic modelling applied to the mapping of lood-prone areas
and associations (0.14%), shallow soils; (g) Eutrophic Haplic Gleissols (0.34%), soils with excess water, and (h) Eutrophic and Distrophic Neossol Association (0.77%) (Adapted from COTEC, 1999).
Land use is divided among: areas showing effects of human activity, 75.68 % (urban areas, pasture and small- to large-scale agricultural systems, particularly for sugar-cane production) and only 22.76 % covered by forest, scrubland or original cover (COTEC, 1999).
The Rio Largo township is one of the last river-side towns lying on the Rio Mundaú, the oldest part lying on the Cachoeira do Meirim geological fault which separates crystalli-ne from sedimentary rocks, causing a marked change in level of about 13 m. In addition, the township is sited on a narrow
lood-plain. The town’s urban perimeter corresponds to the study area to be mapped for liability to looding, with a reach
comprising 4.64 km of the Rio Mundaú, within an urban area of 18.55 km².
HYDROMETEOROLOgiCAL DATA
For frequency analysis, data were used from raingauge sites maintained by the National Water Agency (ANA); by the Pernambuco Technological Institute (ITEP); by the Secretariat for the Environment and Water Resources of the State of Alagoas
(SEMARH-AL); and from the low-gauging station Fazenda
Boa Fortuna on the Rio Largo, operated by ANA. These sites were selected by means of a Gantt graph which displayed the availability of data. The selected sites were those with fewest gaps in record (those with gaps occurring in months with low precipitation, with longest gap not exceeding 30 days) in a common period of 30 years at all sites (1962-1991); this gave a
selection of 31 raingauge sites (Figure 1). The period January
to December was used, with the criterion that at least 15 years of maximum annual rainfall were included, in order to reduce statistical uncertainty (SAF, 2010).
To use the MGB-IPH model, hydrological data at daily intervals were taken from the raingauge network (97 gauges) in the Rio Mundaú drainage basin by ANA, ITEP e SEMARH-AL,
Figure 1 – Location of the hydrographic basin of the Rio Mundaú. Meteorological stations, low-gauging stations and raingauge
RBRH vol. 21 no.1 Porto Alegre jan./mar. 2016 p. 152 - 167
with 5 low-gauging sites of ANA and meteorological stations
(2 sites) on the National Institute for Meteorology (INMET) (Figure 1).
Frequency Analysis of Rainfall and Maximum Flows
The extreme rainfall events in each year of the selec-ted period were analysed for consistency and the removal of outliers which may have occurred through recording errors. This procedure used the program Expert System for At-Site Frequency Analisys of Hydrologic Variables® (SEAF), based
on methods of Grubbs and Beck (1972). One value in each of the historic series from two raingauge sites (Caetés - 0836008
(ANA); Jurema – 0836021 (ANA)) was discarded, because they
looked like recording errors (values greater than 50% of the highest rainfall in the series without the outlier).
A non-parametric hypothesis test was then used to test
for homogeneity in raingage and low records using the Wil -coxon Sum of Ranks test for independent samples (equivalent
to a Mann-Whitney test), with signiicance level α = 0.05 for a
two-tailed test. The test is based on the comparison of medians of two or more samples from a data-set. The null hypothesis is that the samples are from populations having the same median (TRIOLA, 2008). In a hydrological context, the Mann-Whitney
test identiies whether the samples come from different events,
ordinary rainfalls or unusual phenomena.
Normally the choice of distribution for maxima is open to some discussion, because each distribution has strengths and weaknesses. In this work, the Generalized Extreme Value (GEV) distribution was used, since it has extensively used
in studies of extreme rainfalls and river lows (HOSKING;
WALLIS; WOOD, 1985; KATZ; PARLANGE; NAVEAU, 2002; KOUTSOYIANNIS; BALOUTSOS, 2000; SAF, 2010; TRAMBLAY et al., 2012). The GEV distribution’s three para-meters include one for position, which avoids problems from smoothing the distribution when data series are short. This may occur, for example, when the Gumbel distribution is used (ROGGER et al., 2012). The method of Maximum Likelihood, which maximizes a function of the distribution’s parameters, was used to estimate the GEV parameters. This method yields estimates of the parameters with least variance and which are
consistent, suficient and with greatest asymptotic eficiency. A Kolmogorov-Smirnov goodness-of-it test was used with
plotting positions of empirical data given by the Gringorten equation (appropriate for the GEV distribution). Extreme values
of rainfall and low were then obtained for return periods 2, 5,
10, 25, 50, 100, 200, 500 and 1000 years.
Hydrological Modelling
The transformation of rainfall to runoff was effected by using the MGB-IPH hydrological model developed by Collischonn
et al (2007) and further reined by Paiva, Collischonn and Buarque
(2013). It is a distributed model which simulates processes in the land phase of the hydrological cycle in terms of physical and conceptual relations. The model has been shown to be adequate
in various applications to medium-size Brazilian drainage basins (between 2.000 km2 and 10.000 km2) (GAMA, 2011; CHAVES,
2013) and larger (> 10.000 km2, COLLISCHONN et al., 2007; PAIVA; COLLISCHONN; BUARQUE, 2013).
The model has four components: soil water balance,
evapotranspiiration, low (surface, sub-surface and subterranean), and propagation of lows through the drainage network. MGB
-IPH is appropriate for Brazilian conditions, allowing easy use of of input data (remote-sensed images, digital terrain models, and hydrometeorological data) in formats produced by national agencies. A daily time-interval was used for simulations. Phy-siographic characteristics of the basin (division into sub-basins, river reaches, lengths and slopes of rivers) were obtained using ArcHydro, an extension of the ArcGIS software.
The basin was divided into 5 sub-basins and 95 mini -basins (i.e., elements draining to a single river reach) using the Digital Elevation Model (DEM) Shuttle Radar Topographic Mission (SRTM) of the National Aeronautics and Space Admi-nistration (NASA) provided with corrections for missing data given by the Consultative Group on International Agricultural Research-Consortium for Spatial Information (CGIAR-CSI). Each mini-basin had its characteristic type, use and soil cover
that deined its HRU (Hydrological Response Unit) (KOUWEN
et al., 1993). Following the grouping of Sartori, Genovez and
Neto (2005a; 2005b) (Table 1), soils were classiied as shallow or deep; soil cover was classiied as exposed soil, short vegetation, and forest, resulting in 6 HRUs (blocks) for the basin. To deine the HRUs for the Rio Mundaú basin, these were reclassiied and
processed using the digital soil map of the Empresa Brasileira de Pesquisa Agropecuária (EMBRAPA) (Published in 2001 at Scale 1:5.000.000) and originating in the Project RadamBrasil. Images from the Landsat 7 satellite (Thematic Mapper sensor) were used for classifying land-use and soil cover (Table 2 and
Figure 2). Values of ixed and calibrated parameters were based
on HRU characteristics, following recommendations given in the MGB-IPH manual.
Fixed parameter values were taken for albedo, leaf-area index, canopy cover and surface resistance. Calibrated
parame-ters included soil moisture capacity (Wm); a parameter deining
the shape of the storage-saturation relation (b); a parameter
controlling low during dry periods (Kbas); a parameter con
-trolling quantity of soil water emerging as surface low (Kint); a
parameter controlling the shape of the reduction in intermediate
or sub-surface drainage (XL); a parameter controlling low
from subterranian reservoir to the soil surface layer during a
time-interval (CAP); residual storage (Wc); the coeficient for surface propogation in cells (CS); the coeficient for sub-surface
propagation in cells (CI); and the delay for the subterranean re-servoir (CB) (Table 3). A value 0.0100 m³/ (s.km²) was obtained
for speciic baselow (QB).
The model was calibrated manually. The period chosen
for model calibration was from January 1998 to December 2005 and the validation period from January 2006 to January 2008.
The objective functions used to evaluate calibration were the
Nash-Sutcliffe coeficient (NS), the Nash-Sutcliffe coeficient
156
Monte et al.: Hydrological and hydraulic modelling applied to the mapping of lood-prone areas
Group Depth Permeability
A Very deep (> 2 m) or Deep (1 m a 2 m) Rapid/ Moderate B Deep (1 m to 2 m) Rapid/ Moderate C Deep (1 m to 2 m) or Moderately Deep (0.5 m to 1.0 m) Slow/Rapid D Moderately Deep (0.5 m to 1.0 m) or Shallow (0.25 m a 0.50 m) Slow/ Moderate
���(%) = ( Aom
Ao+Am−Aom) × 100
Table 1 - Grouping of soils in the Rio Mundaú basin in terms of their characteristics
Figure 2 - HRUs in the Rio Mundaú hydrographic basin
Table 2 - Caracteristics of soil type and use in HRUs (Blocks) and their percentage area in the basin
RHU Type and Soil Use Area % Block 1 Soil D + Bare soil 5.99 Block 2 Soil D + Short Vegetation 12.79 Block 3 Soil D + Forest 1.37 Block 4 Soil C + Short Vegetation 57.68 Block 5 Soil C + Bare soil 6.28 Block 6 Soil C + Forest 15.89
���(%) = ( Aom
RBRH vol. 21 no.1 Porto Alegre jan./mar. 2016 p. 152 - 167
Hydraulic Modelling and Mapping of Flood-Prone
Areas
To determine lood levels for different return periods,
the hydraulic model HEC-RAS 4.1, developed by the Hydrologic Engineering Center (HEC) was used. HEC-RAS® is a
mathe-matical model that simulates super-critical, sub-critical or mixed
lows in natural or artiicial channels (WARNER et al., 2010). It
can be used to calculate and analyse one-dimensional hydraulic
lows in permanent, quasi-permanent or no-permanent regimes.
It can also be used to simulate river-bed erosion and sediment transport, and to model water quality in the simulated reach.
The model requires data on low, localized change in low (non-permanent regime), boundary conditions, topgraphic
-bathymetric information at each transverse section, a roughness
coeficient for each transverse section, and a post-processing DEM to spread the lood into a pseudo 2D, since velocities in
the two-dimensional plane are not simulated.
A simpliied coniguration of the model was used in which low regime was taken as permanent, since the input data consist of an average of two daily readings. This simpliication
gives results for the project which err on the conservative side.
To ensure that estimates of looded areas were fully
representative, topographic-bathymetric sections were needed
(i.e., sections which integrate channel bathymetry with lood-plain topography) that were representative of low conditions. The locations of topographic-bathymetric sections were deined by ield visits to the river reach, and sought to identify sites where
river hydrulic conditions varied, while taking into account the viability of survey at the section. Variation in hydraulic condi-tions can result from changes in river-bed slope, the presence of bridges, islands or other obstructions, widening or narrowing of the transverse section, or from other causes.
Five such sections were deined in the Rio Largo township (Figure 3). The topographic survey of the lood-plain
used a Total Station (Topcom model). The margins of bathyme-tric sections were geo-referenced using a GPS (model Garmin Etrex H, accuracy < 10 m). The bathymetric survey of two of
the sections used an Acoustic Doppler Current Proiler (ADCP,
model M9 SonTek®).
In the direction upstream-downstream, bathymetry of the transverse secction at Fazenda Boa Fortuna (4.64 km
distant from the inal section), and of the penultimate section
(at distance 0.52 km from the third section and 0.95 km from the last section downstream) and of the last section downs-tream, were surveyed by ADCP. The section at Fazenda Boa Fortuna set the boundary conditions for the hydraulic model,
where maximum lows were estimated by statistical distribution
and the hydrological model. Being located 1.98 km from the
section at Fazenda Boa Fortuna and at 2.66 km from the inal downstream section, the second transverse section was deined
by bathymetric measurement because of rocks in the river bed. The third section (distant 1.19 km from the second section and 1.47 km from the last downstream section) has an old run-of-river barrage used for hydropower production; its dimensions were obtained from the dam design plans (Figure 3).
The topography of the study area (Figure 3) was ob-tained by combining two sources of data: (a) topographic maps supplied by the Companhia de Saneamento de Alagoas (CASAL) with equidistant contours at 1 m interval (scale 1:2000) in the
lood-prone area; and (b) altimetry given by the Digital Elevation
Model (DEM) TOPODATA, provided by the Instituto Nacional de Pesquisas Espaciais (INPE), with interpolated spatial resolution 30 m and data corrected by the DEM SRTM (spatial resolution 90 m). The DEM data were used only for sites distant from the
lood-plain, where no CASAL topographic data were available.
The topographic-bathymetric sections were extended
beyond the lood-plain using the DEM information. Some difference could be seen between the data resulting from ield
survey and those derived from DEM, mainly for the river-bed. The average difference was about 12%. Combining DEM data with topographic and bathymetric data improves the quality of results (CASAS et al., 2006).
All pre-processing for HEC-RAS (deinition of trans -verse sections, channel and margens, geometric data) used the ArcGIS software extension HEC-GeoRAS 4.3.
The roughness coeficient was the only parameter ca -librated in the model HEC-GeoRAS, because of its sensitivity
to hydraulic conditions. The Manning roughness coeficient was itted manually, using as a starting point the reference values given
by Chow (1959). Brunner (2010) recommended measurements
or satellite images which deine the looded area for use when calibrating this parameter. In this paper, lood marks from the June 2010 lood were used (36 marks surveyed in the ield using
GPS) to calibrate the hydraulic model. This survey was restricted to the river’s left bank in the city of Rio Largo, because there is
HRU
Wm
b
Kbas
Kint
XL
CAP
Wc
Block 1
60.1
0.50
3.80
14.27
0.00
0.00
0.90
Block 2
50.4
0.37
3.89
10.97
0.10
0.00
0.50
Block 3
60.2
0.38
5.84
14.70
0.10
0.00
0.03
Block 4
1370.9
0.26
3.77
52.60
0.70
0.00
0.60
Block 5
1363.8
0.28
3.88
48.00
0.70
0.00
0.60
Block 6
260.2
0.34
7.86
72.93
0.10
0.00
1.20
Monte et al.: Hydrological and hydraulic modelling applied to the mapping of lood-prone areas
no urbanisation on the opposite bank. The upstream boundary
condition was the low estimated from the stage-discharge curve for the event of June 2010. The downstream boundary condi
-tion was the low estimated from Manning’s equa-tion, where
the channel slope was obtained using the resulting DEM. The quality of the hydraulic model’s calibration was assessed using
the coeficient of determination (R²), the root mean squared error (RMSE) and the coeficient of variation of mean squared
error (CV (RMSE)) between observed and simulated water-levels. It was not possible to use the indicators of calibration quality recommended by Sarhadi, Soltani and Modarres (2012) because
the limits of the looded area could not be deined using the lood marks surveyed in the ield.
Maps of looded areas for different return periods were generated for two conditions of estimated upstream low: (a) maximum lows generated by itting the GEV distribution; and (b) maximum lows generated by the hydrological model
using estimated maximum rainfalls for different return periods (TR). Thus possible differences were explored that might have
resulted from different methods of deining maximum lows (ROGGER et al., 2012). The return periods for maximum lows
are the same as those for maximum rainfalls. Agreements between
looded areas given by different low estimates (determimistic
and stochastic) were evaluated by comparing them and by means of the equation Fit (1) (BATES et al., 2006; BATES; DE ROO, 2000; SARHADI; SOLTANI; MODARRES, 2012):
(1)
���(%) = ( Aom
Ao+Am−Aom) × 100
where: Fit is the percentage of convergence between two
gene-rated areas, Ao is the area of looding generated using stochastic
lows (the GEV distribution) and Am is the area of looding
generated using deterministic lows (from the hydrological
model), Aom is the intersection of of looded areas from the two boundary conditions. Values near 100% indicate good correspondence between the areas, and values near 0% low correspondence between them.
RESULTS
Frequency Analyses of Flows and Maximum Rainfalls
The non-parametric Mann-Whitney test for homogeneity
of medians showed that the rainfall series and the series of lows
at Fazenda Boa Fortuna bore no evidence of trends arising from local climate changes and/or extreme clmatic events, indicating that the series came from the same population.
The results from the Kologorov-Smirnov test showed that all 31 raingauge sites were well represented by the GEV
distribution, at the 0.05 signiicance level.
Having used the tests for homogeneity and adherence, return periods were estimated for each rainfall record and for
the low record from Fazenda Boa Fortuna (Figure 4). At the low-gauging site, low estimated from the stage-discharge curve for the lood of June 2010 was 1233 m³/s (recorded water level
11.50 m), which corresponds to a return period of roughly 200 years (Figure 4).
RBRH vol. 21 no.1 Porto Alegre jan./mar. 2016 p. 152 - 167
Hydrological Modeling
Values of goodness-of-it criteria in calibration and
validation periods of the hydrological model are given in Tables
4 and 5 respectively. The model performed best at downstream sites in the basin (397400000, 397600000 and 397700000). The poorest results were in the basin headwaters (397000000 and
397200000). The best it was obtained at Fazenda Boa Fortuna
(397700000), the section used as upstream boundary condition
for the hydraulic model. For this site, the it to the time-series for the year 2000 (a year when looding occurred) and for the
whole series, is shown in Figures 5 e 6 respectively.
After model had been calibrated and validated,
maxi-mum lows were estimated for different return periods at the cross-section Fazenda Boa Fortuna for comparison with lows
estimated from the GEV distribution (Table 6). Comparison between the two methods shows that their values were similar up to a return period of 200 years (maximum difference 16%), with values estimated from the GEV distribution being greater
than lows estimated from the hydrological model. This pattern
was reversed at higher return periods. It is emphasized that in this region the uncertainties in the stochastic estimates are greater because they lie in the extrapolated part of the frequency
distri-Δ
Code Site NS NSlog ΔV(%)
397000000 Santana do Mundaú 0.65 0.94 -19
397200000 São José da Laje -1.55 0.92 118
397400000 União dos Palmares 0.68 1.00 73
397600000 Murici-Ponte 0.76 1.00 20
397700000 Fazenda Boa Fortuna 0.81 0.45 12
Δ
Δ
Di
sc
ha
rg
e
(m³
/s
)
Δ
Δ
Δ
Code Site NS NSlog ΔV (%)
397000000 Santana do Mundaú 0.48 0.89 -48
397200000 São José da Laje -1.73 0.91 96
397400000 União dos Palmares 0.75 1.00 0
397600000 Murici-Ponte 0.87 1.00 -1
397700000 Fazenda Boa Fortuna 0.74 0.47 3
Di
sc
ha
rg
e
(m³
/s
)
Table 4 - Values of objective functions for the hydrological model calibration period (NS – Nash-Sutcliffe, NSlog – Nash-Sutcliffe using logs, ΔV – Difference in volume)
Table 5 - Values of objective functions for the hydrological model validation period (NS – Nash-Sutcliffe, NSlog – Nash-Sutcliffe using logs, ΔV – Difference in volume)
TR Flow (GEV) (m³/s) Flow from model (m³/s) % difference
2 years 403.9 367.12 9.11
5 years 634.8 537.13 13.38
10 years 773.1 650.24 15.89
25 years 932.7 801.89 14.02
50 years 1041 926.86 10.96
100 years 1141 1066.19 6.56
200 years 1233 1236.78 -0.31
500 years 1345 1593.09 -18.45
1000 years 1422 1864.29 -31.10
Table 6 - Comparison of lows estimated from the GEV distribution and from the hydrological model.
Δ
ΔV
Δ
Δ
Theoretical probability
Empirical probability
Return period (year)
Di
sc
ha
rg
e
(m³
/s
)
F
lo
w
(
m
³/s
)
Monte et al.: Hydrological and hydraulic modelling applied to the mapping of lood-prone areas
)
Figure 5 – Comparison of observed and simulated lows for the year 2000, when a lood event occurred
RBRH vol. 21 no.1 Porto Alegre jan./mar. 2016 p. 152 - 167
bution, so that estimates derived from physical considerations are to be preferred.
Hydraulic Modelling
The simulated looded area and the lood marks surveyed in the ield for the June 2010 event are shown in Table 7. In
general, the hydraulic model performed well (R² = 0.99, RMSE = 1.41 m and CV (RMSE) = 0.04), as shown by comparison
of observed and simulated water-levels. However there were some points of divergence at sites near where the city begins, in the central area and in the lower part (from upstream to downstream). The mean and median differences in location in
the horizontal plane between lood marks and simulated lood
Monte et al.: Hydrological and hydraulic modelling applied to the mapping of lood-prone areas
area were 1284 m and 9.34 m respectively. The mean and median differences between observed and simulated water-levels were around 1.22 m and 0.93 m, respectively.
Mapping of flood-prone areas
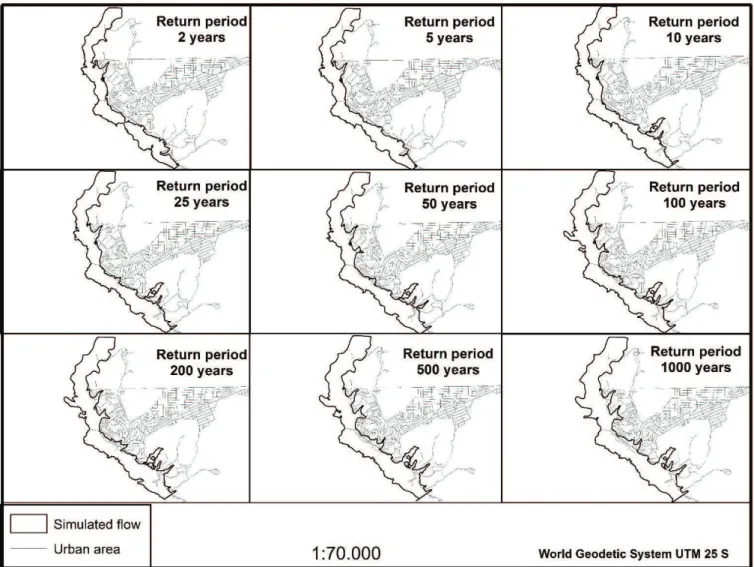
Using the hydraulic model, looded areas were obtained with lows generated by the hydrological model (Figure 8) and by
the GEV distribution. Flows with return periods greater than 50
years gave rise to looded areas mainly in the middle and lower
parts of the reach. These areas are residential, commercial, or are used for the city’s public and private services (Table 8).
Differences betwen looded areas obtained using diffe
-rent types of low (deterministic or stochastic) were measured
by the statistic Fit. Good correspondence is seen (greater than
92%) between looded areas found when different methods of estimating upstream low are used (Table 9).
Sections Left bank Channel Right bank
Fazenda Boa Fortuna 0.14 0.14 0.14
Bridge 0.17 0.17 0.17
Pre-Barrage 0.17 0.17 0.17
Slope post- 0.15 0.07 0.15
Barrage 0.15 0.07 0.15
Table 8 - Flooded urban area for different return periods (Note: urban area of Rio Largo:
Table 7 - Values of the Manning coeficient for the Rio Mundaú reach lowing through the Rio Largo township (sections from upstream to downstream).
Figure 8 - Mapping of areas susceptible to looding for different return times estimated through the coupling model Hydrological
RBRH vol. 21 no.1 Porto Alegre jan./mar. 2016 p. 152 - 167
DiSCUSSiOn
Analyses of Extreme Statistics
The GEV probability distribution itted to rainfall and low data was found to be robust and applicable to the region,
with good agreement with the empirical distribution shown by
goodness-of-it and non-parametric tests. This is conirmed
by other hydrometeorological and hydrological studies that used the GEV for the distribution of maxima (KATZ; PAR-LANGE; NAVEAU, 2002; NAUMANN; LLANO; VARGAS, 2012; NORBIATO et al., 2007; TRAMBLAY et al., 2012). The Mann-Whitney test did not detect any change in rainfall
characteristics. However, it is dificult to identify trends when
historic records are short (< 30 years), as in the present study
(NAGHETTINI; PINTO, 2007). Estimates of low obtained by
probability distribution also have limitations resulting from the shortness of historic record. For return periods of 500 years or
more, estimates of low given by the GEV distribution differ from low estimates given by the hydrological model which used
maximum design rainfalls as input. A number of studies have shown that estimates generated from probability distributions are of limited reliability when estimated by extrapolation of
the frequency curve (KATZ; PARLANGE; NAVEAU, 2002;
ROGGER et al., 2012). On the other hand, lows estimated
from the model may be over-estimated, particularly for large return periods, when it is recalled that in design conditions the intense rainfall is assumed to fall over the entire drainage basin (GRIMALDI et al., 2013) whilst the relation between return
periods for rainfall and for low was not explored (VIGLIO -NE; BLÖSCHL, 2009; VIGLIO-NE; MERZ; BLÖSCHL,
2009). Even so, the areas looded by different lows were not
markedly different, probably as a consequence of the region’s
topography (the lood-plain is narrow), which does not result in large changes to the looded area when lows are increased.
Hydrological Modelling
The hydrological model did not simulate lows very
well at upstream sites in the basin, probably because areas ups-tream of such sites were small (the gauging station 397000000 drains an area 762.70 km² with perimeter 74.27 km; the station 397200000 drains an area 1182.86 km² with perimeter 117.87 km), and the hydrological responses to intense rainfall are more rapid at these locations because the geology consists of
crys-Table 8 - Flooded urban area for different return periods
TR Flooded urban área (km²) % Flooded urban area
2 years 0.25 1.42
5 years 0.29 1.65
10 years 0.35 1.99
25 years 0.39 2.21
50 years 0.46 2.61
100 years 0.51 2.89
200 years 0.55 3.12
500 years 0.63 3.58
1000 years 0.65 3.69
TR Area, GEV-estimated flow (km²)
Area, flow estimated from model (km²)
Statistic
Fit (%) 2 years 1.58 1.55 97.57 5 years 1.75 1.69 95.88 10 years 1.88 1.81 95.20 25 years 2.02 1.91 93.35 50 years 2.11 2.01 94.86 100 years 2.19 2.14 96.76 200 years 2.23 2.24 99.46 500 years 2.28 2.41 94.61 1000 years 2.33 2.51 92.19
Table 9 - Goodness of it between looded areas generated by lows from the GEV distribution, and from the hydrological model
Monte et al.: Hydrological and hydraulic modelling applied to the mapping of lood-prone areas
talline rocks overlain by shallow soils, with limited capacity to
retain iniltrated water. Furthermore, the upper and middle part
of the basin is a climatic transition zone between the semi-arid and tropical litoral. This may explain the unsatisfactory values of objective functions at these gauging stations.
Earlier studies have shown that the MGB model does
not simulate mean daily lows well in basins with area less
than1500 km² (COLLISCHONN; COLLISCHONN; TUCCI, 2008; COLLISCHONN et al., 2007; PAIVA; COLLISCHONN;
BUARQUE, 2013; PAZ et al., 2011; RAJE; KRISHNAN, 2012).
However calibration and validation of the hydrological model at Fazenda Boa Fortuna (drained area more than 3.000 km²), above the Rio Largo township, was saisfactory and served the purpose of the present study. At this gauging site, the model did
not give a good it for low lows in the dry season (tending to over-estimate them), since the itting procedure was concentrated on the period of maximum lows, giving an explanation of the low-low result (ROGGER et al., 2012). However, giving priority to a period during itting may have contributed to a reduction
in performance measures. Thus the hydrological model should be used with caution in upstream sections of Rio Largo and
when modelling low-low conditions when calibration for an appropriate low-low period is to be recommended (PAIVA;
COLLISCHONN; BUARQUE, 2013).
Regarding the calibrated parameters, b, Wm, kbas were the most sensitive in calibration. The parameter b controlled the
shape of hydrograph peaks, giving better it to lood peaks. The
parameter Wm adequately represented the soil characteristics in the middle and lower parts of the basin (soils with greater
iniltration capacity). As the parameter Wc is associated with soil saturation capacity, it has an important role in representing lood events that are strongly inluenced by large volumes of surface runoff such as, for example, those occurring in the lood of June 2010 (OLIVEIRA; SOUZA; FRAGOSO JÚNIOR, 2014).
Hydraulic Modelling and the Mapping of Flood
-Prone Areas.
Despite some limitations, calibration of the hydraulic model was satisfactory for the aims of the study. Although the
exact boundary of the area looded in June 2010 was not known, the ield survey of lood marks gave a viable alternative in the
absence of more exact information such as, for example, Synthe-tic Aperture Radar (SAR) images, Airborne SyntheSynthe-tic Aperture Radar (ASAR) (BATES et al., 2006; BATES; DE ROO, 2000; SARHADI; SOLTANI; MODARRES, 2012), or aerial images or
ield surveys on the day of the event.The calibration resulted in values for the Manning roughness coeficient within the ranges
cited by CHOW (1959) and recommended by WARNER et al. (2010), and which were based on approximate values for the stream-bed and its margins. The mean and median differences in the horizontal and vertical, and the statistical results in the vertical, show some discrepancies which can nevertheless be considered reasonable in the light of of the other uncertainties in the study: such as, for example, the age of the topographical maps, the absence of a Digital Surface Model (DSM) to better interpret results in the urbanised area, small errors inherent in
map digitization, and the accuracy of GPS for deining points of the 2010 lood. It is also important to note that the section
at Fazenda Boa Fortuna was subject to two major changes in its
geometry over 10 years, mainly during the loods of 2000 and
2010. Alterations to the hydraulic characteristics of a transverse
section when a lood passes modiies low characteristics in the
reach being simulated (DI BALDASSARRE; MONTANARI, 2009). It is recommended that the input data to the hydraulic
model be updated whenever a lood passes or when artiicial
alterations occur (reservoir construction, canalization). The to-pography of the urban area of the city of Rio Largo was based on topographic maps provided by CASAL and which may give rise to two problems: (a) information could be out of date (the survey was dated 1978) and not representative of topographic changes that have occurred since; and (b) some areas do not have levels, which may give rise to uncertainties in the survey
value at some locations. For a better description of lood areas
at the building-lot scale, a more detailed information set would need a DSM capable of identifying the tops of constructions and of trees, at spatial resolution not greater than 1 m (for example, a surface generated by LiDAR), together with information on building-lots and a dense network of topographic-bathymetric sections (CASAS et al., 2006). Because of the absence of such
reined data, modelling did not represent the lood of 2010
particularly well in some areas at the outskirts and centre of
the city; this could result in technical and inancial costs if the
modelling system were to be used operationally (BORGA et
al., 2010). In general, no large differences in looded area were observed for loods of different return periods, because of steeply sloping land which constrained loods topographically
in the reach that was studied. Despite the various limitations of
data and the simpliications adopted, such as the small number of topgraphic-bathymetric sections available, the dificulty of
integrating topographic maps of the region with the DEM
TOPODATA, the limited information available on lood extent and the effect of building-lots (areas with greatly modiied ru
-noff) on lood extent, the statistical estimates suggest that the
hydraulic model was not greatly in error as a representation of
the 2010 lood.
COnCLUSiOnS
To apply frequency analysis to records of local daily rainfall as input data to the rainfall-runoff model, it was neces-sary for the hydrological model’s parameterization to be derived
from extreme lows. The hydrological model showed that it could represent well the lood events in the city of Rio Largo. Results showed that the model experienced some dificulty when maximum lows were simulated in drainage areas less than 1500
km², even with attempts to improve parameterization through
calibration based on maximum lows. Flow from such areas
responds rapidly with time of concentration less than a day, and they lie in a region with but one soil horizon and a geology of crystalline rock. Hence, it is recommended that simulations of such areas use a time-interval of one hour, whilst recognizing
RBRH vol. 21 no.1 Porto Alegre jan./mar. 2016 p. 152 - 167
always available at an hourly time-scale.
Coupling the models allowed the estimated looded
area to be mapped, thus providing a channel of information
for mitigating actions to limit lood damage or to provide lood warnings in circumstances where there is suficient lead-time
for forecasting to be useful (knowledge of future rainfall, or data-collection in real time) and for comparing the extent of
looded zones with their estimated extent, thus reducing possible
socio-economic damage. It should also be noted that coupling models can be considered a promising methodology in locations where data sequences are short and/or not long enough for a local frequency analysis, needing at least one event in the cali-bration period and another in the validation period. Locations
in the Rio Largo township where loods recur more frequently
include agricultural areas gowing sugar-cane, old residential areas, areas of new construction and the city’s main commercial area.
Calibration of the hydraulic model used lood marks
from the 2010 event which may neverthless be subject to errors, being in effect no more than a qualitative survey of the location; however they were found to be useful and indeed necessary in the absence of anything better. However, aerial or satellite
images are recommended as a better alternative for deining an area under lood. The use of a more detailed DSM would also result in improved maps of urban looded areas.
ACKnOwLEDgEMEnTS
We are grateful to institutional grants provided by The Swedish Foundation for International Cooperation in Research and Higher Education (STINT) through Research Links Pro-ject, which funded the international cooperation between Lund University and Federal University of Alagoas and to the Swedish
Research Council (Vetenskapsrådet) that partially inances C. B.
Uvo. The third author would like to thank CAPES Foundation, Ministry of Education of Brazil by the scholarship granted in the process nº BEX 13470/13-2.
REFEREnCES
ALAGOAS; PNUD; OAS. Diagnóstico da região das Bacias dos Rios Mundaú e Paraíba. Maceió, AL: Governo do estado de Alagoas, 1990.
BALDASSARRE, G. DI.; MONTANARI, A. Uncertainty in river discharge observations: a quantitative analysis. Hydrology and Earth System Sciences, v. 13, n. 6, p. 913–921, Jun. 2009.
BALLESTEROS, J. A.; BODOQUE, J. M.; DÍEZ-HERRERO,
A.; SANCHEZ-SILVA, M.; STOFFEL, M. Calibration of
loodplain roughness and estimation of lood discharge based on
tree-ring evidence and hydraulic modelling. Journal of Hydrology,
v. 403, n. 1-2, p. 103–115, Jun. 2011.
BATES, P. D.; WILSON, M. D.; HORRITT, M. S.; MASON,
D. C.; HOLDEN, N.; CURRIE, A. Reach scale loodplain
inundation dynamics observed using airborne synthetic aperture radar imagery: Data analysis and modelling. Journal of Hydrology, v. 328, n. 1-2, p. 306–318, Ago. 2006.
BATES, P.D.; ROO, A. P. DE. A simple raster-based model
for lood inundation simulation. Journal of Hydrology, v. 23, n. 1-2, p. 54–77, Set. 2000.
BONNIFAIT, L.; DELRIEU, G.; LAY, M. LE; BOUDEVILLAIN, B.; MASSON, A.; BELLEUDY, P.; GAUME, E.; SAULNIER, G. M. Distributed hydrologic and hydraulic modelling with radar rainfall input: Reconstruction of the 8–9 September 2002
catastrophic lood event in the Gard region, France. Advances in Water Resources, v. 32, n. 7, p. 1077–1089, Jul. 2009.
BORGA, M.; ANAGNOSTOU, E. N.; BLÖSCHL, G.;
CREUTIN, J.-D. Flash loods: Observations and analysis of
hydro-meteorological controls. Journal of Hydrology, v. 39, n. 1-2, p. 1–3, Nov. 2010.
BRUNNER, G. W. HEC-RAS, River Analysis System: User’s manual. Davis, CA: US Army Corps of Engineers, 2010. 766 p. Available at: http://www.hec.usace.army.mil/software/hec-ras/ documentation/HEC-RAS_4.1_Users_Manual.pdf. Accessed at August 07, 2013.
CASAS, A.; BENITO, G.; THORNDYCRAFT, V. R.; RICO, M. The topographic data source of digital terrain models as a
key element in the accuracy of hydraulic lood modelling. Earth Surface Processes and Landforms, v. 31, n. 4, p. 444–456, Mar. 2006.
CHAVES, M. B. Modelagem e previsão de áreas de inundação no município de Rio Largo/AL. 2013. 63 f. Undergraduate Dissertation, Center for Technology, Federal University of Alagoas, Alagoas, 2013.
CHORMANSKI, J.; OKRUSZKO, T.; IGNAR, S.; BATELAAN, O.; REBEL, K. T.; WASSEN, M. J. Flood mapping with remote
sensing and hydrochemistry: A new method to distinguish the
origin of lood water during loods. Ecological Engineering, v.
37, n. 9, p. 1334–1349, Set. 2011.
CHOW, V. T. Open Channel Hydraulics. Tokyo: McGraw Hill, 1959. 680 p.
COLLISCHONN, B.; COLLISCHONN, W.; TUCCI, C. E. M. Daily hydrological modeling in the Amazon basin using TRMM rainfall estimates. Journal of Hydrology, v. 360, n. 1-4, p. 207–216, Out. 2008.
COLLISCHONN, W.; ALLASIA, D.; SILVA, B. C. DA.; TUCCI, C. E. M. The MGB-IPH model for large-scale rainfall-runoff modelling. Hydrological Sciences Journal, v. 52, n. 5, p. 878–895, Mai. 2007.
Monte et al.: Hydrological and hydraulic modelling applied to the mapping of lood-prone areas
DMITRIEVA, T. G.; PESKOV, B. E. Numerical forecast with
the mesosynoptic speciication of extremely severe squalls in the European part of Russia (Case study for June 13 and July
29, 2010). Russian Meteorology and Hydrology, v. 38, n. 2, p. 71–79, Fev. 2013.
EM-DAT: THE INTERNATIONAL DISASTER DATABASE/ CENTRE FOR RESEARCH ON THE EPIDEMIOLOGY OF DISASTERS – CRED. Disaster proile. Available at: http://
www.emdat.be/disaster_proiles/index.html. Accessed at August
03, 2015
FRAGOSO JÚNIOR, C. R.; PEDROSA, V. A.; SOUZA, V. C. B. Relexões Sobre a Cheia de Junho de 2010 nas Bacias do Rio
Mundaú e Paraíba. In: SIMPÓSIO DE RECURSOS HÍDRICOS DO NORDESTE, 10., 2010, Fortaleza. Proceedings of X Simpósio Brasileiro de Recursos Hídricos do Nordeste, Porto Alegre: ABRH, 2010.
GAMA, W. M. Impactos das mudanças climáticas na resposta hidrológica da bacia hidrográica do rio Paraíba do Meio. 2011. 112 f. Master Dissertation. Center for Technology, Federal University of Alagoas., Alagoas, 2011.
GRIMALDI, S.; PETROSELLI, A.; ARCANGELETTI, E.; NARDI, F. Flood mapping in ungauged basins using fully continuous hydrologic–hydraulic modeling. Journal of Hydrology, v. 487, n. n/d, p. 39–47, Abr. 2013. Disponível em: http://dx.doi. org/10.1016/j.jhydrol.2013.02.023. Acesso em: 09 ago. 2013.
GRUBBS, F.E; BECK, G. Extension of sample sizes and
percentage points for signiicance tests of outlying observations.
Technometrics, v. 14, n. 4, p. 847-854, Nov. 1972.
HARDY, R. J.; BATES, P. D.; ANDERSON, M. G. The importance of spatial resolution in hydraulic models for loodplain
environments. Journal of Hydrology, v. 216, n. 1-2, p. 124–136, Mar. 1999.
HORRITT, M. S.; BATES, P. D. Predicting loodplain inundation: raster-based modelling versus the inite-element approach.
Hydrological Processes, v. 15, n. 5, p. 825–842, Mar. 2001.
HORRITT, M. S.; BATES, P. D.; MATTINSON, M. J. Effects of mesh resolution and topographic representation in 2D inite volume models of shallow water luvial low. Journal of Hydrology, v. 329, n. 1-2, p. 306–314, Set. 2006.
HOSKING, J. R. M.; WALLIS, J. R.; WOOD, E. F. Estimation
of the generalized extreme value distribution by the method of probability weighted moments. Technometrics, v. 27, n. 3, p. 251–261, Ago. 1985.
KATZ, R. W.; PARLANGE, M. B.; NAVEAU, P. Statistics of extremes in hydrology. Advances in Water Resources, v. 25, n. 8-12, p. 1287–1304, Ago./Dez. 2002.
KOUTSOYIANNIS, D.; BALOUTSOS, G. Analysis of a Long Record of Annual Maximum Rainfall in Athens, Greece, and Design Rainfall Inferences. Natural Hazards, v. 22, n. 1, p.
29–48, Jul. 2000.
KOUWEN, N.; SOULIS, E. D.; PIETRONIRO, A.; DONALD, J.;
HARRINGTON, R. A. Grouped Response Units for Distributed Hydrologic Modeling. Journal of Water Resources Planning and Management, v. 119, n. 3, p. 289–305, Mai. 1993.
NAGHETTINI, M.; PINTO, E. J. A. Hidrologia Estatística. Belo Horizonte, MG: CPRM, 2007. 552 p.
NAUMANN, G.; LLANO, M. P.; VARGAS, W. M. Climatology of the annual maximum daily precipitation in the La Plata Basin. International Journal of Climatology, v. 3, n. 2, p. 247–260, Fev. 2012.
NICHOLAS, A. P.; WALLING, D. E. Modelling lood hydraulics and overbank deposition on river loodplains. Earth Surface Processes and Landforms, v. 2, n. 1, p. 59–77, Jan. 1997.
NORBIATO, D.; BORGA, M.; SANGATI, M.; ZANON, F. Regional frequency analysis of extreme precipitation in the
eastern Italian Alps and the August 29, 2003 lash lood. Journal of Hydrology, v. 345, n. 3-4, p. 149–166, Out. 2007.
OLIVEIRA, D.L.; SOUZA, V. C. B.; FRAGOSO JÚNIOR, C.
R. Análise hidrológica da cheia excepcional ocorrida em junho de 2010 nas Bacias dos Rios Mundaú e Paraíba do Meio em Alagoas e Pernambuco. RBRH: Revista Brasileira de Recursos
Hídricos, v. 19, n. 3, p. 279-293, Jul./Set. 2014.
PAIVA, R. C. D.; COLLISCHONN, W.; BUARQUE, D. C. Validation of a full hydrodynamic model for large-scale hydrologic modelling in the Amazon. Hydrological Processes, v. 27, n. 3, p.
333–346, Jan. 2013.
PAZ, A. R. DA.; COLLISCHONN, W.; TUCCI, C. E. M.;
PADOVANI, C. R. Large-scale modelling of channel low and loodplain inundation dynamics and its application to the
Pantanal (Brazil). Hydrological Processes, v. 25, n. 9, p. 1498–1516, Abr. 2011.
RABER, G. T.; JENSEN, J. R.; HODGSON, M. E.; TULLIS, J. A.; DAVIS, B. A.; BERGLUND, J. Impact of Lidar Nominal
Post-spacing on DEM Accuracy and Flood Zone Delineation. Photogrammetric Engineering & Remote Sensing v. 73, n. 7, p. 793–804,
Jan. 2007.
RAJE, D.; KRISHNAN, R. Bayesian parameter uncertainty
modeling in a macroscale hydrologic model and its impact on Indian river basin hydrology under climate change. Water Resources Research, v. 48, n. 8, p. 1-17, Ago. 2012.
ROGGER, M.; KOHL, B.; PIRKL, H.; VIGLIONE, A.;
RBRH vol. 21 no.1 Porto Alegre jan./mar. 2016 p. 152 - 167
estimation in Austria – Do they tell a consistent story? Journal of Hydrology, v. 456-457, n. n/d, p. 30–43, Ago. 2012.
SANDERS, B. F. Evaluation of on-line DEMs for lood
inundation modeling. Advances in Water Resources, v. 30, n. 8, p. 1831–1843, Ago. 2007.
SAF, B. Assessment of the effects of discordant sites on regional
lood frequency analysis. Journal of Hydrology, v. 380, n. 3-4, p.
362–375, Jan. 2010.
SARHADI, A.; SOLTANI, S.; MODARRES, R. Probabilistic
lood inundation mapping of ungauged rivers: Linking GIS
techniques and frequency analysis. Journal of Hydrology, v. 458-459, n. n/d, p. 68–86, Ago. 2012.
SARTORI, A.; GENOVEZ, A. M.; NETO, F. L. Classiicação
Hidrológica de Solos Brasileiros para a Estimativa da Chuva
Excedente com o Método do Serviço de Conservação do Solo dos Estados Unidos Parte 2: Aplicação. RBRH: Revista Brasileira de Recursos Hídricos. v. 10, n. 4, p. 19–29, Out./Dez. 2005.
SARTORI, A.; NETO, F. L.; GENOVEZ, A. M. Classiicação
Hidrológica de Solos Brasileiros para a Estimativa da Chuva
Excedente com o Método do Serviço de Conservação do Solo dos Estados Unidos Parte 1: Classiicação. RBRH: Revista Brasi-leira de Recursos Hídricos, v. 10, n. 4, p. 5–18, Out./Dez. 2005.
SRINIVAS, C. V.; HARIPRASAD, D.; BHASKAR RAO, D. V.;
ANJANEYULU, Y.; BASKARAN, R.; VENKATRAMAN, B.
Simulation of the Indian summer monsoon regional climate using advanced research WRF model. International Journal of Climatology, v. 33, n. 5, p. 1195–1210, Abr. 2013.
SURIYA, S.; MUDGAL, B. V. Impact of urbanization on loo -ding: The Thirusoolam sub watershed – A case study. Journal of Hydrology, v. 412-413, n. n/d, p. 210–219, Jan. 2012.
TRAMBLAY, Y.; BADI, W.; DRIOUECH, F.; ADLOUNI, S. EL; NEPPEL, L.; SERVAT, E. Climate change impacts on extreme precipitation in Morocco. Global and Planetary Change, v. 82-83, n. n/d, p. 104–114, Fev. 2012.
TRAPERO, L.; BECH, J.; LORENTE, J. Numerical modelling
of heavy precipitation events over Eastern Pyrenees: Analysis of orographic effects. Atmospheric Research, v. 123, n. n/d, p. 368–383, Abr. 2013.
TRIOLA, M. Introdução a estatística. Rio de Janeiro, RJ: LTC, 2008. 722 p.
TUCCI, C. E. M. Inundações urbanas. Porto Alegre, RS: ABRH/ RHAMA, 2007. 389 p.
VIGLIONE, A.; BLÖSCHL, G. On the role of storm duration
in the mapping of rainfall to lood return periods. Hydrology and Earth System Sciences, v. 13, n. 2, p. 205–216, Fev. 2009.
VIGLIONE, A.; MERZ, R.; BLÖSCHL, G. On the role of the
runoff coeficient in the mapping of rainfall to lood return
periods. Hydrology and Earth System Sciences Discussions, v. 6, n. 1,
p. 627–665, Jan. 2009.
WARNER, J. C.; BRUNNER, G. W.; WOLFE, B. C.; PIPER,
S. S. HEC-RAS, River Analysis System: Applications Guide – Version 4.10. Davis, CA: US Army Corps of Engineering, 2010. Available at: http://www.hec.usace.army.mil/software/ hec-ras/documentation/HEC-RAS_4.1_Applications_Guide. pdf. Accessed at August 07, 2013.
Author contribution statement:
Benício Emanoel Omena Monte: Study conception and design, Acquisition of data, Hydrological Simulation, Hydraulic Simulation, Analysis and interpretation of data, Drafting of manuscript and Critical revision.
Denis Duda Costa: Acquisition of data, Hydraulic Simulation, Analysis and interpretation of data, Drafting of manuscript and Critical revision.
Louis Fillipi de Oliveira Magalhães: Acquisition of data, Hydraulic
Simulation, Analysis and interpretation of data.
Mahelvson Bazilio Chaves: Acquisition of data, Hydrological Simulation and Hydraulic Simulation.