Microstructural Stability of a Niobium Single Crystal Deformed by Equal Channel Angular
Pressing
Heide Heloise Bernardia,b*, Hugo Ricardo Zschommler Sandima, Kahl Dick Zilnykc, Bert Verlindend,
Dierk Raabee
Received: March 15, 2017; Revised: June 13, 2017; Accepted: June 20, 2017
A [211]-oriented niobium single crystal was deformed by equal channel angular pressing (ECAP) at room temperature using the route Bc to a total strain of 9.2. A sharp cube texture develops after ECAP processing. The deformed samples were annealed in vacuum from 400ºC (673 K) to 900ºC (1173 K) for 1 h to evaluate their microstructural stability. Scanning electron microscopy (SEM) was used to image the microstructures of as-deformed and annealed specimens. Electron backscatter
difraction (EBSD) was employed to determine the respective microtextures before and after annealing.
Coarsening of the microstructure occurs at a maximum rate at 550ºC (823 K) due to discontinuous recrystallization. Normal grain growth replaces discontinuous recrystallization as the main coarsening mechanism above 700ºC (973 K).
Keywords: Niobium, recrystallization, grain growth, ECAP, EBSD
* e-mail: [email protected]
1. Introduction
Niobium is an important material for several engineering applications in many environments and within a wide range of temperatures. It has a body-centered cubic (BCC) structure and displays interesting properties such as a very high melting point combined with modest mass density, high ductility, good biocompatibility, and good corrosion resistance. However, high-purity niobium is very soft which hinders its application in many situations where higher mechanical strength is needed and alloying must be avoided. Grain
reinement provided by severe plastic deformation (SPD)
techniques such as equal channel angular pressing (ECAP) is a suitable alternative to increase its mechanical strength.
ECAP (also termed ECAE - Equal Channel Angular
Extrusion) promotes intensive microstructural reinement, yielding materials with grain sizes below 1 µm
(ultraine-grained structure) and unique mechanical properties. This
SPD technique has been gaining more importance and it is
already performed on industrial scale to yield high-strength materials such as precipitation-hardening aluminum alloys for aerospace applications1 and more recently unalloyed
titanium for orthopedic implants2. First industrial applications
of SPD technique was the manufacture of sputtering targets.
Materials such as aluminum, copper and titanium high purity,
with submicron grain sizes deformed by ECAP, are being applied in the electronics industry as sputtering targets1,3,4.
The microstructural reinement is accomplished by
severe plastic deformation during multiple passes5. During
ECAP, a billet is pressed through a die with two intersecting
channels of the same cross section that meet at an angle φ6-8.
The predominant deformation mechanism is simple shear and occurs parallel to the intersecting plane of the channels9-11.
A comprehensive review about this technique can be found elsewhere8.
The formation of ultraine-grained (UFG) structures
during ECAP requires the creation of a large fraction of high angle boundaries (HAB) within the deformed structure. Grain
reinement promotes the increase of the mechanical strength (Hall-Petch mechanism) in UFG materials. On the other
hand, most severely deformed materials exhibit low ductility and must be annealed to obtain an optimum balance of the mechanical properties12-14. Prangnell et al.15 have reported
that the presence of a signiicant fraction of HABs within the
deformation structure, e.g. > 70%, could lead to continuous recrystallization of the material, or grain growth, rather than discontinuous recrystallization16. Moreover, Humphreys et
al.17 have demonstrated that, in principle, a cellular structure
will become resistant to discontinuous growth when the volume fraction of high-angle grain boundaries is larger than about 70%.
aEscola de Engenharia de Lorena, Universidade de São Paulo (USP), 12600-970, Lorena, SP, Brazil
bFaculdade de Tecnologia de São José dos Campos, Prof. Jessen Vidal - FATEC-SJC, 12247,
São José dos Campos, SP, Brazil
cInstituto Federal de Educação, Ciência e Tecnologia de São Paulo, 18202-000, Itapetininga, SP, Brazil
dDepartment of Materials Engineering, Katholieke Universiteit Leuven 3001, Leuven, Belgium
The discussion about the exact value where continuous recrystallization displaces discontinuous recrystallization as the main softening mechanism in ECAP-processed materials is not the aim of the present work, also because these characteristics not only depends on the HABs, but also on other properties such as crystalline structure, composition, stacking fault energy (SFE), ECAP processing route, and so on. The knowledge of the underlying mechanisms responsible for the softening that occurs during isothermal annealing of ECAP-processed materials is essential to set the operating limits for their application at moderate-to-high temperatures; i.e. the evaluation of its microstructural stability. Nevertheless, most of the literature discusses the recrystallization behavior of face-centered cubic (FCC) materials, particularly Al, Cu,
and Ni. Only a few works report on the microstructural
evolution of body-centered cubic (BCC) during annealing so far18-22. In the case of BCC single crystals processed by
ECAP, in especial niobium single crystal23, the number of
reported studies is certainly even smaller.
This paper reports the main results about the annealing behavior of a niobium single crystal deformed by 8 ECAP passes using the route Bc to evaluate its thermal (microstructural) stability. Results show that the microstructure coarsens by discontinuous recrystallization in the range of 500oC-700oC
(773 K-973 K). Above this temperature, normal grain growth replaces discontinuous recrystallization as the main coarsening mechanism in ECAP-processed niobium.
2. Experimental
A niobium single crystal oriented with the [211] direction parallel to the punching direction was carefully cut out from a high-purity coarse-grained ingot processed by multiple
electron beam melting to get cylindrical billets with diameter of 12 mm and length of 50 mm. This particular orientation was obtained by coincidence. The chemical composition of this material is given in Table 1. The sample was processed at room temperature using the route Bc, for more details about processing are given in refs.23,24.
Table 1. Chemical composition of the niobium single crystal expressed in ppm-wt.
O N % C S
44 ± 42 < 30 64 ± 20 < 20
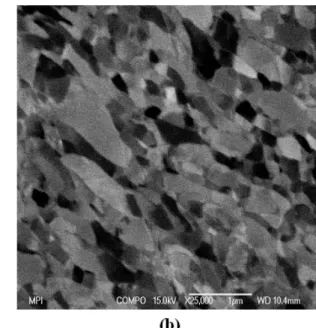
Figure 1. SEM micrographs of the niobium single crystal deformed by 8 ECAP passes (ND-TD section): (a) General view of the deformed structure and (b) Enlarged view of the rectangle show in (a). (ND: normal direction; TD: transversal direction).
As-pressed samples were cut out and annealed in vacuum from 400oC (673 K) to 900oC (1173 K) for 1 hour holding
time at each temperature to evaluate their thermal stability.
The microstructure was imaged using a JEOL-6500F ield
emission gun scanning electron microscope (FEG-SEM) operating at 15 kV. Microtexture and mesotexture data were obtained by automated acquisition and further indexing of
Kikuchi patterns after image processing in a TSL system interfaced to the SEM. All EBSD maps were carried out
in the central part of the specimens using a step size of
50 nm. Points with conidence index (CI) below 0.1 were
removed from the dataset. Vickers microhardness testing was performed in longitudinal and cross sections of the specimens using a load of 50 g for 30 s. Grain size and boundary spacing were determined by the linear intercept
method (ASTM E112). EBSD analyses and the grain size
(ASTM E112) were calculated in the transversal plane of the specimens, in other words, extrusion direction-normal
3. Results and Discussion
3.1. Deformation microstructure
The work hardening behavior of this niobium single crystal was evaluated by Vickers microhardness testing. Hardness varied from 78 ± 1 HV-0.05 (single crystal) to 139 ± 4 HV-0.05 after 8 ECAP passes. This pronounced work hardening can be explained by the multiplication and
interaction of dislocations during severe deformation. Details
of the as-worked microstructure of this particular Nb single crystal are given in ref.24.
Figure 1 shows the SEM micrograph of the cross section
(TD-ND) of the as-worked material after 8 ECAP passes.
The microstructure of heavily deformed materials can be described as being an aggregate of crystallites bounded by an unequal mixture of high and low angle boundaries. The
deformation structure consists of ine crystallites arranged
in a lamellar structure with sizes lower than 1 µm. This
microstructure results of pronounced reinement promoted
by ECAP as a result of the progressive subdivision of the
crystal and further boundary reinement9-11,25. The volume
fraction of HABs in ECAP-processed Nb after 8 passes was 48% and the average linear intercept distance between HABs was 0.33 ± 0.03 µm, after a standard cleaning procedure to remove non-indexed points24. Etter et al.26 and Reihanian
et al.27 have investigated the microstructure of high-purity
polycrystalline copper and aluminum deformed by ECAP using the same route Bc. The average intercept distance between HABs was 0.4 µm for copper and 0.38 µm for
aluminum. In spite of the diferences in terms of stacking
fault energy (SFE) of both metals, the results for niobium are rather similar in terms of the grain structure developed after 8 ECAP passes. Moreover, Pan et al.28 studying
commercial-purity niobium polycrystalline up to 8 ECAP passes using route E obtained an average grain size of 0.30 µm and the
volume fraction of HABs was 50%, amounts very consistent with those obtained in this study.
3.2. Annealing behavior
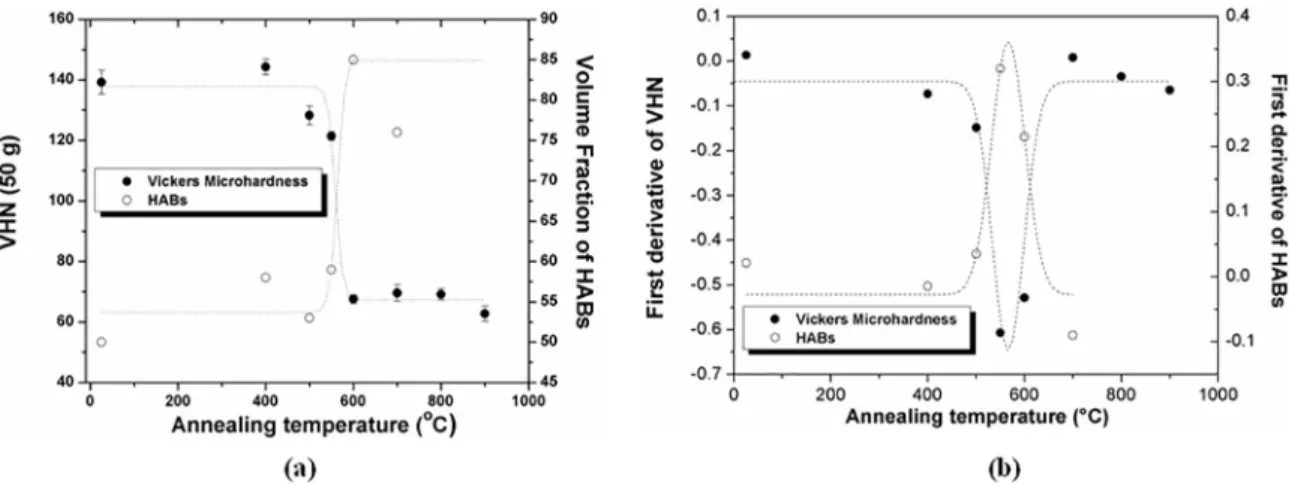
It is observed a softening pronounced between 500ºC (773 K) and 600ºC (873 K). This behavior is commonly found in materials such as undergoing discontinuous recrystallization.
The volume fraction of HABs increases signiicantly in that
temperature range. It reaches about 85% after annealing at 600oC (873 K) where discontinuous recrystallization is
almost complete. Therefore, the steep increase observed when the volume fraction of HABs is plotted against the annealing temperature (Figure 2a) as well the pronounced concurrent softening, can be attributed to the occurrence of
discontinuous recrystallization. HABs increase signiicantly
with temperature during annealing when recrystallization occurs in a discontinuous manner29. The volume fraction
of HABs in the as-deformed material is about 48%24. It
is worth mentioning that this large density of high-angle boundaries contributes to an increase in the stored energy in the deformed state, providing an additional driving force for grain coarsening. It is worth mentioning that the existing high angle grain boundaries act as additional excellent nucleation centers for primary recrystallization. According to the estimates made by several authors15,17, a volume fraction
of HABs less than about 70% promotes discontinuous recrystallization and competitive grain coarsening during annealing. Mathaudhu et al.20 report about the evolution
of the density of HABs in tantalum deformed by 4 ECAP passes (route Bc). This material is similar to niobium in certain properties30. It was observed that the tantalum billet
exhibited partial recrystallization, and this phenomenon occurred initially in the regions containing deformation inhomogeneities (banded areas).
Figure 2. (a) Changes in the volume fraction of high angle boundaries and softening behavior during one hour isothermal annealing in a niobium single crystal deformed by 8 ECAP passes and (b) First derivative of these microstructural properties to demonstrate that 550ºC (823 K) is the temperature where softening reaches a maximum due to discontinuous recrystallization. The dotted line represents
The irst derivatives of the data depicted in Figure 2 are
shown in Figure 2b. The maximum variation of the Vickers microhardness and volume fraction of HABs takes place at about 550ºC (823 K). These results match those obtained from quantitative metallography inspection revealing that microstructural coarsening becomes noticeable at this temperature. Below this temperature, the HAB spacing is rather constant. The measured HAB spacing for samples annealed within a large temperature range is shown in Table 2. We have included the HAB spacing determined both parallel
and perpendicular to the ED, to stress changes in grain shape. We ind that the grain aspect ratio varies from 6 to 3 in the
samples annealed for 1 h from 400oC (673 K) up to 550oC
(823 K), respectively. At higher annealing temperatures, the elongated microstructure evolves into an equiaxed grain structure with an aspect ratio of about 1.
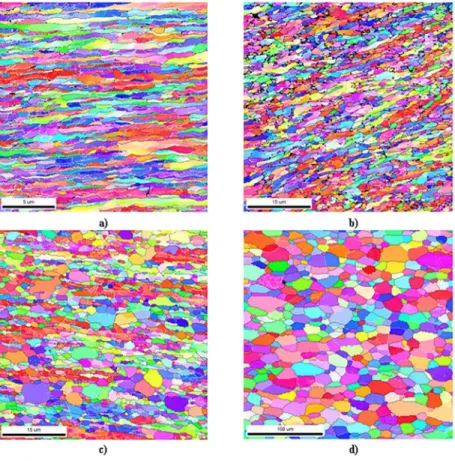
The EBSD analysis shows that diferent mechanisms
take place depending on the annealing temperature. At 400ºC (673 K) static recovery is the predominant softening
mechanism. The inverse pole igure (IPF) map of this sample
(Figure 3a) shows elongated grains, similar to those found in the as-deformed state. Between 500ºC (773 K) and 550ºC
(823 K) a signiicant fraction of recrystallized grains can be
seen in the microstructure (Figures 3b and 3c). Because of the high-purity of the single crystal and the large amount of strain due to ECAP processing, niobium undergoes primary (discontinuous) recrystallization already at a very low homologous temperature; i.e. at about 0.28Tm, where Tm is the melting point in Kelvin (2741 K). In the IPF maps, they appear as small, equiaxed grains contrasting with the elongated morphology of non-recrystallized areas in the microstructure. The presence of these lamellar structures resulting from severe plastic deformation is evident in some areas, i.e. recrystallization is incomplete. Another important feature is the presence of banded areas where recovered and recrystallized areas coexist in the annealed structure.
Normal grain growth occurs in the microstructure of samples annealed at 700oC (973 K) and above (Figure 3d).
An important microstructure feature at this temperature and above is that the grain aspect ratio approaches 1 (Table 2). The grain size distribution is rather broad, mirroring the coexistence of small grains not yet consumed by coarser ones in the annealed microstructure.
The grain orientation spread (GOS) is determined as the average diference in orientation between each pixel inside a
grain and the grain average orientation. Recrystallized grains
have lower GOS values than deformed grains as reported in
several papers31-35. In this work, a threshold value of 2.5o was
chosen to distinguish recrystallized and non-recrystallized grains. This threshold value is determined to distinguish a recrystallized grain from a recovered one, which implies
that grains with GOS < 2.5o are recrystallized31. The GOS
distributions of four samples (400ºC/673 K, 500ºC/773 K, 550ºC/823 K and 700ºC/973 K) are compared to each other
in Figure 4. A systematic trend of the reduction in the GOS
value for higher annealing temperatures can be noticed indicating the progress in microstructure restoration.
In a GOS map, all pixels within a grain are shaded with the same color. In the grain orientation spread (GOS) maps
corresponding to samples annealed at 500oC (773 K) and
550oC (823 K) (Figure 5a and 5b), the new recrystallized
grains appear as regions with lower values of orientation
spread. According to the GOS maps, the recrystallized volume
fraction in the samples annealed at 500ºC (773 K) and 550ºC (823 K) are about 35% and 61%, respectively. The increase in the volume fraction of recrystallized grains matches the
decrease in the fraction of LABs, since boundaries between
recrystallized grains are most HABs. This discrete change with increasing temperatures is evidence that discontinuous recrystallization is the predominant restoration mechanism within this temperature range. At 700ºC (973 K), where normal grain growth takes place, all grains are equiaxed
and display very low GOS values.
Figure 6 shows the misorientation angle distribution histograms for samples annealed for 1 h at 400oC (673 K),
550oC (823 K), and 700oC (973 K). The corresponding
percentages of HABs are 44%, 59% and 77%, respectively. These histograms also reveal that the volume fraction of low angle boundaries decreased with annealing. For comparison, the Mackenzie plot, representing the misorientation values of ideal randomly-textured polycrystals36, is also plotted. It
is worth mentioning that misorientation angle distributions do not take into account boundaries with misorientations
below 2º due to intrinsic limitations of the EBSD technique.
These boundaries can be only accounted for in a more precise manner by transmission electron microscopy (TEM).
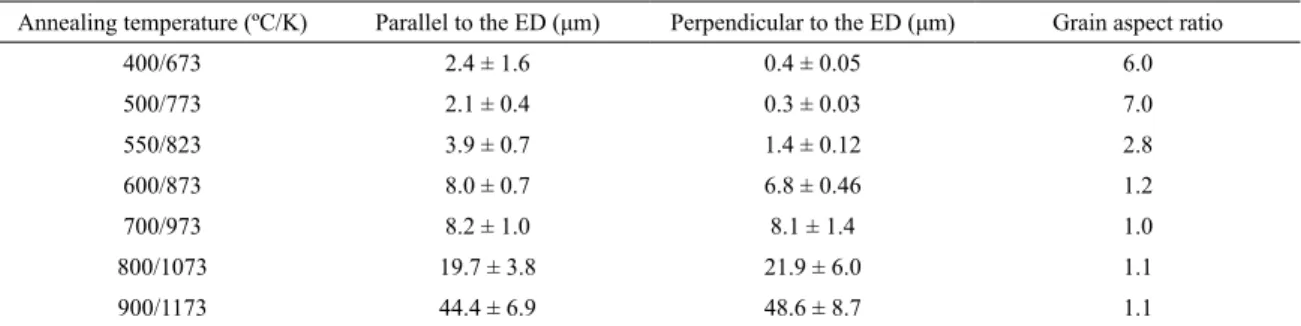
Table 2. Mean spacing among HABs and corresponding grain aspect ratio as a function of the annealing temperature taken from EBSD data (holding time is 1 hour) (ED: Extrusion direction; HAB: High angle grain boundaries).
Annealing temperature (ºC/K) Parallel to the ED (μm) Perpendicular to the ED (μm) Grain aspect ratio
400/673 2.4 ± 1.6 0.4 ± 0.05 6.0
500/773 2.1 ± 0.4 0.3 ± 0.03 7.0
550/823 3.9 ± 0.7 1.4 ± 0.12 2.8
600/873 8.0 ± 0.7 6.8 ± 0.46 1.2
700/973 8.2 ± 1.0 8.1 ± 1.4 1.0
800/1073 19.7 ± 3.8 21.9 ± 6.0 1.1
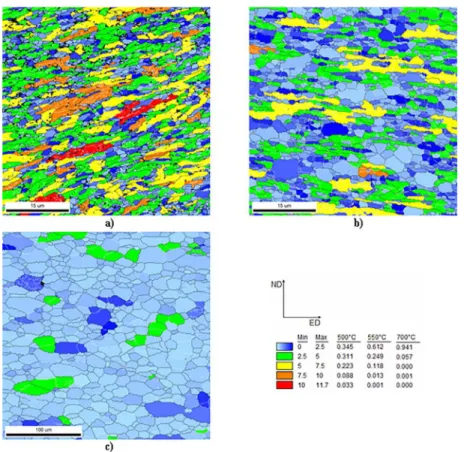
Figure 3. IPF maps of the ED-ND sections of samples annealed at: (a) 400ºC (673 K), (b) 500ºC
(773 K), (c) 550ºC (823 K) and (d) 700ºC (973 K). Black lines mark high angle boundaries (>
15º). Low angle boundaries are indicated by white lines (ED: Extrusion direction; ND: normal
direction). Notice the changes in the scale bar.
3.3. Texture evolution
The microtexture of ECAP-processed niobium was determined in the as-deformed and annealed states. The evolution of texture during annealing can be analyzed by
comparing the respective pole igures, as shown in Figure 7.
The intensities are rather similar (about 5 times random) in the annealed condition. The cube component is predominant
in the deformed state (ED-ND section). This component is
still present after annealing at 550oC (823 K) for 1 h and
after annealing at 600oC (873 K) and 700oC (973 K) for 1
h it is replaced by other components where grain growth becomes evident, especially at 700oC (973 K).
We focus our analysis on 550oC (823 K) where
discontinuous recrystallization becomes signiicant and where the irst recrystallized grains appear. A detailed
view of the texture components in the specimen annealed at 550oC (823 K) for 1 h is shown in Figure 8. Notice that
the cube component inherited from the deformed state prevails in the unrecrystallized areas37, 38. In order to better
understand these results, the recrystallized grains were highlighted from the recovered matrix by using a criterion
based on the conidence index (CI) from the EBSD data.
The average CI of the orientation map shown in Figure 8 Figure 4. Grain orientation spread (GOS) distributions of
Figure 5. Grain orientation spread (GOS) maps of the ED-ND sections of samples annealed at: (a) 500ºC (773 K), (b) 550ºC (823 K), (c) 700ºC (973 K). (ED: Extrusion direction; ND: normal
direction). Notice the changes in the scale bar.
Figure 6. Comparison between the misorientation distribution histograms in niobium single crystal deformed by 8 ECAP passes and annealed for 1 hour at 400ºC (673 K), 550ºC (823 K), and 700ºC (973 K). The Mackenzie distribution is also depicted (dashed line).
is 0.34. The conidence index gives a numerical measure of pattern indexing quality, i.e. it quantiies the reliability
of the indexing solution proposed by the analysis software. About 250 recrystallized grains (points with CI > 0.75) were selected from the orientation map presented in Figure 8 and
their orientation is shown in the pole igure in Figure 9b. Similar results can be obtained by using the GOS < 2.5o
criterion. Even loosing a few grains with this procedure, most of the recrystallized grains were accounted for. Cube and other minor components are present. The use of lower values of CI did not allow us to make a perfect separation since the CI found in many points in the recovered matrix
was quite high. Using a similar procedure, the orientation
of the recovered areas was also determined (Figure 9a).
From the corresponding (001) pole igure, it can be seen
that the recovered matrix is deviated about 10o from the
ideal cube component.
By comparing both pole igures (Figure 9) it is possible
to observe that the microtexture of the recrystallized grains
difers only slightly from the orientation of the recovered matrix. Other minor components did appear in the annealed
microstructure. This observation can be understood from the fact that most cube grains are abutting on other near-cube
grains because of the strong cube iber texture. The interfaces
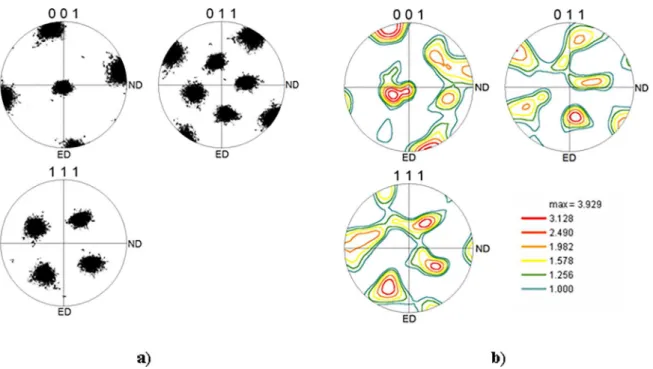
Figure 7. Contoured pole igures showing the evolution of microtexture in niobium single crystal
deformed by 8 ECAP passes and annealed for 1 hour at several temperatures: (a) as-deformed
state; (b) 550ºC (823 K); (c) 600ºC (873 K) and (d) 700ºC (973 K). EBSD measurements were carried out in ED-ND sections (ED: Extrusion direction; ND: normal direction).
Figure 8. (a) Orientation map (ED-ND section) and (b) ODF sections (φ2 = 0º and φ2 = 45º) of
niobium after 8 ECAP passes followed by annealing at 550oC (823 K) for 1 hour. (ED: Extrusion direction; ND: normal direction).
One possible explanation could be that there is an equal
chance to go in both ways, but if the boundary consumes the cube grain, there is a high probability that the next grain that it will encounter is again a cube grain, so a new HAB is formed and the minor component has a size advantage
and proceeds growing. On the other hand, if the boundary
consumes the minor component (growth of the cube grains), there is also a high probability that the next grain is again a
cube one and hence a LAB is formed and further growth is
prevented or slowed down (orientation pinning). This might explain why the cube component weakens and other minor
components appear when annealing at higher temperatures, that is >550oC (823 K).
After annealing at 700ºC (973 K)a diferent situation is
observed, i.e. the cube texture after ECAP is replaced by another texture component rotating towards {001}<110> (rotated cube). Figure 3d reveals the occurrence of normal
grain growth. Once more, the net efect is the growth of
Figure 9. Pole igures corresponding to the orientation map shown in Fig. 8: (a) recovered matrix and (b) recrystallized grains (CI > 0.75).
oriented new grains; i.e. the prior minor texture component which were inherited from the deformed structure replace the initial cube texture.
Full understanding of the recrystallization texture in this material is challenging. ECAP-processed materials can display pronounced texture heterogeneity, i.e., texture variations from one position to another in the processed material22,39-41. These variations have distinct causes such as
friction (die-workpiece), massive shear banding and grain
orientation efects42. Also, comparison between the texture
components found before and after recrystallization annealing
in this material has to take also into account statistical efects,
i.e. the small number of grains/crystallites used to build up
the pole igures.
4. Conclusions
The microstructural stability of [211]-oriented niobium single crystal deformed by 8 ECAP passes (route Bc) during isothermal annealing up to 900oC (1173 K) was investigated.
The microstructure of the as-deformed specimen consists of
ine crystallites arranged in a lamellar structure with sizes
smaller than 1 µm and an average grain aspect ratio above 6. After 8 ECAP passes a sharp cube texture develops in the deformed state for this particular crystal orientation.
High-resolution EBSD was used to follow the changes in
texture and mesotexture after annealing in vacuum in the temperature range 400-900oC (673-1173 K). Signiicant
changes in values of both the volume fraction of high angle boundaries and Vickers hardness show that primary (discontinuous) recrystallization is the main softening mechanism with a maximum rate at about 550oC (823 K).
Above 700oC (973 K), normal grain growth prevails. The
cube texture after ECAP processing is replaced by another texture component rotating towards {001}<110> (rotated cube) during grain growth.
5. Acknowledgments
Authors are thankful to FAPESP (Brazil) for the support provided by Grant 04/14875-0. HRZS is CNPq Fellow (306050/2013-7). The kind assistance of Katja Angenendt
(MPIE) with FEG-SEM-EBSD measurements is greatly
appreciated.
6. References
1. Ferrasse S, Segal VM, Alford F, Kardokus J, Strothers S. Scale up and application of equal-channel angular extrusion for the electronics and aerospace industries. Materials Science and Engineering: A. 2008;493(1-2):130-140.
2. Medvedev A, Ng HP, Lapovok R, Estrin Y, Lowe TC, Anumalasetty
VN. Comparison of laboratory-scale and industrial-scale equal channel angular pressing of commercial purity titanium.
Materials Letters. 2015;145:308-311.
3.Azushima A, Kopp R, Korhonen A, Yang DY, Micari F, Lahoti
GD, et al. Severe plastic deformation (SPD) processes for metals.
CIRP Annals - Manufacturing Technology. 2008;57(2):716-735.
4. Lowe TC. Metals and alloys nanostructured by severe plastic
deformation: commercialization pathways. JOM -Journal of The Minerals, Metals & Materials Society. 2006;58(4):28-32.
5. Li S, Beyerlein IJ. Modelling texture evolution in equal channel angular extrusion of bcc materials: efects of processing route
6. Segal VM. Materials processing by simple shear. Materials Science and Engineering: A. 1995;197(2):157-164.
7. Zhu YT, Lowe TC. Observations and issues on mechanisms of grain reinement during ECAP process. Materials Science and Engineering: A. 2000;291(1-2):46-53.
8. Valiev RZ, Langdon TG. Principles of equal-channel angular pressing as a processing tool for grain reinement. Progress in Materials Science. 2006;51(7):881-981.
9. Huang HW, Chang L, Kao PW, Chang CP. Efect of die angle on
the deformation texture of copper processed by equal channel angular extrusion. Materials Science and Engineering: A. 2001;307(1-2):113-118.
10. Beyerlein IJ, Lebensohn RA, Tomé CN. Modeling texture
and microstructural evolution in the equal channel angular extrusion process. Materials Science and Engineering: A. 2003;345(1-2):122-138.
11. Tóth LS, Massion RA, Germain L, Baik SC, Suwas S. Analysis
of texture evolution in equal channel angular extrusion of copper
using a new low ield. Acta Materialia. 2004;52(7):1885-1898.
12. Hayes JS, Keyte R, Prangnell PB. Efect of grain size on tensile
behaviour of a submicron grained Al-3 wt-%Mg alloy produced by severe deformation. Materials Science and Technology. 2000;16(11-12):1259-1263.
13. Valiev RZ, Islamgaliev RK, Alexandrov IV. Bulk nanostructured materials from severe plastic deformation. Progress in Materials Science. 2000;45(2):103-189.
14. Wang ZC, Prangnell PB. Microstructure reinement and mechanical properties of severely deformed Al-Mg-Li alloys.
Materials Science and Engineering: A. 2002;328(1-2):87-97.
15. Prangnell PB, Hayes JS, Bowen JR, Apps PJ, Bate PS. Continuous recrystallisation of lamellar deformation structures produced by severe deformation. Acta Materialia. 2004;52(11):3193-3206.
16. Sandim HRZ, Raabe D. An EBSD study on orientation efects
during recrystallization of coarse-grained niobium. Materials
Science Forum. 2004;467-470:519-524.
17. Humphreys FJ, Prangnell PB, Bowen JR, Gholinia A, Harris
C. Developing stable ine-grain microstructures by large strain
deformation. Philosophical Transactions of the Royal Society A. 1999;357(1756):1663-1681.
18. Messemaeker JD, Verlinden B, Humbeeck JV. Structural
evolution of IF steel during annealing after ECAP. Materials
Science Forum. 2004;467-470:1295-1300.
19. Mathaudhu SN, Barber RE, Hartwig KT. Microstructural
reinement of tantalum for Nb3Sn superconductor difusion
barriers. IEEE Transactions on Applied Superconductivity. 2005;15(2):3434-3437.
20. Mathaudhu SN, Hartwig KT. Grain reinement and recrystallization
of heavily worked tantalum. Materials Science and Engineering: A. 2006;426(1-2):128-142.
21. Hazra SS, Pereloma EV, Gazder AA. Microstructure and mechanical properties after annealing of equal-channel angular pressed interstitial-free steel. Acta Materialia. 2011;59(10):4015-4029.
22. Sandim HRZ, Bolmaro RE, Renzetti RA, Sandim MJR, Hartwig
KT, Vogel SC, et al. Texture Evolution as Determined by In situ
Neutron Difraction During Annealing of Iron Deformed by
Equal Channel Angular Pressing. Metallurgical and Materials Transactions A. 2014;45(10):4235-4246.
23. Bernardi HH, Sandim HRZ, Verlinden B, Raabe D. Recrystallization
of niobium single crystals deformed by ECAE. Materials
Science Forum. 2007;558-559:125-130.
24. Sandim HRZ, Bernardi HH, Verlinden B, Raabe D. Equal channel
angular extrusion of niobium single crystals. Materials Science and Engineering: A. 2007;467(1-2):44-52.
25. Prangnell PB, Bowen JR, Gholinia A. The formation of submicron and nanocrystalline grain structure by severe deformation. In: Proceedings of the 22nd Risø International Symposium on Materials Science; 2001 Sep 3-7; Risø, Denmark. National
Laboratory; 2001. p. 105-126.
26. Etter AL, Baudin T, Rey C, Penelle R. Microstructural and
textural characterization of copper processed by ECAE. Materials Characterization. 2006;56(1):19-25.
27. Reihanian M, Ebrahimi R. Moshksar MM, Terada D, Tsuji N. Microstructure quantiication and correlation with low stress of ultraine grained commercially pure Al fabricated by equal
channel angular pressing (ECAP). Materials Characterization. 2008;59(9):1312-1323.
28. Pan Z, Xu F, Mathaudhu SN, Kecskes LJ, Yin WH, Zhang XY,
et al. Microstructural evolution and mechanical properties of niobium processed by equal channel angular extrusion up to 24 passes. Acta Materialia. 2012;60(5):2310-2323.
29. Jazaeri H, Humphreys FJ. Quantifying recrystallization by
electron backscatter difraction. Journal of Microscopy. 2004;213(Pt 3):241-246.
30. Raabe D, Schlenkert G, Weisshaupt H, Lücke K. Texture and
microstructure of rolled and annealed tantalum. Materials Science and Technology. 1994;10(4):299-305.
31. Cao Y, Di H, Zhang J, Zhang J, Ma T, Misra RDK. An electron backscattered difraction study on the dynamic recrystallization
behavior of a nickel-chromium alloy (800H) during hot deformation.
Materials Science and Engineering: A. 2013;585:71-85.
32. Vignal V, Ba D, Zhang H, Herbst F, Manchet SL. Inluence of
the grain orientation spread on the pitting corrosion resistance
of duplex stainless steels using electron backscatter difraction
and critical pitting temperature test at the microscale. Corrosion Science. 2013;68:275-278.
33. Sheng H, Sun Z, Uytdenhouwen I, Oost GV, Vleugels J. Temperature and deformation efect on the low and high angle
grain boundary structure of a double forged pure tungsten.
International Journal of Refractory Metals and Hard Materials. 2015;50:184-190.
34. Cao Y, Di H. Research on the hot deformation behavior of a
Fe-Ni-Cr alloy (800H) at temperatures above 1000ºC. Journal of Nuclear Materials. 2015;465:104-115.
35. Zaeferer S, Romano P, Friedel F. EBSD as a tool to identify
and quantify bainite and ferrite in low-alloyed Al-TRIP steels.
Journal of Microscopy. 2008;230(3):499-508.
37. Raabe D, Lücke K. Rolling textures of niobium and molybdenum.
Zeitschrift für Metallkunde. 1994;85(5):302-306.
38. Raabe D, Ball J, Gottstein G. Rolling textures of a Cu-20%Nb
composite. Scripta Metallurgica et Materialia. 1992;27(2):211-216.
39. Skrotzki W, Scheerbaum N, Oertel CG, Arrufat-Massion R, Suwas S, Tóth LS. Microstructure and texture gradient in copper
deformed by equal channel angular pressing. Acta Materialia. 2007;55(6):2013-2024.
40. Skrotzki W, Tränkner C, Chulist R, Beausir B, Suwas S, Tóth
LS. Texture heterogeneity in ECAP deformed copper. Solid
State Phenomena. 2010;160:47-54.
41. Li S, Beyerlein IJ, Necker CT, Alexander DJ, Bourke M.
Heterogeneity of deformation texture in equal channel angular extrusion of copper. Acta Materialia. 2004;52(16):4859-4875.
42. Jia N, Roters F, Eisenlohr P, Raabe D, Zhao X. Simulation of
shear banding in heterophase co-deformation: Example of plane strain compressed Cu-Ag and Cu-Nb metal matrix composites.