*e-mail: [email protected]
WC-CoCr Coatings Sprayed by High Velocity Oxygen-Fuel (HVOF) Flame on
AA7050 Aluminum Alloy: Electrochemical Behavior in 3.5% NaCl Solution
Marina Magnania, Patrícia Hatsue Suegamaa, Abel André Cândido Reccob, Josep Maria Guilemanyc, Cecílio Sadao Fugivaraa, Assis Vicente Benedettia*
a
Instituto de Química, Universidade Estadual Paulista – UNESP,
CP 355, 14801-970 Araraquara - SP, Brazil
bEscola Politécnica, Universidade de São Paulo – USP,
CP 61548, 05424-970 São Paulo - SP, Brazil
c
CPT Thermal Spray Centre, Materials Engineering, Universitat de Barcelona,
C/Martí i Franquès 1, E-08028 Barcelona, Spain
Received: March 15, 2007; Revised: October 17, 2007
In the present work, the electrochemical behavior of WC-CoCr coatings with 10 (W10), 15 (W15) and 20 (W20) torch passes sprayed by High Velocity Oxygen-Fuel (HVOF) flame on AA7050 aluminum alloy substrate, evaluated in 3.5% NaCl solution, were compared using open-circuit potential (EOC) measurements, electrochemical impedance spectroscopy (EIS) and polarization curves. The coating surfaces and their cross sections were characterized by X ray diffraction and the Rockwell-C hardness test, and also by optical (OM) and scanning electron microscopy (SEM) before and after the corrosion tests. The electrochemical data showed that sample
W10 presented higher corrosion resistance than the others in chloride solutions. In some tests, aluminum salts on the coating surface were identified by EDS, indicating the corrosion of the substrate. And using aluminon, aluminum ions were detected and analyzing the surface via stereomicroscopy, hydrogen bubbles were observed, both showing that the electrolyte reached the substrate and galvanic corrosion possibly occurred. The physical characterization showed that sample W10 presented a lower number of cracks and pores, justifying its higher corrosion resistance.
Keywords: corrosion resistance, EIS, HVOF, WC-CoCr, aluminum alloy
1. Introduction
Aluminum alloys have been chosen for the production of struc-tural components of aircraft since about 1930. Although polymer matrix composites are being used extensively in high-performance military aircraft and also specified for some applications in modern commercial aircraft, AA7050 aluminum alloys are the overwhelm-ing choice for the plate, extrusions, hand and die forgoverwhelm-ings of aircraft structural parts. Other applications require very high strength ma-terials coupled with high resistance to exfoliate corrosion, avoid stress-corrosion cracking and promote high fracture toughness and fatigue resistance1,2.
All structural materials are susceptible to some degradation from the environment, and aluminum alloy products used in aircraft are not an exception. Aluminum alloy products corrode in a localized manner either by pitting, intergranular attack or exfoliation2-4. It is well known that pitting corrosion in the AA7050 aluminum alloys is usually associated to constituent particles, and pitting may have a marked effect on the fatigue properties of these materials. Also, light metals in general exhibit very poor tribological properties resulting in severe superficial wear5.
To increase the corrosion resistance and improve tribological prop-erties of aluminum alloys in highly erosive environments, high-wear and corrosion-resistant coatings are proposed and these are sprayed onto the alloy using the HVOF (High Velocity Oxy-Fuel) method. The thermal spray process is by far the most versatile modern method for surface treatment in terms of economy, range of materials applied and protected, and the scope of application6. The HVOF powder spray process represents a state-of-the-art method to apply thermal spray
metallic coatings. It combines a fuel like kerosene, propylene, and so on, which burns with a large amount of oxygen to produce a flame with a relatively low temperature (around 3000°C) and an extremely high gas-molecule velocity. This velocity may reach values near 2000 m/s (for HVOF) in contrast to about 100 m/s (flame spraying) or 1000 m/s (plasma spraying). It can result in very dense and tightly adherent coat-ings, having low residual stresses with little or no oxidation6. Thus, the HVOF process can be largely used for applying powder materials with a relatively low melting point and those which are subjected to thermal degradation at high temperatures7.
When coatings are applied using a high quality process and under strict quality control procedures, the coatings can provide a very effective barrier to prevent any corrosion occurring at the coating/ substrate interface. In this situation, it is very important to consider that coating corrosion itself can occur and its initiation and propaga-tion associated with composite microstructure features are of great importance. The three main issues related to the corrosion perform-ance of thermal spray coatings are (i) protection of the substrate, (ii) corrosion of the coating itself, and (iii) galvanic processes between the coating and the substrate8.
and Cr3Cr2-NiCr are the best candidates for application using HVOF7. The first one provides hard and dense coatings with good adhesion and resistance against abrasion and erosion, particularly in aqueous solu-tions, and the second exhibits good friction resistance, high resistance against abrasion, erosion and corrosion at temperatures up to 815 °C, not exceeding 900 °C, and also high corrosion resistance in gases containing sulphur7. Among numerous types of thermal spray coatings, the tungsten-carbide/cobalt based ones are widely used in industry, in general to protect steels, when abrasion, sliding, fretting, corrosion and erosion resistance are required6,9-14. The WC-CoCr coatings are also used as an alternative to hard chromium plating10. The hard WC particles in the coating provide high hardness and wear resistance, while the metal binder (CoCr, Ni or Co) gives the necessary coating toughness15. Almost all applications have been done on steels, being scarce on aluminum and their alloys mainly due to the residual stress. For aluminum alloys and other light metals or their alloys covered with ceramic coatings, the high contraction of the substrate during the cooling period causes compressive thermal stresses due to their low coefficient of thermal expansion. As a consequence, coating delamina-tion at the coating/substrate interface and/or within the coating can occur16. So successfully applying these coatings on aluminum alloys is still a difficult task. Although some thermally sprayed coatings have been recently applied on aluminum and other substrates, no significant effect of the substrate on their mechanical and tribological properties was observed5. However, only morphological and mechanical charac-terization was performed on these coating/aluminum-based systems and no electrochemical studies were found. This means that this work is one of the first to deal with electrochemical studies of WC-based coated aluminum alloys. Considering the possible applications of these coatings in different environments composed mainly of water-based solutions containing soluble salts, it is very important to investigate their corrosion behavior in aqueous medium.
In this work, the corrosion resistance and some mechanical properties of WC-CoCr thermal spray coatings sprayed on an AA 7050-T7 aluminum alloy with different numbers of torch passes were studied. The corrosion resistance was studied using electrochemical techniques: open-circuit potential (EOC), electrochemical impedance spectroscopy (EIS), and polarization measurements (CP) in unstirred and aerated 3.5% NaCl solution.
2. Experimental Procedure
An AA 7050-T7 aluminum alloy with a nominal composition of 6.1 wt. (%)Zn, 2.2 wt. (%)Cu, 2.1 wt. (%)Mg, 0.05 wt. (%)Si, 0.08 wt. (%)Fe, 0.01 wt. (%)Mn, 0.0 wt. (%)Cr, 0.11wt. (%)Zr, 0.02 wt. (%)Ti and the balance being Al was used as substrate. Prior to the spraying process, rectangular (100 x 20 x 5 mm3) samples were degreased with acetone and grid blasted with Al2O3 (grade 24) to get a surface with a mean roughness of around 5 µm.
The WC-CoCr coatings were obtained via HVOF spraying (CPT-Universitat de Barcelona) using a DJH 2700 gun, applying 10 (W10), 15 (W15) and 20 (W20) torch passes, using an oxygen (253 L/min) and propylene (69 L/min) mixture to partially melt the powder particles and spray them onto the aluminum alloy substrate. The powder selected was a commercial 86WC-10Co4Cr (wt. (%)) from Sultzer Metco, Diamalloy 5844, which is an agglomerated sintered powder having a particle size of 45 ± 11 µm, and also a cobalt-chromium matrix with well-distributed fine WC particles (average size of 1 µm).
In this work, we decided to study only samples prepared with a number of torch passes equal to or less than 20, to avoid the formation of visible cracks, which result from inappropriate coatings. These coating thicknesses were chosen for the following reasons: Studies of
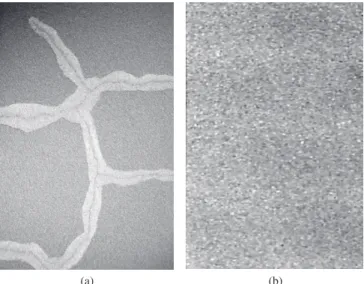
cermet coatings6,9-11,14,15,17,18 on steel substrate showed that increasing the thickness of a nobler coating implies in an increase of the barrier effect, delaying the electrolyte attack and consequently, increasing the corrosion resistance. In thermal spray technique, especially for HVOF, thick coatings accumulate stresses, which can cause a detachment at the coating/substrate interface as a means of relieving this stress18. But there is another way to relieve stress, as can be seen in Figure 1, which can be influenced by the number of torch passes. The effect of the number of torch passes can be visibly seen for coated aluminum alloys: in Figure 2a, the coating was built up with 30 torch passes (a thicker sample) while in Figure 2b, 20 torch passes were applied onto the aluminum alloy substrate. It is possible to observe cracks on the surface of the sample prepared with 30 torch passes and im-mediately after spraying some coating fragments were expelled out from it, indicating a highly stressed coating.
The microstructure of all coatings was studied using a scanning electron microscope (SEM) coupled to an X ray energy dispersive analyzer (EDS). The coating thickness was evaluated from digital optical micrographs using MATROX INSPECTOR image software, and the following coating thickness values were found: 180, 280 and 370 µm for W10, W15 and W20 samples respectively. An Otto
20 kV 100x 100 µm 166001
Figure 1. SEM cross-section images for the coating built up with 30 torch passes before immersion in aerated and unstirred 3.5% NaCl solution.
(a) (b)
AA7050 Aluminum Alloy: Electrochemical Behavior in 3.5% NaCl Solution 379
recorded after the EIS experiments for all samples in the potential range of –150 to +350 mV vs. the EOC at 0.166 mV/s using an EG&G Parc-273 potentiostat coupled to a PC.
The surface of the W15 sample was examined during the im-mersion tests (up to 8 hours) in 3.5% NaCl + aluminon solution using a stereomicroscope model QUIMIS Q734- ZT. The aluminon (C22H23N3O9), a reagent confected using Aurintricarboxylic Acid and Ammonium Salt, which turns red in the presence of aluminium ions.
3. Results and Discussion
3.1. Structural characterization:
WC-CoCr powder and coatings
Figure 3 shows micrographs of the powder used to obtain the coat-ings. It is possible to observe that pores are present, which could facilitate heat distribution and promote better particle melting or semi-melting.
To characterize the powder, a XRD pattern (Figure 4) was recorded and phases, such as WC, Co4W2C and Cr were identified Wolpert–Werke indenter was used for the Rockwell C with a load of
1471 N for the adhesion tests (CEN/TS 1071-8 standard)19. This test method causes layer damage adjacent to the boundary of the indenta-tion. On each sample, three indentations were produced.
The corrosion resistance of the coated aluminum alloy was evaluated by electrochemical measurement of the as-sprayed HVOF coated samples in 80 mL of aerated and unstirred 3.5% NaCl solution at 25 °C. An Ag|AgCl|KCl(sat.) electrode connected to the working solution through a Luggin capillary was used as reference along with a Pt network as auxiliary electrode.
Finally, a working electrode of each coated sample was placed at the bottom of an electrochemical cell, exposing a geometric area of 0.8 cm2 to the solution.
The EOC and EIS measurements were made using EG&G Parc-273 and Solartron-SI1255 systems. The EIS tests were performed applying 10 mV (rms) to the EOC value, starting from 5 x 10⁴ to 10-2 Hz with 7 points/decade once the open-circuit potential attained an almost constant value, which meant that a steady-state condition had been reached (26 hours of immersion). Polarization curves were
20 kV 1.000x 10 µm 096821
(a) (b)
20 kV 5.000x 5 µm 096818
Figure 3. WC-CoCr powder: a) SEM surface image; and b) SEM cross-section image.
(a) (b)
40 60 80 100
0 100 200 300 400
Intensity
2
W2C WC
W CoO
Cr2O3CoO
Figure 4. a) X ray patterns for WC-CoCr powder; and b) as-sprayed coating.
40 60 80 100
0 1000 2000 3000
Intensity
2
WC Co4W2C
(Figure 4a). When the powder was submitted to the HVOF flame, some changes on the XRD pattern were observed. The following phases were found in the coating: WC, W2C, CoO, W and Cr2O3.CoO (Figure 4b). Phases W2C, CoO, W and Cr2O3.CoO derived from the thermal decomposition of the powder during spraying.
Figure 5 shows SEM images for sample W15 as-sprayed using the HVOF technique. W15 and W20 samples presented a high quantity of pores and cracks, mainly on sample W20. On the contrary, sample
W10 is homogeneous, compacted, and the WC phase is well-distributed such that there is a lower quantity of pores; and cracks were not observed in this coating.
3.2. Electrochemical characterization
3.2.1. Open-circuit potential (E
OC) measurements
For all samples, the EOC values were measured for 26 hours of immersion in 3.5% NaCl solution (Figure 6). For all samples and until 5 hours of immersion, the open-circuit potential increased. The potential oscillations observed in all curves can be related to the electrolyte penetration and hydrogen bubble formation by the chloride attack, mainly to the substrate. For AA 7050 aluminum alloy, the EOC stabilized around -0.60 V. For samples W15 and W20, the EOC values increased up to the 5 and 10-hour mark, respectively, and after diminished to reach a stabilized value at around –0.78 V, which is lower than that measured for the aluminum alloy. For W10, the EOC increased slowly up to the end of the experiment (around –0.5 V). The continuous increase in the EOC values for the W10 sample could be mainly associated to the aluminum oxide/hydroxide formation inside and at the bottom of the pores, suggesting a slight attack on the aluminum alloy and/or to the coating itself (metallic matrix). It is well-known9,10,11,17,18 that coatings prepared using HVOF present lower porosity than coatings prepared using other thermal spray techniques, but considering the corrosion resistance, this porosity is enough for the electrolyte to penetrate and attack the substrate. For samples W15
and W20, more oscillation occurred in the EOC values than for the
W10 sample, which can be attributed to the increase in the number of pores and cracks in the thicker coatings. Other reasons for poten-tial oscillations can be attributed to the different reactions involving chloride attack mainly to the substrate resulting in pitting corrosion, hydrogen evolution and galvanic micro-cell formation between the tungsten carbide, matrix phases and the substrate. Additionally, due to the higher stress present in the thicker coatings, delamination between layers inside the coating and near the substrate was observed. It is
possible that the EOC values for samples W15 and W20 after 10 hours of immersion reflect a high influence of the pitting potential value, while for the aluminum alloy substrate, a pitting / repassivation proc-ess is still occurring as time passes during the experiment, producing an almost constant and higher potential. Probably, the EOC value for the aluminum alloy diminishes at much longer immersion times, when pits are larger and no repassivation is possible. Therefore, one possible path for electrolyte to penetrate up to substrate is through cracks, pores and inner layers or coating detachment.
The presence of pores and cracks, mainly for thicker coatings sprayed on light metals or their alloy, can be related to the thermal stress. Thermal stresses appear when materials are heated or cooled causing thermal effects and defects in the materials. Some of these thermal effects include thermal stress, strain, and deformation. The first effect here considered is thermal deformation. Thermal defor-mation simply means that as the “thermal” energy (or temperature) of a material increases, the vibration of the atoms/molecules that comprise the material also increases, which results in what can be considered a stretching of the molecular bonds, causing the material to expand16.
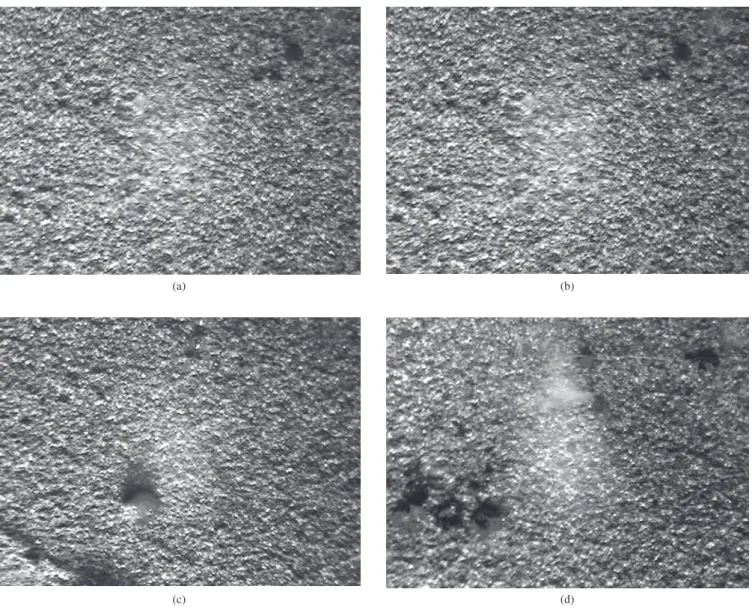
One problem of these coatings is how to know when the elec-trolyte has reached the substrate. According to literature20, Al3+ ions react with aluminon (triammonium salt of aurin tricarboxylic acid) to form a dye, which has been used for the colorimetric determination of Al(III) species. Thus, a 3.5% NaCl + aluminon solution was prepared and used as electrolyte. When the chloride ions reached the substrate, as the Al substrate is less noble than the coating, its corrosion is ac-celerated via a galvanic process. As a result, Al3+ ions are liberated into the solution and a red complex with aluminon is formed. Using a stereomicroscope coupled to a camera and a computer, it was possible to observe the coating surface for long immersion times (Figure 7). Figure 7a and b) shows the surface of sample W15 where no bubbles or red points are seen. After two hours of immersion, red spots are observed at the sample surface due to the complex formation indicat-ing the penetration of the electrolyte through the coatindicat-ing and reachindicat-ing the substrate. Thus, it is clear that the aluminum corrosion process has already started. After three hours (Figure 7c), hydrogen bubbles also appeared on the surface. Increasing the immersion time, the attack on the substrate continued and the corrosion products increased on the coating surface (Figure 7d). The same test was performed for samples
W10 and W20. Hydrogen bubbles and red spots were only observed
0 5 10 15 20 25 30
–0.8 –0.7 –0.6 –0.5
Al-substrate
W20
W15 W10
E.V
–1
Time/hours
Figure 6. Open-circuit potential (EOC) vs. time curves for samples W10, W15, W20 and AA 7050 aluminum alloy obtained in aerated and unstirred 3.5% NaCl solution at 25 °C.
20 kV 2.000x 10 µm 110515
AA7050 Aluminum Alloy: Electrochemical Behavior in 3.5% NaCl Solution 381
Figure 7. Stereomicrographs of sample W15 surface immersed in 3.5% NaCl + aluminon for different times/hours: a) 0; b) 1; c) 2; and d) 8 (magnifica-tion: 80x).
(c) (d)
(a) (b)
after 6 hours of test for sample W10 while they were observed after a shorter time for sample W20 than for W15.
3.2.2. EIS measurements
Figure 8 shows the impedance diagrams for samples W10, W15
and W20 obtained after 26 hours of immersion in unstirred and aer-ated 3.5% NaCl solution. The complex plane plots (Figure 8a) for sample W10 show one well-defined semicircle at high frequencies and another not well-defined at low frequencies; while for samples W15
and W20 only one time constant was observed. The time constant for sample W15 appeared at intermediate frequencies. This means that for sample W10, the first process occurring at higher frequencies (1-10 Hz) and with a phase angle around 70 degrees (Figure 8b) is related to the coating, and that the one appearing at lower frequencies (0.1-0.01 Hz) and having a phase angle below 30 degrees is due to the substrate. In the case of samples W15 and W20, only one time constant at low frequencies was observed, which was mainly attrib-uted to the substrate response, since the coating itself of sample W20
cannot protect the substrate against corrosion in 3.5% NaCl solution. The highest total impedance value was obtained for sample W10.
It is also observed that as the number of torch passes increases, the total impedance value decreases. The total impedance values were: around 30, 1 and 0.4 kΩ for samples W10, W15 and W20, respectively. This means that the thermal stress within the coating depends on the number of torch passes and influences the corrosion resistance values of the coating/substrate system.
A similar analysis can be made from the phase angle read from the Bode plots. The maximum phase angles for samples W10, W15
and W20 are 70, 45 and 38 degrees respectively. This indicates that sample W10 presents the most capacitive behavior when compared to the others. This fact can be attributed to the structure of the W10
porosity, facilitating electrolyte penetration to within the coating, and consequently promoting corrosion reactions. When only one time constant is observed (samples W15 and W20), an overlapping of two time constants may have occurred, since the time constant related to the coating may have moved to lower frequencies and that related to the substrate may have moved to higher frequencies. This phenomenon occurs when the coating is degraded and the substrate is easily reached by the electrolyte.
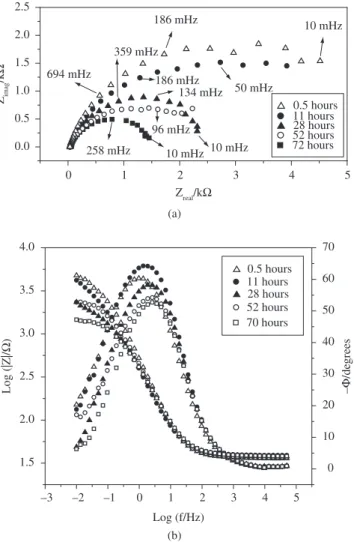
Figure 9 shows EIS diagrams for sample W10 as a function of the immersion time. The total impedance value decreased with time, indicating a deterioration of the coating and substrate. This means that the coating only acts as barrier against electrolyte penetration for a certain period, which was higher for sample W10 than for the others. These results call attention to the importance of diminishing the level of stress in the coating, since the consequence is the forma-tion of pores and cracks. The stress can be reduced by optimizing all spraying parameters, mainly when light metallic materials (soft materials) are coated with hard metallic-ceramic coatings.
As the sample thickness can be a cause of stress, it is important to remember that the thickness values measured for samples W10,
W15 and W20 were: 180, 280 and 370 µm, respectively, and each torch pass layer (sublayer) had a thickness of around 19 µm. Figure 8. Experimental (a) complex plane plots and (b) log |Z| and -φ vs. log(f) Bode plots for samples W10, W15 and W20 in aerated and unstirred 3.5% NaCl solution after 26 hours of immersion at 25 °C.
0 2 4 6 8
0 1 2 3 4 Zimag /k Ω
Zreal/kΩ
79 mHz 10 mHz
356 mHz 69 mHz 10 mHz 965 mHz 350 mHz 69 mHz 10 mHz W15 W20 W10 (a) (a)
0 1 2 3 4 5
0.0 0.5 1.0 1.5 2.0 2.5 10 mHz 258 mHz 96 mHz 359 mHz 10 mHz 134 mHz 186 mHz 50 mHz 694 mHz
186 mHz 10 mHz
11 hours 28 hours 72 hours 52 hours 0.5 hours Zimag /k Ω
Zreal/kΩ
(b) (b) –10 0 10 20 30 40 50 60 70
–3 –2 –1 0 1 2 3 4 5
1.5 2.0 2.5 3.0 3.5 4.0 – /de grees Log (f/Hz) Log (|Z|/ Ω ) W20 W15 W10 0 10 20 30 40 50 60 70 1.5 2.0 2.5 3.0 3.5 4.0
–3 –2 –1 0 1 2 3 4 5
Log (f/Hz) – /de grees Log (|Z|/ Ω ) 0.5 hours 11 hours 28 hours 52 hours 70 hours
Figure 9. Experimental (a) complex plane plots, (b) log |Z| and -φ vs. log (f) Bode plots for W10-coated aluminum in aerated and unstirred 3.5% NaCl solution for different immersion times at 25 °C.
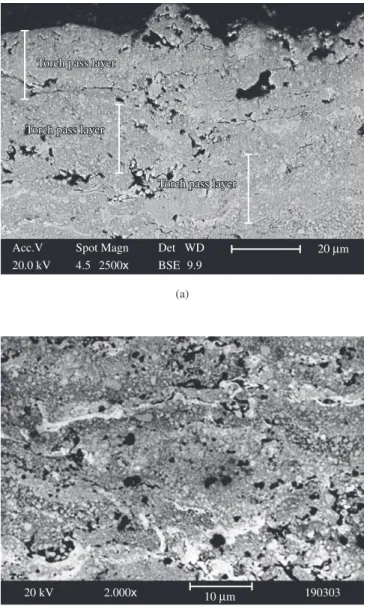
After the immersion tests, the samples were observed using a SEM and for the W10 sample no cracks or delamination was observed even after 30 hours of immersion in 3.5% NaCl solution. However for samples W15 and W20, delamination between the sublayers was observed after 30 hours of immersion in the electrolyte (Figure 10). This occurred because when the electrolyte penetrates the coating, a galvanic pair can be formed between the coating and substrate ac-celerating the corrosion process. Corrosion products such aluminum and other ions can be formed and diffuse out of the coating surface, and salts can also precipitate within the coating between the coat-ing sublayers (those formed in the successive torch passes) and at the coating/substrate interface, causing coating detachment from the substrate. The detaching of the coating may also be related to stress created during the thermal spray process and stress created by the salt precipitation within the coating and at the coating/substrate interface.
3.2.3. Polarizations curves
AA7050 Aluminum Alloy: Electrochemical Behavior in 3.5% NaCl Solution 383
20 µm Acc.V
20.0 kV
Spot Magn
4.5 2500x
Det WD BSE 9.9
Torch pass layer
Torch pass layer
Torch pass layer
Torch pass layer
Torch pass layer
Torch pass layer
(a)
(b)
20 kV 2.000x 10 µm 190303
Figure 10. SEM cross-section images for sample W15 (a, b) and sample W20
(c) after 30 hours immersed in aerated and unstirred 3.5% NaCl solution.
–8 –7 –6 –5 –4 –3 –2
–1.0 –0.8 –0.6 –0.4 –0.2
W20 Al-substrate
W15 W10
E.V
–1
Log (i/A.cm–2)
Figure 11. Polarization curves for samples W10, W15, W20 and AA7050 Al alloy in aerated and unstirred 3.5% NaCl solution after 26 hours of immersion at 25 °C and at 0.166 mV.s–1.
(b)
20 kV 2.000x 10 µm 190316
lower corrosion current. The corrosion potential values were: –0.58 V (sample W10), –0.67 V (AA7050 aluminum alloy), –0.78 V (samples
W15 and W20) and the corrosion current values were: 1.4 µA.cm–2 (sample W10), 1.7 µA.cm–2 (AA7050 aluminum alloy), 5.0 µA.cm–2 (sample W15), and 6.4 µA.cm-2 (sample W20), suggesting that the thermal stress and defects define the behavior of the coating.
3.3. Rockwell-C hardness tests
In this work, one of the most important aims was to make the coating adhere to the substrate surface. As the thermal expansion coefficients (CTE) of the coating and the aluminum alloy are very different, during the cooling of the sample, the high contraction of the light metallic alloy (substrate) causes compressive thermal stress in the coating, mainly in the ceramic coating materials due to their low CTE values16. This can cause coating delamination in the coating/substrate interface or within the coating itself. The thermal stress can also be related to the thickness of the coating mainly for substrates with low hardness and low melting point compared to that of the coating.
A qualitative indication of the effect of the stress accumulated in the coatings was assessed by a Rockwell-C hardness tester, using the same load (1471 N) for all samples.
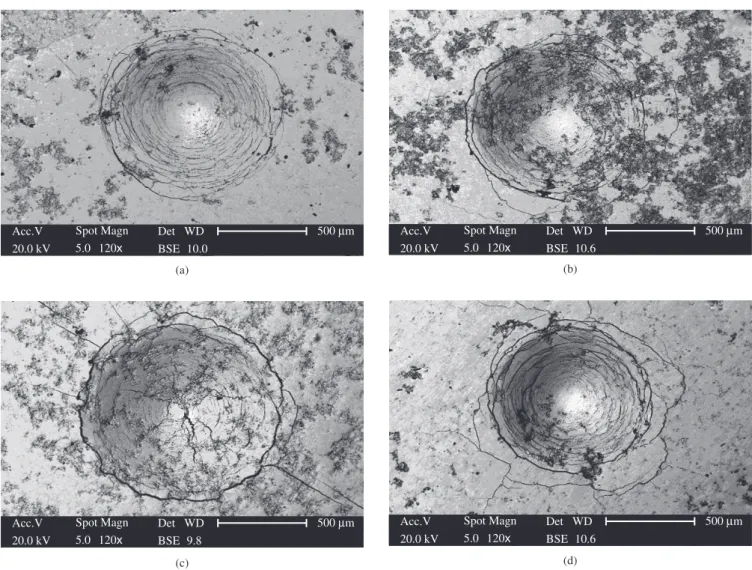
Figure 12 shows micrographs of sample W5 (a sample with 5 torch passes, prepared only for the hardness measurement), and of samples W10, W15 and W20 after the Rockwell-C hardness measure-ment. Comparing the images of samples W5 and W10 (Figure 12a and 12b), it is possible to observe a lower number and smaller cracks than is seen for samples W15 and W20 (Figure 12c and 12d). Litera-ture21 suggests that a small number of radial cracks (less than five) is evidence of good adhesion and toughness; whereas the presence of both branched (ramified) cracks and lakes of delamination mean low adhesion between the sublayers.
Important information can be also obtained from Figure 13, which shows a SEM cross-section image of sample W20 after the electrochemical measurement was taken. It is possible to observe a cracked structure and this rupture can be attributed to the Al salts that precipitated into the coating, which increase the stress present between layers, causing a detaching of the outer layers.
50 µm Acc.V
20.0 kV
Spot Magn
4.9 1000x
Det WD
SE 9.9
20 µm
20 µm
20 µm
20 µm
Al salts
Al salts Al salts
20 µ
Al salts
Al salts Al salts
20 µ
Figure 13. Cross section of sample W10 after immersion in 3.5% NaCl solution for 30 hours.
Figura 14. Amplified image analysis of HRC indentation for sample W10
showing the distance between the sublayers.
50 µm Acc.V
20.0 kV
Spot Magn
5.0 1000x
Det WD BSE 10.4 20.8 µm
18.7 µm 24.5 µm
17.3 µm
500 µm
Acc.V 20.0 kV
Spot Magn
5.0 120x
Det WD BSE 10.0
(a) (b)
500 µm Acc.V
20.0 kV
Spot Magn
5.0 120x
Det WD BSE 10.6
Figure 12. Image analysis of HRC indentations for samples: a) W5; b) W10; c) W15; and d) W20. (c)
500 µm Acc.V
20.0 kV
Spot Magn
5.0 120x
Det WD BSE 9.8
(d)
500 µm Acc.V
20.0 kV
Spot Magn
5.0 120x
Det WD BSE 10.6
is around 20 µm (20.8, 18.3, 24.5 and 17.3 µm without angle correc-tion) in the outer sublayers. This information helps us to explain the reason why samples with lower thickness presented higher corrosion resistance; and this was found to be as a consequence of their lower thermal stress thus giving a lower defect concentration.
4. Conclusion
AA7050 Aluminum Alloy: Electrochemical Behavior in 3.5% NaCl Solution 385
The number of torch passes influences the electrochemical behavior in 3.5% NaCl solution for coatings sprayed via HVOF on AA7050 aluminum alloy substrate. The thinner coating presented the highest corrosion resistance.
Sample W10 showed no cracks and/or coating detachment after immersion in NaCl solution for 26 hours, probably due to the lower thermal stress created during the thermal spray process.
The number of cracks and pores are higher for samples W15 and
W20 and are responsible for electrolyte penetration into the coating, which leads to low corrosion resistance in NaCl solution. For these samples, after only two hours of immersion in chloride solution, aluminum ions and bubbles of hydrogen were detected on the coating surface, clearly indicating the chloride attack on the substrate.
All electrochemical techniques used gave coherent results indicat-ing the W10 coating as the best among the coatings studied.
Comparing samples W15 and W20, it is possible to observe a higher number of cracks for sample W20 than for W15. This may be due to the higher thermal stress detected in sample W20. And fi-nally, the Rockwell-C hardness tests indicate a low adhesion between sublayers for thicker samples, which could contribute to increase the number of cracks and pores.
Acknowledgments
The authors wish to thank FAPESP (procs. no 02/11542-4, 05/51851-4,04/00776-0), CAPES (BEX- 2283/04-2), and CNPQ (proc. nº 300343/2004-3) for the scholarships. They also wish to thank Generalitat de Catalunya for financial support (Project 2006SGR00310), CPT - Thermal Spray Centre, Universitat de Bar-celona, BarBar-celona, Spain for the facilities and a special acknowledge-ment to J. Nin of the CPT for the preparation of the samples.
References
1. ASM Handbook. Properties and Selection: Nonferrous Alloys and Special-Purpose Materials. 10 ed. ASM International Comitee Hand-book, 2, West Conshohocken, PA. p. 1328, 1992.
2. Starke Jr. EA, Staley, JT. Application of modern aluminum alloys to aircraft. Progress in Aerospace Sciences. 1996; 32(2-3):131-172. 3. Najjar D, Magnin T, Warner J. Influence of critical surface defects and
localized competition between anodic dissolution and hydrogen effects during stress corrosion cracking of a 7050 aluminium alloy. Materials Science and Engineering A. 1997;238(2):293-302.
4. Yue TM, Yan LJ, Chan CP, Dong CF, Man HC, Pang GKH. Excimer laser surface treatment of aluminum alloy AA7075 to improve corrosion resistance. Surface and Coatings Technology. 2004; 179(2-3):158-164. 5. Picas JA, Forn A, Rilla R, Martin E. HVOF thermal sprayed coatings on
aluminium alloys and aluminium matrix composites. Surface and Coat-ings Technology.2005; 20(1-4):1178-1181.
6. Fedrizzi L, Rossi S, Cristel R, Bonora PL. Corrosion and wear behaviour of HVOF cermet coatings used to replace hard chromium. Electrochimica Acta. 2004;49(17-18):2803-2814.
7. Sobolev VV, Guilemany JM, Nutting J. High Velocity Oxy-Fuel Spray-ing- Theory, Structure-Property Relationships and Applications. Maney, London; 2004. p. 397.
8. Souza VAD, Neville A. Linking electrochemical corrosion behaviour and corrosion mechanisms of thermal spray cermet coatings (WC– CrNi and WC/CrC–CoCr). Materials Science and Engineering A: Structural Materials: Properties, Microstructure and Processing. 2003; A352(1-2):202-211.
9. Guilemany JM, Espallargas N, Suegama PH, Benedetti AV. Comparative study of Cr3C2–NiCr coatings obtained by HVOF and hard chromium coatings. Corrosion Science. 2006; 48(10):2998-3013.
10. Suegama PH, Espallargas N, Guilemany JM, Fernández J, Benedetti AV. Electrochemical and Structural Characterization of Treated Cr3C2-NiCr Coatings. J. Electrochem. Soc. 2006; 153(10):B434-B445.
11. Suegama PH, Fugivara CS, Benedetti AV, Fernández J, Espallargas N, Delgado J, Guilemany JM. Microstructure and Electrochemical Stud-ies of Cr3C2-NiCr Coatings. In: Vargus EP, editor. New Researches on Electrochemistry, Chapter 4, Nova Science Publishers, Inc., N.Y.; ISBN 1-60021-304-9; 2007. p. 206.
12. Wielage B, Wank A, Pokhmurska H, Grund T, Rupprecht C, Reisel G, E Friesen. Development and trends in HVOF spraying technology. Surface and Coatings Technology. 2006; 201(5):2032-2037.
13. Chong PH, Man HC, Yue TM. Microstructure and wear properties of laser surface-cladded Mo–WC MMC on AA6061 aluminum alloy. Surface and Coatings Technology. 2001; 145(1-3):51-59.
14. Natishan PM, Lawrence SH, Foster RL, Lewisb J, Sartwell BD. Salt fog corrosion behavior of high-velocity oxygen-fuel thermal spray coatings compared to electrodeposited hard chromium. Surface and Coatings Technology. 2000; 130(2-3):218-223.
15. Espallargas N, Berget J, Guilemany JM, Benedetti AV, Suegama PH. Cr3C2–NiCr and WC–Ni thermal spray coatings as alternatives to hard chromium for erosion–corrosion resistance. Surface and Coatings Tech-nology.2007; in press.
16. Wenzelburger M, Escribano M, Gadow R. Modelling of thermally sprayed coatings on light metal substrates: layer growth and residual stress forma-tion. Surface and coatings technology. 2004; 180-181:429-435. 17. Suegama PH, Fugivara CS, Benedetti AV, Fernández J, Delgado J,
Guilemany JM. Electrochemical behavior of thermally sprayed stain-less steel coatings in 3.4% NaCl solution. Corrosion Science.2005; 47(3):605-620.
18. Guilemany JM, Fernandez J, Delgado J, Benedetti AV, Climent F. Ef-fects of thickness coating on the electrochemical behaviour of thermal spray Cr3C2–NiCr coatings. Surface and Coatings Technology. 2002; 153(2-3):107-113.
19. DD CEN/TS 1071-8 Advanced technical ceramics. Methods of test for ceramic coatings - Part 8: Rockwell indentation test for evaluation of adhesion. British Standard Institution (BSI) British Standards. London; 2004.
20. Rebecca AC, Geraldine LK. Aluminon: Its limited Application as a Rea-gent for the Detection of Aluminum Species. Journal of Histochemistry and Cytochemistry. 1985; 33(7):729-732.