*e-mail: [email protected]
Article presented at the 83rd General Session and Exhibition of the International Association for Dental Research, 9 a 12 de março de 2005, Baltimore, Maryland, EUA
Effect of Exposure Time
vs.
Irradiance on Knoop Hardness of Dental Composites
Américo Bortolazzo Correr, Mário Alexandre Coelho Sinhoreti*, Lourenço Correr-Sobrinho, Rubens Nisie Tango, Simonides Consani, Luis Felipe Jochins Schneider
Dental Materials, Piracicaba School of Dentistry, UNICAMP,
Av. Limeira 901, Bairro Areião, 13414-903 Piracicaba - SP, Brazil
Received: December 7, 2005; Revised: June 31, 2006
A comparison was made of the hardness of Z250 and Esthet-X composites light cured with different light sources. Cavities (3 mm diameter x 6 mm deep) were prepared in 240 bovine incisors. The composite was bulk inserted and light-cured using halogen light, LED or xenon plasma arc (PAC) with different irradiances and exposure times, maintaining the same energy density. The specimens were stored in an incubator at 37 °C for 24 hours prior to sectioning for hardness measurements. Three measurements were taken at each depth: surface, 1, 2, 3, 4 and 5 mm. The data were analyzed by ANOVA and Tukey’s test (p < 0.05). No statistically significant differences were found for LED up to 2 mm, for PAC up to 3 mm, and for halogen light up to 5 mm. Photoactivation with intermediate power density and exposure time resulted in the highest Knoop hardness values.
Keywords: composite resin, energy density, Knoop hardness, light curing
1. Introduction
Since the introduction of resin composite in dentistry in the late 1970 seconds, light-curing units (LCUs) and light curing methods have been in constant evolution. Light curing of resin composites with blue light has proven to be the best photoactivation method1.
Quartz-Tungsten-Halogen (QTH) “bulbs” have been the most com-mon light sources in handheld dental curing units. Halogen LCUs used to polymerize dental composites have several drawbacks despite their popularity. Operating with a white halogen bulb filtered by a dielectric pass-band filter to remove the undesirable wavelengths, conventional composite-curing lamps operate in the deep blue re-gion of the spectrum. However, this type of equipment still emits a considerable amount of other wavelengths. The spectral impurities of the conventional LCUs deliver several wavelengths that are highly absorbed by dental materials, inducing heating to tooth and resin during the curing process2. Moreover, halogen bulbs (whose
effec-tive lifetime is limited from about 40 to 100 hours), reflectors and filters degrade over time due to high operating temperatures and to the intense heat produced during curing cycles3.
Recently, light emitting diodes (LEDs) and high power density devices such as plasma arc curing lights (PACs) and argon ion lasers were introduced for resin composite photoactivation as an alternative to QTH curing units. LEDs have a lifetime of more than 10,000 hours and undergo little degradation of light output over time3. They use
junctions of doped semiconductors (p-n junctions) to generate light, thus requiring no filters to produce blue light, and are resistant to shock and vibration. Their relatively low power consumption makes them suitable for portable use. The narrower spectral output of these blue LEDs of 440 to 490 nm falls within the camphoroquinone (CQ) absorption spectrum2.
Long curing time is inconvenient for the patient, impractical with children, uncomfortable for the dentist, and makes the treatment more expensive because of extra time in the dentist’s chair. PACs were introduced to reduce light-curing time. These devices reduce the exposure time through the application of high irradiation. The light is emitted by glowing plasma, which is composed of a gaseous mixture of ionized molecules and electrons. PAC units are characterized by
a very high output4. A question that may be raised involves the cure
rate and its influence on gap formation. High curing rates tend to result in augmented wall-to-wall contraction5.
The narrow wavelength emitted by LED is an advantage when CQ is used as the initiator system of the resin composite, because optical filters are not necessary to limit the wavelength pass by. Moreover, it induces lower overheating of teeth and resins during the curing process2. Nevertheless, the LEDs currently on the market promote
considerable heating during light curing6. However, when the main
photoinitiator system of the composite is not CQ, the activation can-not take place efficiently3,7,8. Thus, a low degree of conversion can
produce composites with poor mechanical properties9-12, and higher
cytotoxity13.
The composite requires an appropriate energy density to initiate its polymerization. This high energy density is also required to ensure a high degree of conversion9,14. The energy density is obtained by
multiplying the power density by the exposure time. This amount of energy needed to obtain reliable mechanical properties can vary depending on the shade, opacity, initiators and composition of the composites. The incremental volume and cavity configuration also play an important role15-17. The power density should be
compat-ible with the absorption spectrum of photoinitiator systems. CQ is the photoinitiator most commonly used in dental composites. The maximum absorption peak fall within the blue band of visible light, at about 468 nm18.
When the composite receives similar energy densities, similar degrees of conversion and polymerization depth will be obtained, regardless of the light-curing method. Therefore, a similar degree of conversion and polymerization depth can be obtained by applying low power density through longer exposure times or high power density in shorter exposure times, since the same energy density is maintained15,19,20.
cav-ity is 8 mm or more17. Power density decreases as the curing tip is
moved farther from the resin composite restorative material21. Correr
Sobrinho et al.22 and Caldas et al.23 found that resin composite Knoop
Hardness Number (KHN) decreased as the distance between the LCU tip and the resin composite increased.
Several combinations of light modulation have been used for light-curing of composites aiming to minimize polymerization shrinkage stress. However, there are still doubts about the limits of modulation of power density and exposure time that would suffice to promote good composite polymerization and, hence, better physical and mechanical properties. This study therefore purported to deter-mine the effect of exposure time vs. power density, maintaining the same energy density, on the Knoop hardness of two dental composites at several depths using three distinct light-curing units.
2. Experimental
For this study, 240 bovine incisors were embedded in PVC molds with polystyrene resin (Piraglass, Piracicaba, SP, Brazil), maintain-ing the buccal face exposed. The buccal surface was ground flat in a polishing machine APL-4 (Arotec Ind. Com., Cotia, SP, Brazil) using 180 grit sandpaper (Carborundum, Saint-Gobain Abrasivos Ltda, Cruz de Rebouças/Igaraçu, PE, Brazil). Cylindrical cavities (6 mm depth and 3 mm diameter) were prepared under water-cooling with diamond burs #3018HL (Metalúrgica FAVA Ind. e Com. Ltda, Franco da Rocha, SP, Brazil) mounted on an air turbine (Kavo do Brasil S.A. Ind. e Com., Joinvile, SC, Brazil). The samples were divided into two groups of 120 specimens each, according to the composite applied: Z250 (3M/ESPE Dental Products, St Paul, MN, USA) or Esthet-X (Dentsply/Caulk, Milford, DE, USA), shade A3 (Table 1). The cavities were air-dried and composites Z250 or Esthet-X were bulk-inserted. A polyester strip was seated on the specimen surface and digitally pressed to remove excess composite. The composites were light-cured with a halogen lamp (XL2500, 3M/ESPE, St Paul, MN, USA), LED (Ultrablue Is, D.M.C. Equipamentos Ltda. São Carlos, São Paulo, SP, Brazil) or PAC (Apollo 95E, DMD, Westlake Village, CA, USA), according to the protocols set forth in Table 2. Eight specimens per group were prepared.
The maximum power densities of 700 mW / cm2, 440 mW / cm2,
1700 mW / cm2 were found for QTH, LED and PAC, respectively,
checked with a digital radiometer (Dental Hilux Curing Light to Put, Dental Benlioglu Inc., Binnaz SK 1-6 Kavaklidere, Ankara, Turkey). In line with the manufacturers’ recommendations, the light-curing exposure time of the Z250 and Esthet-X composites with QTH and LED was 20 seconds, and with PAC it was 3 seconds. Therefore, the groups photoactivated using QTH for 20 s / 700 mW / cm2, LED for
20 s / 440 mW / cm2 and PAC for 3 s / 1700 mW / cm2 were
consid-ered the control groups.
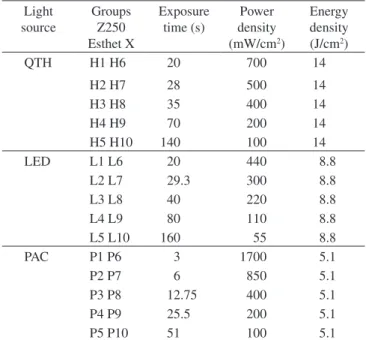
The energy densities of the control groups for QTH, LED and PAC were 14 J / cm2, 8.8 J / cm2, and 5.1 J / cm2, respectively (Table 2).
To reduce the power densities, the LCU tip was moved away from the composite surface. To standardize the photoactivation distance,
acrylic resin spacers (JET, Artigos Odontológicos Clássico, São Paulo, SP, Brazil) were interposed between the composite surface and the LCU tip (Figure 1). For photoactivation at low power densities, the exposure times were increased to match the energy density of the control groups (Table 2).
After light-curing, the dry specimens were stored in an incuba-tor at 37 °C for 24 h ± 1 in the dark. The specimens were sectioned under water-cooling, in the mesiodistal direction, using a diamond wafering blade (Extec Corp., Enfield, CT, USES) mounted on a metallographic cutter (Isomet 1000, Buheler, Lake Bluff, IL, USES). After sectioning, the restorations were ground and polished using 320, 400, 600 and 1200 grit sandpaper (Carborundum, Saint-Gobain Abra-sivos Ltda, Cruz de Rebouças/Igaraçu, PE, Brazil) on an automated polisher under water-cooling. The specimens were dried and their Knoop hardness measured in a microhardness tester (HMV-2000, Shimadzu, Tokyo, Japan) under a load of 50 g for 15 seconds. The Knoop hardness readings were taken at the surface and at 1, 2, 3, 4 and 5 mm depths, three readings per depth, and the average hardness was calculated.
To evaluate the polymerization depth, the hardness relation Dx / D0 was used, e.g., bottom/surface hardness relation (above 0.8 indicates that the composite was properly polymerized24,25), in
which D0 represents the hardness on the top surface and Dx represents the hardness at 1, 2, 3, 4 or 5 mm depths.
The data were subjected to a three-way ANOVA split-plot design, followed by Tukey’s test, both at a 5% significance level.
Table 1. Composition of Z250 and Esthet-X composites (according to the manufacturer’s information).
Resin composite Composition Batch
Organic matrix Filler
Z250 BisGMA, UDMA, BisEMA
Camphoroquinone (initiator)
Zirconia/silica 0.19 – 3.3 µm 60% (vol.) 3CK
Esthet X Bis-GMA, Bis-EMA, TEGDMA Camphoroquinone
Stabilizers
Barium-fluoro-alumino-boro-silicate < 1 µm Highly dispersed silicon dioxide 0.04 µm 60% (vol.)
0110161
Table 2. Light curing methods for QTH, LED, and PAC.
Light source
Groups Z250 Esthet X
Exposure time (s)
Power density (mW/cm2)
Energy density (J/cm2)
QTH H1 H6 20 700 14
H2 H7 28 500 14
H3 H8 35 400 14
H4 H9 70 200 14
H5 H10 140 100 14
LED L1 L6 20 440 8.8
L2 L7 29.3 300 8.8
L3 L8 40 220 8.8
L4 L9 80 110 8.8
L5 L10 160 55 8.8
PAC P1 P6 3 1700 5.1
P2 P7 6 850 5.1
P3 P8 12.75 400 5.1
P4 P9 25.5 200 5.1
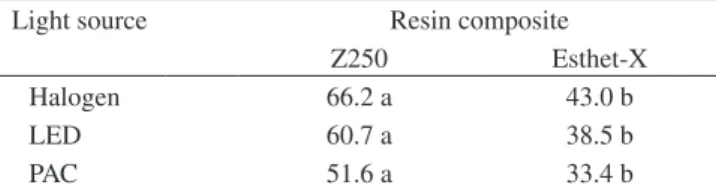
Table 3. Mean Knoop hardness of Esthet-X and Z250 composites, regardless of light-curing method and depth.
Light source Resin composite
Z250 Esthet-X
Halogen 66.2 a 43.0 b
LED 60.7 a 38.5 b
PAC 51.6 a 33.4 b
Means followed by distinct small letter represent statistical significant differ-ences in the row by Tukey´s test (5%).
(a)
(b)
(c)
Figure 1. a) Acrylic resin spacers with a central hole for light to pass through; b) Spacers of different heights according to the intensity of light required; and c) Spacer positioned over the specimen during light-curing.
3. Results and Discussion
The results of this study revealed that the Z250 composite pre-sented a statistically higher (p < 0.05) mean Knoop hardness than the Esthet-X composite (Table 3). The composites’ hardness is influenced by several factors, such as composition of the organic matrix26, type
and amount of filler particles27 and also the degree of conversion28.
The composition of the organic matrix of Z250 is mainly BisGMA, UDMA and BisEMA, and the inorganic filler is zirconia/silica (60%vol). The composition of the organic matrix of Esthet-X is BisGMA, BisEMA and TEGDMA, and the inorganic fillers are a combination of barium fluoroaluminoborosilicate glass and highly dispersed silicon dioxide (60%vol). The higher Knoop hardness values for Z250 may be attributed to differences in the composition of Z250 and Esthet-X filler and organic matrix. Composites with harder filler particles exhibit higher surface hardness26.
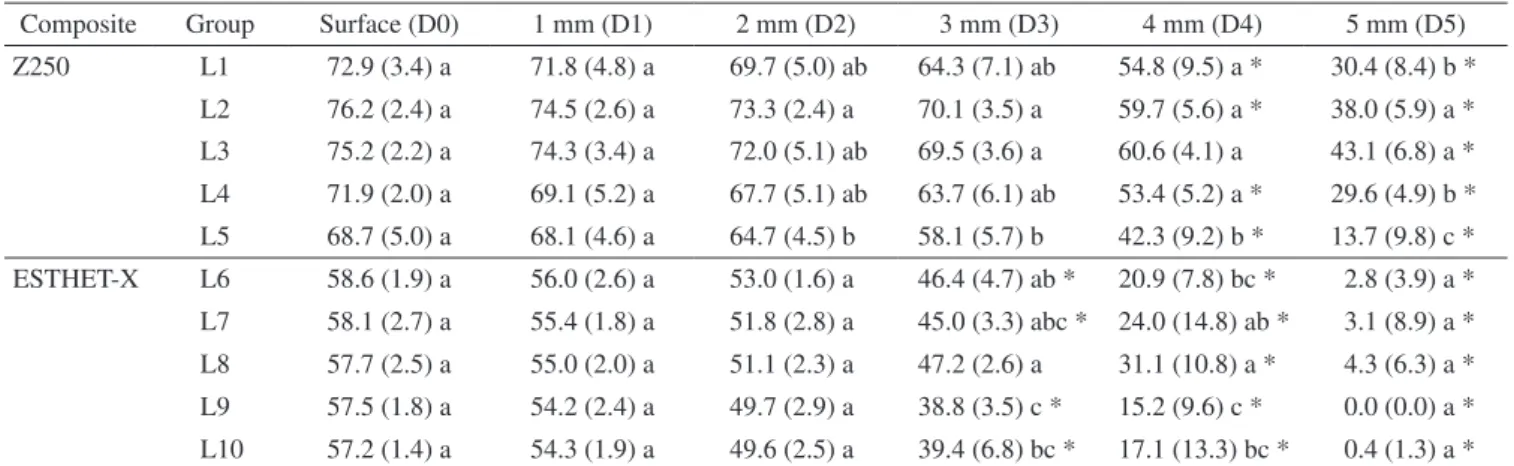
With the photoactivation method, intermediate power density and exposure time produced higher mean Knoop hardnesses. With QTH (Table 4), there were statistical differences among photoactivation methods only at a 5 mm depth. For Z250, the mean Knoop hardness of group H3 was statistically higher than that of groups H4 and H5. For Esthet-X, the mean Knoop hardness of groups H8 and H9 was statistically higher than that of groups H7 and H6. When LED was used to light cure Z250 (Table 5), significant differences were found starting from 2 mm depth, with group L3 showing a statistically higher Knoop hardness than L5. For Esthet-X, there were statistical differences among groups at 3 mm depth, with group L8 displaying the highest mean Knoop hardness and L9 the lowest. For PAC (Ta-ble 6), statistical differences were found among the photoactivation methods starting from 3 mm depth. The mean Knoop hardness of group P3 was statistically higher than that of group P1, for Z250. For Esthet-X, the mean Knoop hardness of groups P7, P8, P9 and P10 was statistically higher than that of group P6. Currently, several methods of light modulation are used to light cure composites aim-ing to minimize the stress generated by polymerization shrinkage. Regardless of the light modulation method employed, it is advisable to use energy densities similar to those supplied by conventional photoactivation (continuous mode). Several studies have shown that the degree of conversion is more dependent on the energy density supplied to the composite than on the photoactivation method9,29.
Hardness is a mechanical property indirectly related to the degree of conversion of composites. Higher mean hardness can be obtained by increasing the degree of conversion, but it also depends on the light curing method28,30,31.
In this study, no statistical differences were found among light curing methods up to 2 mm depth with the exception of group L5. This finding is in agreement with Rueggeberg et al.16 and Sakaguchi
and Berge32, who concluded that on the top surface of composites,
com-Table 5. Mean Knoop hardness and standard deviation ( ) for Z250 and Esthet-X composites photoactivated at several depths using LED.
Composite Group Surface (D0) 1 mm (D1) 2 mm (D2) 3 mm (D3) 4 mm (D4) 5 mm (D5)
Z250 L1 72.9 (3.4) a 71.8 (4.8) a 69.7 (5.0) ab 64.3 (7.1) ab 54.8 (9.5) a * 30.4 (8.4) b *
L2 76.2 (2.4) a 74.5 (2.6) a 73.3 (2.4) a 70.1 (3.5) a 59.7 (5.6) a * 38.0 (5.9) a *
L3 75.2 (2.2) a 74.3 (3.4) a 72.0 (5.1) ab 69.5 (3.6) a 60.6 (4.1) a 43.1 (6.8) a *
L4 71.9 (2.0) a 69.1 (5.2) a 67.7 (5.1) ab 63.7 (6.1) ab 53.4 (5.2) a * 29.6 (4.9) b *
L5 68.7 (5.0) a 68.1 (4.6) a 64.7 (4.5) b 58.1 (5.7) b 42.3 (9.2) b * 13.7 (9.8) c *
ESTHET-X L6 58.6 (1.9) a 56.0 (2.6) a 53.0 (1.6) a 46.4 (4.7) ab * 20.9 (7.8) bc * 2.8 (3.9) a *
L7 58.1 (2.7) a 55.4 (1.8) a 51.8 (2.8) a 45.0 (3.3) abc * 24.0 (14.8) ab * 3.1 (8.9) a *
L8 57.7 (2.5) a 55.0 (2.0) a 51.1 (2.3) a 47.2 (2.6) a 31.1 (10.8) a * 4.3 (6.3) a *
L9 57.5 (1.8) a 54.2 (2.4) a 49.7 (2.9) a 38.8 (3.5) c * 15.2 (9.6) c * 0.0 (0.0) a *
L10 57.2 (1.4) a 54.3 (1.9) a 49.6 (2.5) a 39.4 (6.8) bc * 17.1 (13.3) bc * 0.4 (1.3) a *
Mean values followed by different small letters in the column for each composite represent a statistically significant difference (5%); and * Indicates that the Dx / D0 relation was lower than 0.8 (D0 represents the hardness on the top surface and Dx the hardness at 1, 2, 3, 4, or 5 mm depths).
Table 6. Mean Knoop hardness and standard deviation ( ) for Z250 and Esthet-X composites photoactivated at several depths using PAC.
Composite Group Surface (D0) 1 mm (D1) 2 mm (D2) 3 mm (D3) 4 mm (D4) 5 mm (D5)
Z250 P1 72.5 (3.9) a 68.1 (3.8) a 64.7 (4.6) a 52.6 (5.3) b * 24.1 (4.6) c * 0.0 (0.0) b *
P2 74.1 (3.6) a 72.3 (3.8) a 68.2 (4.2) a 59.0 (7.2) ab 40.9 (9.0) ab * 5.0 (5.9) b *
P3 71.8 (4.1) a 70.9 (4.6) a 68.3 (3.0) a 61.3 (4.7) a 47.3 (9.1) a * 12.8 (13.9) a *
P4 74.9 (3.0) a 72.5 (2.2) a 69.0 (3.5) a 59.5 (4.7) ab * 35.5 (4.6) b * 1.8 (5.2) b *
P5 72.9 (4.8) a 69.9 (4.9) a 66.4 (4.0) a 56.2 (3.0) ab * 34.1 (6.5) b * 0.0 (0.0) b *
ESTHET-X P6 56.8 (4.1) a 54.1 (4.0) a 45.8 (5.7) a 20.2 (8.8) b * 0.4 (1.2) b * 0.0 (0.0) a *
P7 59.2 (1.8) a 56.1 (2.3) a 50.3 (4.4) a 33.7 (8.5) a * 11.0 (9.6) a * 0.0 (0.0) a *
P8 58.1 (3.1) a 54.5 (1.1) a 50.4 (2.7) a 37.4 (9.8) a * 14.4 (12.2) a * 0.0 (0.0) a *
P9 57.7 (2.2) a 54.8 (2.6) a 48.6 (5.4) a 30.1 (13.3) a * 7.8 (8.4) ab * 0.0 (0.0) a *
P10 56.8 (3.4) a 54.2 (3.4) a 47.0 (2.7) a 33.5 (11.9) a * 9.1 (10.3) a * 0.0 (0.0) a *
Mean values followed by a different small letter in the column for each composite represents a statistically significant difference (5%); and * Indicates that the Dx / D0 relation was lower than 0.8 (D0 represents the hardness on the top surface and Dx the hardness at 1, 2, 3, 4, or 5 mm depths).
Table 4. Mean Knoop hardness and standard deviation ( ) for Z250 and Esthet-X composites photoactivated at several depths using QTH.
Composite Group Surface (D0) 1 mm (D1) 2 mm (D2) 3 mm (D3) 4 mm (D4) 5 mm (D5)
Z250 H1 74.5 (2.2) a 72.8 (2.2) a 71.0 (2.6) a 67.9 (3.7) a 60.2 (4.9) a 45.3 (9.9) ab *
H2 74.8 (2.8) a 73.6 (4.5) a 71.4 (3.6) a 69.1 (2.7) a 62.1 (3.9) a 47.5 (3.5) ab *
H3 75.7 (3.1) a 75.1 (2.9) a 73.9 (2.1) a 72.0 (3.8) a 64.1 (2.9) a 52.0 (4.4) a *
H4 75.0 (2.4) a 72.9 (4.6) a 70.2 (5.3) a 66.6 (6.3) a 59.2 (6.3) a * 42.8 (10.0) b *
H5 75.0 (2.6) a 74.9 (2.6) a 73.1 (2.8) a 69.1 (3.3) a 61.6 (4.1) a 42.3 (7.8) b *
ESTHET-X H6 57.8 (2.5) a 55.9 (1.7) a 53.4 (2.5) a 49.4 (4.0) a 31.3 (7.1) a * 6.8 (9.6) b *
H7 59.3 (2.9) a 56.8 (2.2) a 53.9 (2.0) a 49.1 (0.9) a 33.3 (5.4) a * 8.3 (9.6) b *
H8 59.5 (1.9) a 56.5 (2.0) a 53.4 (2.7) a 47.7 (3.3) a 37.5 (10.6) a * 17.3 (12.6) a *
H9 57.0 (3.1) a 54.7 (4.2) a 50.1 (4.2) a 47.0 (4.5) a 33.0 (8.1) a * 15.7 (10.5) a *
H10 56.6 (3.8) a 53.0 (4.0) a 50.1 (4.3) a 42.7 (4.9) a * 31.6 (9.4) a * 11.7 (13.8) ab *
Mean value followed by a different small letter in the column for each composite represents a statistical significant difference (5%); and * Indicates that the Dx / D0 relation was lower than 0.8 (D0 represents the hardness on the top surface and Dx is the hardness at 1, 2, 3, 4, or 5 mm depths).
posite, power density is greatly reduced due to light scattering and absorption, thus decreasing the effectiveness of polymerization1.
Therefore, the reduced power density in deeper regions causes the degree of conversion and Knoop hardness to decrease. Only optimal
curing should be considered for the inner parts, since pulpal tissues are affected by the leaching of unpolymerized components13.
ex-posure times with high power density or long exex-posure times with low power density, in deeper layers. For groups light-cured with low power density and long exposure times, due to light scattering and absorption, little light reached the deep layers, producing composites with poorer mechanical properties. LCUs emitting high power density during the first 10-15 seconds of photopolymerization may cause fast network formation in the superficial layer of the resin composite. This reduces light transmittance throughout the material due to changes in the optical properties of this zone12. Moreover, the short irradiation
time of the plasma arc unit may be inadequate for efficient light dif-fusion through deep regions. Subsequently, this leads to limitations in the reaction between the excited CQ molecule and amine33. The
frequency of cross-links is unaffected by the rate of initiation, but the distance between cross-links is smaller than the predicted kinetic chain lengths34. Therefore, this shorter distance between cross-links
may explain the differences in network light transmittance. Since the same energy density is maintained, light-curing units with low power density require longer exposure times to produce similar degrees of conversion9. In the present study, similar Knoop
hardnesses were observed with similar energy densities only in shal-low regions. At the top surface, only irradiation time is a significant factor contributing to monomer conversion16,32. However, due to light
scattering and absorption through the bulk of the composite, only a few photons of the low power density LCUs reach deeper layers, despite longer exposure times20. Therefore, the degree of conversion
and the Knoop hardness in deeper layers decrease.
The highest mean Knoop Hardnesses in deep layers were obtained with resin composites light cured with intermediate exposure times and power densities. Due to the slower initial polymerization rate, the cross-link density is lower than in resin composite light cured with high power density35. The lower initial power density, associated with longer
exposure times, allows more photons to reach deeper layers, promoting better polymerization and higher mean Knoop hardnesses.
The bottom/surface hardness relation (above 0.8 indicates that the composite was properly polymerized) showed that Esthet-X presented appropriate polymerization up to 2 mm depth using halogen light, LED and PAC. When Z250 was used, the bottom/surface hardness relation was adequate up to 2 mm for PAC and up to 3 mm for QTH and LED. The mean Knoop hardnesses decreased from the surface toward deeper regions. The polymerization depth of photoactivated composites depends on the composition of restorative material, its shade and translucency, power density and the distance between the LCU tip and the composite surface36. All these factors influence the
amount of light that reaches deep layers of composite. Thus, the degree of conversion in these layers is lower, and the mechanical properties such as Knoop hardness are negatively influenced9-12.
An ideal bottom-to-top hardness ratio of 1:1 should be achieved for effective polymerization, since the degree of polymerization should be the same throughout the depth of the composite. Light scattering and attenuation may have accounted for minor differences in hardness between the top surfaces and bottom of the light-activated composites evaluated in this study. It has been suggested that the hardness gradient should not exceed 10-20% (the hardness ratio should be greater than 0.8) for adequately photoactivated resin composites24,25. The hardness
ratio of all light curing regimens at 2 mm was above 0.8. The hardness ratios of H10, L6, L7, L9, L10, P1, P4, P5, P6, P7, P8, P9 and P10 at 3 mm depth were lower than 0.8. The transmission coefficient is influenced by light wavelength, refractive index of fillers and resin matrix, shade, opacity, filler type and size, and loading37. Light
scat-tering is related to the filler’s particle size and it has been suggested that light attenuation is maximized when the filler particle size is half the wavelength of the activating light1. Smaller filler particles scatter
more light than composites with larger and fewer glass particles26. The
mean size of Esthet-X fillers is smaller than that of Z250 fillers (see Table 1), leading to differences in light scattering and transmittance through the composite. This allows lower power densities to reach deeper layers and polymerize the resin composite. In addition, the depth of cure may be correlated to the composition of the monomers used in dental composites. The differences in composites’ resin matrix, leading to different characteristics in light transmission properties, also determine the conversion profile and depth of cure.
4. Conclusions
The Knoop Hardness of Z250 was higher than that of Esthet-X. No statistical difference was found up to 2 mm depth among the combinations of power density and exposure time for all the LCUs and composites, except for Z250 light-cured with LED, which was influenced from 1 mm depth on. In deeper regions, intermediate power density and exposure time produced composites with the highest Knoop hardness values. The composites presented reliable polymerization up to 2 mm depth for LED and PAC, and 3 mm for QTH. At the same energy density, the modulation methods using intermediate intensities promoted similar or better results than those with high or low power density. Clinically, these methods could be alternatives to the traditional methods of photoactivation, even with longer chair time to light-cure the composites.
References
1. Ruyter IE, Oysaed H. Conversion in different depths of ultraviolet and
visible light activated composite materials. Acta Odontologica
Scandi-navica. 1982; 40(3):179-192.
2. Kurachi C, Tuboy AM, Magalhaes DV, Bagnato VS. Hardness evaluation of a dental composite polymerized with experimental LED-based devices.
Dental Materials. 2001; 17(4):309-315.
3. Jandt KD, Mills RW, Blackwell GB, Ashworth SH. Depth of cure and compressive strength of dental composites cured with blue light emitting
diodes (LEDs). Dental Materials. 2000; 16(1):41-47.
4. Peutzfeldt A, Sahafi A, Asmussen E. Characterization of resin
compos-ites polymerized with plasma arc curing units. Dental Materials. 2000;
16(5):330-336.
5. Feilzer AJ, Dooren LH, de Gee AJ, Davidson CL. Influence of light intensity on polymerization shrinkage and integrity of restoration-cavity
interface. European Journal of Oral Sciences. 1995; 103(5):322-326.
6. Uhl A, Mills RW, Jandt KD. Polymerization and light-induced heat of
dental composites cured with LED and halogen technology. Biomaterials.
2003; 24(10):1809-1820.
7. Soh MS, Yap AU, Siow KS. The effectiveness of cure of LED and
halo-gen curing lights at varying cavity depths. Operative Dentistry. 2003;
28(6):707-715.
8. Uhl A, Sigusch BW, Jandt KD. Second generation LEDs for the
polym-erization of oral biomaterials. Dental Materials. 2004; 20(1):80-87.
9. Halvorson RH, Erickson RL, Davidson CL. Energy dependent
polym-erization of resin-based composite. Dental Materials. 2002;
18(6):463-469.
10. Emami N, Soderholm KJ, Berglund LA. Effect of light power density
variations on bulk curing properties of dental composites. Journal of
Dentistry. 2003; 31(3):189-196.
11. Price RB, Felix CA, Andreou P. Effects of resin composite composition
and irradiation distance on the performance of curing lights. Biomaterials.
2004; 25(18):4465-4477.
12. Rahiotis C, Kakaboura A, Loukidis M, Vougiouklakis G. Curing efficiency
of various types of light-curing units. European Journal of Oral Sciences.
2004; 112(1):89-94.
13. Caughman WF, Caughman GB, Shiflett RA, Rueggeberg F, Schuster GS. Correlation of cytotoxicity, filler loading and curing time of dental
14. Miyazaki M, Oshida Y, Moore BK, Onose H. Effect of light exposure on
fracture toughness and flexural strength of light-cured composites. Dental
Materials. 1996; 12(6):328-332.
15. Nomoto R, Uchida K, Hirasawa T. Effect of light intensity on
polymeri-zation of light-cured composite resins. Dental Materials Journal. 1994;
13(2):198-205.
16. Rueggeberg FA, Caughman WF, Curtis JW, Jr. Effect of light intensity
and exposure duration on cure of resin composite. Operative Dentistry.
1994; 19(1):26-32.
17. Hansen EK, Asmussen E. Visible-light curing units: correlation between
depth of cure and distance between exit window and resin surface. Acta
Odontologica Scandinavica. 1997; 55(3):162-166.
18. Nomoto R. Effect of light wavelength on polymerization of light-cured
resins. Dental Materials Journal. 1997; 16(1):60-73.
19. Rueggeberg F. Contemporary issues in photocuring. Compendium of
Continuing Education in Dentistry. 1999; 25(Supplement Issue):S4-15.
20. Halvorson RH, Erickson RL, Davidson CL. An energy conversion rela-tionship predictive of conversion profiles and depth of cure for resin-based
composite. Operative Dentistry. 2003; 28(3):307-314.
21. Pires JA, Cvitko E, Denehy GE, Swift EJ, Jr. Effects of curing tip distance
on light intensity and composite resin microhardness. Quintessence
International. 1993; 24(7):517-521.
22. Sobrinho LC, de Lima AA, Consani S, Sinhoreti MA, Knowles JC. Influence of curing tip distance on composite Knoop hardness values.
Brazilian Dental Journal. 2000; 11(1):11-17.
23. Caldas DB, de Almeida JB, Correr-Sobrinho L, Sinhoreti MA, Consani S. Influence of curing tip distance on resin composite Knoop hardness
number, using three different light curing units. Operative Dentistry.
2003; 28(3):315-320.
24. Yearn JA. Factors affecting cure of visible light activated composites.
International Dental Journal. 1985; 35(3):218-225.
25. Pilo R, Cardash HS. Post-irradiation polymerization of different anterior
and posterior visible light-activated resin composites. Dental Materials.
1992; 8(5):299-304.
26. Craig R, Powers JM, Restorative Dental Materials, 11th ed. St Louis:
Mosby; 2002.
27. Kim KH, Ong JL, Okuno O. The effect of filler loading and morphology
on the mechanical properties of contemporary composites. Journal of
Prosthetic Dentistry. 2002; 87(6):642-649.
28. Ferracane JL. Correlation between hardness and degree of conversion
during the setting reaction of unfilled dental restorative resins. Dental
Materials. 1985; 1(1):11-14.
29. Friedman J, Hassan R. Comparison study of visible curing lights and
hard-ness of light-cured restorative materials. Journal of Prosthetic Dentistry.
1984; 52(4):504-506.
30. Rueggeberg FA, Craig RG. Correlation of parameters used to estimate
monomer conversion in a light-cured composite. Journal of Dental
Re-search. 1988; 67(6):932-937.
31. Vandewalle KS, Ferracane JL, Hilton TJ, Erickson RL, Sakaguchi RL. Effect of energy density on properties and marginal integrity of posterior
resin composite restorations. Dental Materials. 2004; 20(1):96-106.
32. Sakaguchi RL, Berge HX. Reduced light energy density decreases post-gel contraction while maintaining degree of conversion in composites.
Journal of Dentistry. 1998; 26(8):695-700.
33. Yap AU, Ng SC, Siow KS. Soft-start polymerization: influence on
ef-fectiveness of cure and post-gel shrinkage. Operative Dentistry. 2001;
26(3):260-266.
34. Lovell LG, Lu H, Elliott JE, Stansbury JW, Bowman CN. The effect of
cure rate on the mechanical properties of dental resins. Dental Materials.
2001; 17(6):504-511.
35. Soh MS, Yap AU. Influence of curing modes on crosslink density in
polymer structures. Journal of Dentistry. 2004; 32(4):321-326.
36. Leloup G, Holvoet PE, Bebelman S, Devaux J. Raman scattering deter-mination of the depth of cure of light-activated composites: influence of
different clinically relevant parameters. Journal of Oral Rehabilitation.
2002; 29(6):510-515.
37. Kawaguchi M, Fukushima T, Miyazaki K. The relationship between cure depth and transmission coefficient of visible-light-activated resin