Muscle strength and body composition in severe
obesity
Alexandre Vieira Gadducci,I,*Roberto de Cleva,IGabriela Correia de Faria Santare´m,I Paulo Roberto Santos Silva,IIJulia Maria D’Andre´a Greve,IIMarco Aure´lio SantoI
IDepartamento de Gastroenterologia, Hospital das Clinicas HCFMUSP, Faculdade de Medicina, Universidade de Sao Paulo, Sao Paulo, SP, BR.IIInstituto de
Ortopedia e Traumatologia, Hospital das Clinicas HCFMUSP, Faculdade de Medicina, Universidade de Sao Paulo, Sao Paulo, SP, BR.
OBJECTIVE:The aim of our study was to evaluate associations between maximum voluntary contraction torques of the lower limbs and body composition for subjects with severe obesity.
METHODS: Body composition was evaluated by bioelectrical impedance analysis, and maximum voluntary
contraction torques of the lower limbs were measured using an isokinetic dynamometer. One hundred thirty-two patients were enrolled (100 females and 32 males). Eighty-seven patients had a body mass index between 40 and 49.9 kg/m2(the A group), and 45 patients had a body mass index between 50 and 59.9 kg/m2(the B group).
RESULTS:Absolute extension and flexion torques had weak associations with fat-free mass but a moderate association with absolute extension torque and fat-free mass of the lower limbs. There were no significant differences between the A and B groups with respect to absolute extension and flexion torques. For the A group, absolute extension and flexion torques were moderately associated with fat-free mass and with fat-free mass of the lower limbs. For the B group, there were only moderate associations between absolute extension and flexion torques with fat-free mass of the lower limbs.
CONCLUSIONS:Our findings demonstrate that both groups exhibited similar absolute torque values. There were weak to moderate associations between absolute extension and flexion torques and fat-free mass but a moderate association with fat-free mass of the lower limbs. Individuals with severe obesity should strive for greater absolute torques, fat-free mass and especially fat-free mass of the lower limbs to prevent functional limitations and physical incapacity.
KEYWORDS: Obesity; Body Composition; Muscle Strength.
Gadducci AV, de Cleva R, Santare´m GC, Silva PR, Greve JM, Santo MA. Muscle strength and body composition in severe obesity. Clinics. 2017;72 (5):272-275
Received for publication onOctober 7, 2016;First review completed onDecember 21, 2016;Accepted for publication onJanuary 12, 2017
*Corresponding author. E-mail: [email protected]
’ INTRODUCTION
Severe obesity (1) is associated with arterial hypertension, dyslipidemia, diabetes (2), metabolic syndrome (3), muscu-loskeletal problems such as osteoarthritis (4), reduced mobility (5) and gait disturbances (6). Excessive fat mass (FM) contri-butes to changes in the strength and endurance of skeletal muscles (7). Mid-thigh muscle mass is approximately 2.5 times that of fat mass, but individuals who are obese have increa-sed intra- (fat within muscle cells) and intermuscular fat (fat between muscle cells) (8), establishing a negative influence on force generation capacity and functional independence. The functional capacity of a skeletal muscle can be assessed based on the muscle’s ability to produce force. Absolute strength (9)
(the force exerted by an individual) is important for the execution of normal daily activities. Relative strength (9) (an individual’s force relative to body mass) is particularly useful for comparing individuals with different body dimensions.
Certain studies of obese patients have demonstrated that these subjects exhibit elevated absolute maximum voluntary contraction (MVC) torques (10) but reduced muscle strength relative to body weight (11) and to fat-free mass (FFM) than normal weight patients (12).
Nevertheless, no studies have evaluated the associations between lower limb MVC torques and body composition in patients with severe obesity. We hypothesized that segmental body composition might better determine the association between FFM of the lower limbs and MVC torque.
The aim of our study was to evaluate the associations between MVC torques of the lower limbs and body composi-tion for subjects with severe obesity.
’ METHODS
We consecutively evaluated 155 patients with severe obesity undergoing bariatric surgery in the Bariatric and
DOI:10.6061/clinics/2017(05)03
Copyright&2017CLINICS–This is an Open Access article distributed under the terms of the Creative Commons License (http://creativecommons.org/licenses/by/ 4.0/) which permits unrestricted use, distribution, and reproduction in any medium or format, provided the original work is properly cited.
No potential conflict of interest was reported.
272
Metabolic Surgical Unit of the Hospital das Clínicas, Univer-sity of São Paulo Medical School. The inclusion criteria were age between 18 and 60 years, a body mass index (BMI) between 40 and 60 kg/m2and a Timed Up and Go (TUG) p10 seconds. The exclusion criteria were as follows: patients with functional disability (TUG 410) (13), treatment with
steroid medication for any reason or the use of artificial devices such as an orthosis or a prosthesis. Twenty-three patients were excluded: 5 subjects with BMI o40 kg/m2, 7 with BMI 460 kg/m2, and 11 with musculoskeletal
dis-orders (7 subjects with TUG results 410 seconds and 4
subjects with artificial devices). Then, 132 patients (100 females and 32 males) were enrolled in the study, including 87 patients with a BMI between 40 and 49.9 kg/m2 (the A group) and 45 patients with a BMIX50 kg/m2(the B group).
Body composition was determined by bioelectrical impe-dance analysis (BIA) under constant conditions (with sub-jects appropriately hydrated and at the same time of day). The body composition analyzer (InBody230, Biospace Co., Gangnam-gu, Seoul, South Korea) was a segmental impe-dance device that uses a tetrapolar 8-point tactile electrode system, and the measured weight range was 10 to 250 kg. Impedance measurements were performed by utilizing 2 different frequencies (20 and 100 kHz) at each segment (the right arm, left arm, trunk, right leg, and left leg). The participant was positioned in an orthostatic position on a platform with lower electrodes for the feet and two brackets (the upper electrodes) gripped on hands. Data output was calculated in percentages (%) and included FM, FFM, trunk FFM, and appendicular FFM (the sum of the FFM values for the right arm, left arm, right leg, and left leg). The Biodexs Multi-joint System 3 dynamometer (Biodex Medical Systems, Inc., Shirley, NY, USA) was used to measure isokinetic extension (Ext) and flexion (Flex) MVC torques for both legs. The dynamometer was calibrated before each test, and a strap was used to attach the dynamometer’s arm 3 cm above the lateral malleolus. Straps were also applied across the chest, pelvis and mid-thigh regions. Participants remained seated on the dynamometer chair, with the hip and knee joints at 90o
flexion, and performed four submaximal con-tractions involving Ext and Flex of the knees during a warm-up period to familiarize themselves with their MVCs and produce consistent results. Participants then executed two series of four uninterrupted repetitions of Ext and Flex of both legs, first with the dominant member and subsequently with the non-dominant member, at an angular velocity of 60o
/s, with a 60-second interval between series. During the testing period, standardized encouragement (e.g., ‘‘You are doing well’’) was provided to all volunteers to ensure that strength during the contractions was maximized (14). The MVC variables that were assessed included absolute Ext and Flex torques (Nm), Ext and Flex torques relative to the body weight (Nm/Bw) and Ext and Flex torques relative to FFM (Nm/FFM) (15,16).
Statistical analyses
The sample size was estimated based on an expected effect size of 10% for the relationships between FFM and the Ext and Flex MVC torques and a significance threshold of 5% (po0.05). The calculated minimum sample size was 132 subjects. All data are presented as the mean ± standard
deviation, median, first quartile and third quartile. Unpaired t-tests were used for comparisons between groups when
normality was not rejected by the Anderson Darling test. In case of rejection of normality, we used the Mann-Whitney test when the variables were homogeneous and the t test and Brunner Munzel test when the variables were hetero-geneous. Homogeneity (or homoscedasticity) was verified by the Bartlett test. Associations were evaluated using Pearson and Spearman correlations.
Ethical considerations
Informed consent was obtained from all participants included in this study. All study procedures were conducted in accordance with the ethical standards of relevant institu-tional and/or nainstitu-tional research committees and thus satis-fied the standards set forth in the Declaration of Helsinki in its revised version from 1975 and its amendments in 1983, 1989, and 1996. This study was approved by the Hospital das Clínicas Ethical Committee, University of São Paulo Medical School (no. 01038912.6.0000.0068).
’ RESULTS
The anthropometric characteristics, body composition and absolute and relative MVC torques of individuals are listed in Table 1. There were no differences between the dominant and non-dominant lower limbs with respect to absolute extension (156.76±43.67; 156.15±46.2, p=0.992) or flexion
(72.52±23.56; 71.45±21.6,p=0.901). Therefore, only the
domi-nant member was considered for analysis.
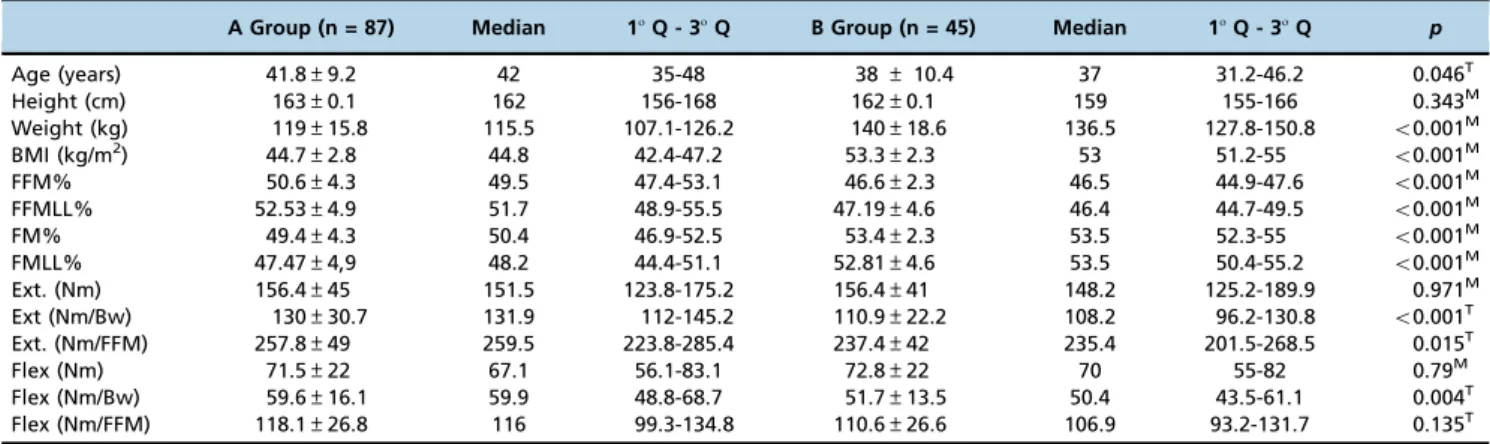
The anthropometric characteristics, body composition and absolute and relative MVC torques of subjects grouped by obesity grade are provided in Table 2. There were no sig-nificant differences between the two groups with respect to age or height. Significant between-group differences were detected for all body composition variables. Both groups exhibited similar mean values of absolute Ext and Flex MVC torques. However, Ext MVC torque relative to body weight (BW) and FFM was significantly reduced in the B group.
The correlations between absolute MVC torques and total and segmental body composition for the patient groups are listed in Table 3. The absolute Ext and Flex MVC torques had weak associations with FFM. However, there was a moderate association with absolute extension torque and fat with free
Table 1-Anthropometric characteristics, body composition, and absolute and relative maximum voluntary contraction torques for obese patients.
Mean±SD Median 1o Q - 3o
Q
Age (years) 40.5±9.79 41 33.25-47.75
Height (cm) 1.62±0.1 1.61 1.56-1.67
Weight (kg) 126.13±19.64 122.35 111.93-136.85
IMC 47.65±4.89 47.2 43.95-51.18
FFM% 49.27±4.18 48.27 46.5-51.47
FFMLL% 50.72±5.46 49.93 46.96-53.99
FM% 50.73±4.18 51.73 48.53-53.5
FMLL% 49.28±5.46 50.07 46.01-53.04
Ext (Nm) 156.45±43.57 150.75 123.88-183.48
Ext (Nm/Bw) 123.53±29.4 122.9 102.06-141.15
Ext (Nm/FFM) 250.91±47.67 249.14 219.49-278.68
Flex (Nm) 71.98±21.98 67.75 55.84-82.2
Flex (Nm/Bw) 56.95±15. 68 56.62 46.15-67.35
Flex (Nm/FFM) 115.58±26.87 114.89 97.52-132.42
Note: SD: standard deviation; BMI: body mass index; FFM: fat-free mass; FM: fat mass; Ext: extension; Flex: flexion; Nm: newton-meter; Nm/Bw: newton-meter/body weight; Nm/FFM: newton-meter/fat-free mass.
273
mass of lower limbs (FFMLL). For the A group, the absolute Ext and Flex MVC torques had moderate associations with FFM and FFMLL. For the B group, the absolute Ext and Flex MVC torques had a weak association with FFM and a moderate association with FFMLL.
’ DISCUSSION
Obesity is associated with musculoskeletal disorders, such as mechanical overload (17), low muscular conditioning (18) and the increased prevalence of musculoskeletal pain (19).
The lower limb muscles (flexors and extensors) are respon-sible for balance control (20), mobility and the ability to execute activities of daily life (21).
Excessive FM is regarded as the main determinant of reduced relative muscle strength (22), pain in joints of the lower limbs and functional limitations, especially in indivi-duals with severe obesity (17). Nevertheless, there are no studies correlating the FFM and FFM of the lower limbs with MVC torque (21). Previous studies have evaluated MVC torques of the lower limbs in obese patients (9,10,12) at low angular velocities (60o
/s) due to the recruitment of a relatively large number of motor units (23). The results represent the evaluated muscles’maximum capacity to pro-duce force. Furthermore, patients with severe obesity have preponderance of muscle fibers (type IIb) related to short-duration, high-intensity and low-repetition activities that can be more precisely evaluated at low angular velocities (24,25). Absolute MVC torques might be greater for obese indivi-duals than for normal-weight indiviindivi-duals (10,12). The lower limb muscles are responsible for cushioning, stabilizing the
knee joint (26), and providing high levels of concentric stren-gth during repetitive movements; these muscles support three times the body weight during walking and six times the body weight when climbing stairs (27).
A progressive increase in body mass would require a progressive increase in absolute lower limb Ext and Flex strength. However, in this study, the B group did not exhibit greater absolute Ext and Flex MVC torques than the A group. These results suggest that the B group had limited absolute MVC torques (that is, that these torques had plateaued). The reduced relative Ext MVC torque observed in the B group in comparison with that of the A group could be explained by functional limitations (28) associated with a lack of physical activity due to excessive body mass, disuse and muscular atro-phy (29); a consequence of this lack of activity is compromised independence in activities of daily living.
The correction of MVC torque for BW and FFM allows for comparisons among individuals with different body masses (15,16) and improved representations of the support loads that lean mass must bear in obese subjects.
The B group presented with more severe losses in FFM than the A group; this change in body composition was asso-ciated with lower relative MVC torques and contributes to a reduced level of physical activity (28).
In previous studies, weak associations (r=0.29 - 0.49) between lower limb strength and FFM were observed in obese women (8,10,12). However, in our series, we observed weak to mode-rate associations between MVC torques and FFM (r=0.47 - 0.6) and moderate associations with FFMLL (r=0.53 - 0.67). Our results suggest that fat-free mass (mainly in the lower limbs) is crucial for increasing the absolute MVC torques. The reduced
Table 2-Anthropometric characteristics, body composition, and absolute and relative maximum voluntary contraction torques for patient groups determined based on the obesity grade.
A Group (n = 87) Median 1o Q - 3o
Q B Group (n = 45) Median 1o Q - 3o
Q p
Age (years) 41.8±9.2 42 35-48 38±10.4 37 31.2-46.2 0.046T
Height (cm) 163±0.1 162 156-168 162±0.1 159 155-166 0.343M
Weight (kg) 119±15.8 115.5 107.1-126.2 140±18.6 136.5 127.8-150.8 o0.001M
BMI (kg/m2) 44.7±2.8 44.8 42.4-47.2 53.3±2.3 53 51.2-55 o0.001M
FFM% 50.6±4.3 49.5 47.4-53.1 46.6±2.3 46.5 44.9-47.6 o0.001M
FFMLL% 52.53±4.9 51.7 48.9-55.5 47.19±4.6 46.4 44.7-49.5 o0.001M
FM% 49.4±4.3 50.4 46.9-52.5 53.4±2.3 53.5 52.3-55 o0.001M
FMLL% 47.47±4,9 48.2 44.4-51.1 52.81±4.6 53.5 50.4-55.2 o0.001M
Ext. (Nm) 156.4±45 151.5 123.8-175.2 156.4±41 148.2 125.2-189.9 0.971M
Ext (Nm/Bw) 130±30.7 131.9 112-145.2 110.9±22.2 108.2 96.2-130.8 o0.001T
Ext. (Nm/FFM) 257.8±49 259.5 223.8-285.4 237.4±42 235.4 201.5-268.5 0.015T
Flex (Nm) 71.5±22 67.1 56.1-83.1 72.8±22 70 55-82 0.79M
Flex (Nm/Bw) 59.6±16.1 59.9 48.8-68.7 51.7±13.5 50.4 43.5-61.1 0.004T
Flex (Nm/FFM) 118.1±26.8 116 99.3-134.8 110.6±26.6 106.9 93.2-131.7 0.135T
Note: BMI: body mass index; FFM: fat-free mass; FFMLL: fat-free mass of the lower limbs; FM: fat mass; FMLL: fat mass lower limbs; Ext: extension; Flex: flexion; Nm: newton-meter; Nm/Bw: newton-meter/body weight; Nm/FFM: newton-meter/fat-free mass;T: Test t;M: Mann-Whitney.
Table 3-Correlation between muscle strength and total and segmental body composition for patient groups determined based on the obesity grade.
FFM All patients p A Group p B Group p
r (95% CI) r (95% CI) r (95% CI)
Ext (Nm) 0.48 (0.35; 0.63) o0.001S 0.6 (0.49; 0.78) o0.001S 0.47 (0.16; 0.7) 0.001P
Flex (Nm) 0.46 (0.33; 0.6) o0.001S 0.57 (0.42; 0.76) o0.001S 0.48 (0.26; 0.79) 0.001S
FFMLL
Ext (Nm) 0.57 (0.45; 0.71) o0.001S 0.67(0.56; 0.85) o0.001S 0.64 (0.39; 0.8) o0.001P
Flex (Nm) 0.47 (0.33; 0.62) o0.001S 0.56 (0.4; 0.77) o0.001S 0.53 (0.33; 0.82) o0.001S
Note: FFM: fat-free mass; FFMLL: fat-free mass of the lower limb; Nm: newton meter; Ext: extension; Flex: flexion;S: correlation spearman;P: Pearson correlation.
274 Muscle strength in severe obesity
FFMLL is a key determinant of functional limitations, physical inactivity and the emergence of comorbidities in patients with severe obesity (30). Physical exercises specifically planned for such patients may prevent losses of muscle strength (31).
’ AUTHOR CONTRIBUTIONS
Gadducci AV was responsible for the preparation of the study, data collec-tion, research execution and manuscript drafting. de Cleva R was responsible for the preparation of the study, research execution and manuscript drafting. Santarem GC was responsible for the data collection and manuscript draft-ing. Silva PR was responsible for the preparation of the study, research execu-tion and manuscript drafting. Greve JM was responsible for the manuscript drafting. Santo MA was responsible for the research execution and manu-script drafting.
’ REFERENCES
1. Kral JG. Morbidity of severe obesity. Surg Clin North Am. 2001;81 (5):1039-61, http://dx.doi.org/10.1016/S0039-6109(05)70183-3. 2. Giampaoli S, Stamler J, Donfrancesco C, Panico S, Vanuzzo D, Cesana G,
et al. The metabolic syndrome: A critical appraisal based on the CUORE epidemiologic study. Prev Med. 2009;48(6):525-31, http://dx.doi.org/ 10.1016/j.ypmed.2009.03.017.
3. Ford ES, Mokdad AH. Epidemiology of obesity in the Western Hemi-sphere. J Clin Endocrinol Metab. 2008;93(11 Suppl 1):S1-8, http://dx.doi. org/10.1210/jc.2008-1356.
4. Anandacoomarasamy A, Fransen M, March L. Obesity and the muscu-loskeletal system. Curr Opin Rheumatol. 2009;21(1):71-7, http://dx.doi. org/10.1097/BOR.0b013e32831bc0d7.
5. Okoro CA, Hootman JM, Strine TW, Balluz LS, Mokdad AH. Disability, arthritis, and body weight among adults 45 years and older. Obes Res. 2004;12(5):854-61, http://dx.doi.org/10.1038/oby.2004.103.
6. Syed IY, Davis BL. Obesity and osteoarthritis of the knee: hypotheses concerning the relationship between ground reaction forces and quad-riceps fatigue in long-duration walking. Med Hypotheses. 2000;54(2): 182-5, http://dx.doi.org/10.1054/mehy.1999.0013.
7. Koenig SM. Pulmonary complications of obesity. Am J Med Sci. 2001; 321(4):249-79, http://dx.doi.org/10.1097/00000441-200104000-00006. 8. Segal NA, Zimmerman MB, Brubaker M, Torner JC. Obesity and knee
osteoarthritis are not associated with impaired quadriceps specific strength in adults. PM R. 2011;3(4):314-23, http://dx.doi.org/10.1016/ j.pmrj.2010.12.011.
9. Abdelmoula A, Martin V, Bouchant A, Walrand S, Lavet C, Taillardat M, et al. Knee extension strength in obese and nonobese male adolescents. Appl Physiol Nutr Metab. 2012;37(2):269-75, http://dx.doi.org/10.1139/ h2012-010.
10. Hulens M, Vansant G, Lysens R, Claessens AL, Muls E, Brumagne S. Study of differences in peripheral muscle strength of lean versus obese women: an allometric approach. Int J Obes Relat Metab Disord. 2001; 25(5):676-81, http://dx.doi.org/10.1038/sj.ijo.0801560.
11. Paolillo FR, Milan JC, Bueno Pde G, Paolillo AR, Borghi-Silva A, Parizotto NA, et al. Effects of excess body mass on strength and fatigability of quadriceps in postmenopausal women. Menopause. 2012;19(5):556-61, http://dx.doi.org/10.1097/gme.0b013e3182364e80.
12. Maffiuletti NA, Jubeau M, Munzinger U, Bizzini M, Agosti F, De Col A, et al. Differences in quadriceps muscle strength and fatigue between lean and obese subjects. Eur J Appl Physiol. 2007;101(1):51-9, http://dx.doi. org/10.1007/s00421-007-0471-2.
13. Vargas CB, Picolli F, Dani C, Padoin AV, Mottin CC. Functioning of obese individuals in pre- and postoperative periods of bariatric surgery. Obes Surg. 2013;23:1590-5, http://dx.doi.org/10.1007/s11695-013-0924-0.
14. Calmels PM, Nellen M, van der Borne I, Jourdin P, Minaire P. Concentric and eccentric isokinetic assessment of flexor-extensor torque ratios at the hip, knee, and ankle in a sample population of healthy subjects. Arch Phys Med Rehabil. 1997;78(11):1224-30, http://dx.doi.org/10.1016/S0003-9993 (97)90336-1.
15. Jaric S. Muscle strength testing: use of normalisation for body size. Sports Med. 2002;32(10):615-31, http://dx.doi.org/10.2165/00007256-200232100-00002.
16. Jaric S. Role of body size in the relation between muscle strength and movement performance. Exerc Sport Sci Rev. 2003;31(1):8-12, http://dx. doi.org/10.1097/00003677-200301000-00003.
17. Fabris SM, Faintuch J, Brienze SL, Brito GB, Sitta IS, Mendes EL, et al. Are knee and foot orthopedic problems more disabling in the super-obese? Obes Surg. 2013;23(2):201-4, http://dx.doi.org/10.1007/s11695-012-0778-x.
18. Teasdale N, Hue O, Marcotte J, Berrigan F, Simoneau M, Doré J, et al. Reducing weight increases postural stability in obese and morbid obese men. Int J Obes. 2007;31(1):153-60, http://dx.doi.org/10.1038/sj. ijo.0803360.
19. Wearing SC, Hennig EM, Byrne NM, Steele JR, Hills AP. Musculoske-letal disorders associated with obesity: a biomechanical perspective. Obes Rev. 2006;7(3):239-50, http://dx.doi.org/10.1111/j.1467-789X.2006. 00251.x.
20. Handrigan G, Hue O, Simoneau M, Corbeil P, Marceau P, Marceau S, et al. Weight loss and muscular strength affect static balance control. Int J Obes. 2010;34(5):936-42, http://dx.doi.org/10.1038/ijo.2009.300.
21. Rolland Y, Lauwers-Cances V, Pahor M, Fillaux J, Grandjean H, Vellas B. Muscle strength in obese elderly women: effect of recreational physical activity in a cross-sectional study. Am J Clin Nutr. 2004;79(4):552-7. 22. Slemenda C, Heilman DK, Brandt KD, Katz BP, Mazzuca SA, Braunstein
EM, et al. Reduced quadriceps strength relative to body weight: a risk factor for knee osteoarthritis in women? Arthritis Rheum. 1998;41(11): 1951-9, http://dx.doi.org/10.1002/1529-0131(199811)41:11o 1951::AID-ART943.0.CO;2-9.
23. Thorstensson A, Grimby G, Karlsson J. Force-velocity relations and fiber composition in human knee extensor muscles. J Appl Physiol. 1976;40 (1):12-6.
24. Tanner CJ, Barakat HA, Dohm GL, Pories WJ, MacDonald KG, Cun-ningham PR, et al. Muscle fiber type is associated with obesity and weight loss. Am J Physiol Endocrinol Metab. 2002;282(6): E1191-6, http://dx.doi. org/10.1152/ajpendo.00416.2001.
25. Krotkiewski M, Bjorntorp P. Muscle tissue in obesity with different dis-tribution of adipose tissue. Effects of physical training. Int J Obes. 1986;10 (4):331-41.
26. Taylor WR, Heller MO, Bergmann G, Duda GN. Tibio-femoral loading during human gait and stair climbing. J Orthop Res. 2004;22(3):625-32, http://dx.doi.org/10.1016/j.orthres.2003.09.003.
27. Wakeling JM, Liphardt AM, Nigg BM. Muscle activity reduces soft-tissue resonance at heel-strike during walking. J Biomech. 2003;36(12):1761-9, http://dx.doi.org/10.1016/S0021-9290(03)00216-1.
28. Nocera J, Buford TW, Manini TM, Naugle K, Leeuwenburgh C, Pahor M, et al. The impact of behavioral intervention on obesity mediated declines in mobility function: implications for longevity. J Aging Res. 2011; 2011:392510, http://dx.doi.org/10.4061/2011/392510.
29. Stenholm S, Alley D, Bandinelli S, Griswold ME, Koskinen S, Rantanen T, et al. The effect of obesity combined with low muscle strength on decline in mobility in older persons: results from the InCHIANTI study. Int J Obes. 2009;33(6):635-44, http://dx.doi.org/10.1038/ijo.2009.62. 30. Hulens M, Vansant G, Lysens R, Claessens AL, Muls E. Assessment
of isokinetic muscle strength in women who are obese. J Orthop Sports Phys Ther. 2002;32(7):347-56, http://dx.doi.org/10.2519/jospt.2002. 32.7.347.
31. Hue O, Berrigan F, Simoneau M, Marcotte J, Marceau P, Marceau S, et al. Muscle force and force control after weight loss in obese and morbidly obese men. Obes Surg. 2008;18(9):1112-8, http://dx.doi.org/10.1007/ s11695-008-9597-5.
275