DOI: http://dx.doi.org/10.5007/1980-0037.2015v17n3p328
original article
RBCDH
1 Pontifícia Universidade Católica do Rio Grande do Sul. Porto Ale-gre, RS. Brasil
2 Universidade Federal do Rio Grande do Sul. Laboratório de Pes-quisa do Exercício. Porto Alegre, RS. Brasil
3 Faculdade da Serra Gaúcha. Curso de Educação Física. Caxias do Sul, RS. Brasil
Received: 15 January 2015 Accepted: 11 March 2015
Rate of force development and torque
production assessment in spastic stroke
survivors
Avaliação da taxa de produção de força e torque em
indivíduos com espasticidade pós-avc
Bruno Freire1
Caroline P Dias2,3
Lauren S Oliveira2
Nathália B A Goulart2
Fernando A Lemos1
Jeferson Becker1
Irenio Gomes1
Marco A Vaz2
Abstract– he aim of this study was to compare the rate of force development (RFD)
and maximum torque in spastic stroke survivors and healthy individuals. Fiteen stroke survivors (57.3 ± 11.2 years) with ankle spasticity and iteen healthy individuals (59.3 ± 6.4 years) participated in this study. An isokinetic dynamometer was used to maximum voluntary isometric contraction (MVC) and RFD assessment of plantar lexors muscles of ankle, which the individuals were instructed to produce maximum torque as fast as possible. he absolute RFD was normalized by MVC (relative RFD). In results were ob-served signiicant diferences in RFD of afected limb (43.3 ± 8.5 Nm/s) and unafected limb (98.9 ± 20.4 Nm/s) compared to healthy (186.2 ± 25.2 Nm/s), but with no diferences between afected and unafected limbs (p=0.15). In relation to relative RFD, the afected limb (9.76 ± 1.1 %MVC/s) was signiicant diferent than healthy (13.08 ± 1.5 %MVC/s). he MVC produced by afected limb (46.55 ± 7.98 Nm) was signiicant lower than unaf-fected limb (84.29 ± 8.47 Nm) and, the two limbs of stroke survivors were weakness than healthy individuals (128.02 ± 9.36 Nm). Lastly, the spasticity level present higher negative correlation in relation to RFD (R= -0.725; p= 0.002) and MVC (R= -0.717; p=0.003). he spasticity promotes alterations in capacity to produce maximum force and fast force in afected and unafected limbs of stroke survivors compared to healthy.
Key words: Dynamometer; Muscle power; Muscle spasticity; Strength.
Stroke is the main cause of acquired motor disability in adults1, which be-gins suddenly and commonly promotes weakness and hemiparesis on the
contralateral side of the body in relation to the side of the cerebral injury2.
Among complications, damage to the upper motor neurons that in turn afect the corticospinal tract responsible for the inhibitory projection in neurons
of the spinal cord motor is commonly found3. hus, spasticity is developed.
Spasticity is deined as the increase in tendon hyperrelexia at rest, which is the increasing myotatic relex response coupled with increased
muscle tone4. his complex motor disorder stems from a dysfunction in
the central nervous system and promotes alterations at all levels of the
locomotor system including muscles and joints5. Adaptations secondary to
spasticity have been observed such as increased amounts of type-I muscle
ibers and muscle cell stifness6, smaller fascicle length and cross-sectional
area7,8 decreased muscle volume9 and reduction in voluntary muscle
activa-tion, which compromises balance, causing deicient voluntary control10.
Previous studies have evaluated the ability of maximal voluntary force
production in stroke survivors with spastic hemiparesis. Klein et al.11
ob-served decreased plantar lexor strength of approximately 60% in ankle joint
on the afected limb compared to the unafected limb, and McCrea et al.12
observed an average reduction of 53% in isometric torque on the afected arm compared to the unafected arm. here are several causes that can be indicated as responsible for strength deicit secondary to spasticity such as muscle atrophy, decreased number of motor units, alterations on muscle
recruitment order, decreased iring rate and muscle activation capacity13,14.
A parameter related to force production capacity and important for the functional evaluation of fast muscle contraction is the rate of force development (RFD). his index has been the most widely used to represent the explosive force and is obtained by the force-time variation ratio, which
is also an important neuromuscular performance parameter15. RFD is
relevant precisely because, according to Suetta et al.16, the ability of
indi-viduals to produce fast force is related with daily activities such as walking, climbing and going down stairs. Also, the increase in RFD relects higher
level of muscle strength in the initial muscle contraction phase17 which
enables a fast response in balance disturbance situations, preventing falls. Considering the alterations in motor control promoted by spasticity and on muscles in spastic individuals, it is important to study RFD and the maximal force production in this population. However, few studies have assessed these variables in stroke survivors with spasticity.
Rate of force development in spastic stroke survivors Freire et al.
METHODS
Fiteen stroke survivors with ankle spasticity participated in this study. he spasticity level was assessed by the Modiied Ashworth scale. Inclusion crite-ria were: (1) presence of hemiparesis spasticity for at least one year; (2) being able to walk without any assistance; (3) no history of orthopaedic surgery in any lower limb; (4) no use of medication to treat spasticity or use of orthe-ses; (5) cognitive capacity to perform assessments; (6) being able to remain seated for at least one hour. Fiteen healthy and sedentary individuals with no neurological or muscle disorder and with similar age participated in the control group. All subjects signed an informed consent form to participate in the study and the experimental protocol was approved by the Ethics Com-mittee in Human Research of the institution where the study was conducted (Protocol number 18440 UFRGS and Protocol number 10-5179 PUCRS).
Experimental design
he experiment consisted of two sessions with interval of one week between them for all participants. Each limb was tested in one session using the same protocol. Only the dominant leg of healthy subjects was considered for analysis and used as healthy limb.
Evaluation procedures
An isokinetic dynamometer (Biodex Medical System, Shirley – NY, USA) was used for the positioning of the ankle joint and assessment of RFD and torque production. Participants were seated on the dynamometer chair and positioned with trunk and hips ixed by adjustable straps, with knee fully extended and ankle at 0° (foot perpendicular to leg). he ankle joint rotation axis (deined by the center of the medial/lateral malleolus) was aligned with the dynamometer axis to minimize rotations out of the intended motion plane.
Subsequently, participants performed three maximal voluntary isomet-ric contractions (MVC) of plantar lexion at 0° for 5 seconds. Participants were oriented to exert maximal force as fast as possible and maintain this efort for at least one second. he maximum active torque recorded among the three contractions was used for further analysis. Before data acquisi-tion protocols, all participants performed three submaximal voluntary isometric contractions of plantar lexion as familiarization protocol, and a 2-min resting time was respected between contractions (familiarization and evaluation) to avoid potential fatigue efects in torque production.
Absolute RFD was deined as the slope of the torque–time curve
was tested and conirmed by the Shapiro-Wilk test. For unpaired samples, the student t test was used to compare age and anthropometric variables between groups. One-way ANOVA was used to determine the existence of signiicant diferences in RFD and torque between limbs. Correlation test was performed by the Pearson test. Statistical analysis was performed using SPSS sotware version 17.0 with signiicance level of α = 0.05.
RESULTS
here were no signiicant diferences for age, body mass and height (p=0.60, p=0.65 and p=0.46, respectively) between groups (stroke vs. healthy). An-thropometric and clinical variables are shown in table 1.
Table 1. Characteristics of participants (mean ± SD).
Stroke (n=15) Healthy (n=15)
Age (years) 57.3 ± 11.2 59.0 ± 6.4
Time since stroke (years) 7.4 ± 5.8
-Male/female (n) 10/5 10/5
Body mass (kg) 76.6 ± 14.4 74.5 ± 11.5
Height (cm) 169 ± 0.05 167 ± 0.10
ASW 1.5 ± 0.6
-ASW = Modiied Ashworth scale
he afected limb showed signiicantly lower torque production compared with the unafected limb (46.55 ± 7.98 Nm and 84.29 ± 8.47 Nm, respectively; p≤0.001). Healthy individuals (128.02 ± 9.36 Nm) were stronger in maximum isometric torque production than the afected (p≤0.001) and unafected limb (p≤0.001) of stroke survivors. MVC results are shown in igure 1.
Figure 1. Maximum voluntary isometric contraction (MVC) of plantar lexors in afected and unafected limbs of stroke survivors and dominant limb of healthy subjects. *Diference to healthy limb; #Diference between afected and unafected limbs. Data expressed as mean ± ED. p<0.05.
Rate of force development in spastic stroke survivors Freire et al.
p=0.04, respectively) compared to healthy limb (186.2 ± 25.2 Nm/s). On the other hand, there were no signiicant diferences (p=0.15) between afected and unafected limbs of stroke survivors. Results are shown in igure 2.
Figure 2. Absolute rate of force development (RFD) of plantar lexors in afected and unafected limbs of stroke survivors and dominant limb of healthy subjects. *Diference to healthy limb; Data expressed as mean ± ED. p<0.05.
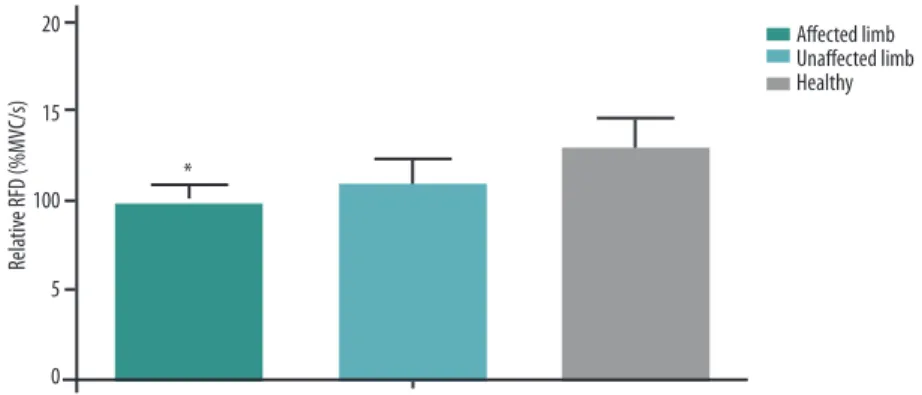
When normalized by MVC (relative RFD), afected limb (9.76 ± 1.1 %MVC/s) was signiicant lower compared to healthy individuals (13.08 ± 1.5 %MVC/s). here were no signiicant diferences between unafected limb (10.87 ± 1.4 %MVC/s) and healthy limb. Results of relative RFD are shown in igure 3.
Figure 3. Relative rate of force development (RFD) of plantar lexors in afected and unafected limbs of stroke survivors and dominant limb of healthy subjects. *Diference to healthy limb; Data expressed as mean ± ED. p<0.05.
High negative correlation (R= -0.717; p=0.003) between MVC and spasticity level (ASW scale) and high negative correlation (R= -0.725; p= 0.002) between RFD and spasticity level were observed.
DISCUSSION
of 64%18 and 70%19 in spastic children compared to children with typical development, suggesting loss of muscle eiciency caused by spasticity. he decrease in RFD observed in afected and unafected limbs demonstrated the lower speed with which maximum force can be generated by plantilexor muscles; however, this diference was not observed between afected and
unafected limbs. Dissimilarly, Fimland et al.20 found reduction in RFD of
afected limbs compared to unafected limbs in stroke survivors. he authors found reductions ranging from 54% to 67% between limbs and justify the indings due to low neuromuscular activity and atrophy promoted by the commitment time of 6.5 (0.8 to 20.9) years of stroke, on average. However, the present study showed longer stroke commitment time (7.4 ± 5.8 years), but the stroke commitment time may not be the proper justiication. A
previous study20 also showed results of maximum contraction of
planti-lexor muscles not normalized by the mass of each individual, which may have been responsible for diferences among indings in these studies. In the same way, the spasticity level of participants evaluated by Fimland et
al.20 was not described, thus the diference in RFD can have other reasons.
he fact that the unafected limb had lower absolute RFD compared to healthy subjects can be justiied by functional and morphological
diferences caused by spasticity. Malaya et al.21 observed lower medial
gastrocnemius muscle length in the unafected limb of hemiplegic cer-ebral palsy children (0.165 ± 0.028 m) compared to children with typical development (0.191 ± 0.035 m). he authors could not explain the results, but the present study reported reduction in RFD and in maximum force production, demonstrating the inability acquired by the unafected limb in relation to healthy subjects, which could be a result of morphological or functional adaptation. While the unafected limb can take higher level of daily activity resulting from increased functional dependence, spasticity leads patients to reduce their overall mobility, which results in decreased
functional capacity of apparently healthy muscle 22. In this context,
fur-ther studies should be carried out in order to assess the relationship of the unafected side with spasticity and possible adaptations.
RFD is an aspect inluenced by several factors, among which iber
mus-cle length and thickness, iber type and composition17,19, which are features
that can be modiied by spasticity. Kwah et al.8 assessed spastic stroke
survi-vors using ultrasound and observed lower length of gastrocnemius medialis (436 mm) and fascicle muscles (44 mm) compared to healthy subjects (444 and 50 mm, respectively). Other studies have also shown lower length of
fascicle muscles in hemiplegic spastic individuals23,24. All authors related the
lower length of fascicle muscles with increasing stifness in muscle tissue
due to shortened position of the joint and with muscle spasticity8,24., Friden
and Lieber25 had previously found lower lengths of spastic fascicle muscles
in vitro, while Svantensson et al.26 observed increased muscle stifness in the
Rate of force development in spastic stroke survivors Freire et al.
between fascicle length and RFD occurs through an increase in number of sarcomeres in series, indicated by fascicle length results in an increase of
iber shortening velocity, and consequently increase of RFD19. In addition,
the concentration and type of iber can be altered, histopathological studies
found atrophy of type-2 muscle ibers in spastic stroke individuals27. his
type of iber is responsible for fast contraction, which can modify RDF. Maximum torque is representative of the maximum capacity of an individual to generate force, and is associated with intrinsic muscle ability
and muscle activation capacity28. he results of this study corroborate those
obtained by Klein et al.11, who found lower torque values, by about one third,
in plantarlexor muscles of the afected limb (56.7 ± 57.4 Nm) compared to unafected limb (147 ± 35.7 Nm) in stroke survivors. Additionally, studies justify that neuromuscular weakness is a common inding in the afected
limb of spastic hemiplegic individuals20,29 and unafected limb in relation
to healthy subjects 22,30, therefore, a decrease in force production resulting
from spasticity was expected. Furthermore, maximum force production appears to be an important aspect in muscle power, since when RFD was normalized by MVC (relative RFD), the diference between afected and
healthy limb was not statistically signiicant. Fimland et al.20 explain that
there can be no diference in the neuromuscular recruitment capacity be-tween limbs, but morphological alterations such as muscle atrophy explain the diference observed in absolute and not in relative RFD on unafected limb compared to healthy subjects.
he high negative correlation between spasticity level with RFD and maximum torque suggests the functional impairment of spastic individuals. he adaptations in relex sensibility to which spinal motor neurons increase
the muscle activation22 associated with interrupt motor stimulation from
the supraspinal centers developed by spasticity results in impairment of
force modulation and production14. hus, the ability to produce maximum
force and/or muscle power is severely impaired by spasticity.
It is noteworthy that there are some limitations to consider in the indings of this study. Neuromuscular impairment due to spasticity is not restricted to proper muscle contraction but also to the sensory system, which participants reported loss of sensation and proprioception in the afected limb. he position on the dynamometer can have enhanced this limitation with the stretching of the posterior leg muscle. In addition, the level of muscle activation through electromyography (EMG) was not measured. It is suggested the use of EMG to analyze the alterations in mo-tor recruitment and muscle activation.
CONCLUSION
REFERENCES
1. WHO. he Global Burden of Disease: 2004 Update. World Health Organization,
Geneva, Switzerland 2008.
2. Chang SH, Francisco GE, Zhou P, Rymer WZ, Li S. Spasticity, weakness, force vari-ability, and sustained spontaneous motor unit discharges of resting spastic-paretic biceps brachii muscles in chronic stroke. Muscle Nerve 2013;48:85-92.
3. Sheean G, McGuire JR. Spastic hypertonia and movement disorders:
Pathophysiol-ogy, clinical presentation, and quantiication. PM R 1009;1(9):827-33.
4. Burke D, Wissel J, Donnan GA. Pathophysiology of spasticity in stroke. Neurology 2013;80(3):20-6.
5. Priori A, Cogiamanian F, Mrakic-Sposta S. Pathophysiology of spasticity. Neurol
Sci 2006;27:307-9.
6. Lieber RL, Steinman S, Barash IA, Chambers H. Structural and functional changes
in spastic skeletal muscle. Muscle Nerve 2004;29(5):615-27.
7. Barber L, Barrett R, Lichtwark G. Medial gastrocnemius muscle fascicle active
torque-length and Achilles tendon properties in young adults with spastic cerebral palsy. J Biomech 2012;45(15):2526-30.
8. Kwah LK, Herbert RD, Harvey LA, Diong J, Clarke JL, Martin JH, et al. Passive
mechanical properties of gastrocnemius muscles of people with ankle contracture ater stroke. Arch Phys Med Rehabil 2012;93(7):1185-1190.
9. Barrett RS, Lichtwark GA. Gross muscle morphology and structure in spastic
cerebral palsy: a systematic review. Dev Med Child Neurol 2010;52(9):794-804.
10. Foran JR, Steinman S, Barash I, Chambers HG, Lieber RL. Structural and mechani-cal alterations in spastic skeletal muscle. Dev Med Child Neurol 2005;47(10):713-7.
11. Klein CS, Brooks D, Richardson D, McIlroy WE, Bayley MT. Voluntary activation
failure contributes more to plantar lexor weakness than antagonist coactivation and muscle atrophy in chronic stroke survivors. J Appl Physiol 2010;109(5):1337-46.
12. McCrea PH, Eng JJ, Hodgson AJ. Time and magnitude of torque generation is
impaired in both arms following stroke. Muscle Nerve 2003;28:46-53.
13. Eng JJ, Kim CM, Macintyre DL. Reliability of lower extremity strength measures
in persons with chronic stroke. Arch Phys Med Rehabil 2002;83:322-8.
14. Arene N, Hidler J. Understanding motor impairment in the paretic lower limb ater a stroke: a review of the literature. Top Stroke Rehabil 2009;16(5):346-6.
15. Corvino RB, Caputo F, Oliveira AC, Greco CC, Denadai BS. Taxa de
desenvolvi-mento de força em diferentes velocidades de contrações musculares. Rev Bras Med Esporte 2009;15(6):428-31.
16. Suetta C, Aagaard P, Rosted A, Jakobsen AK, Duus B, Kjaer M, et al.
Training-induced changes in muscle CSA, muscle strength, EMG, and rate of force de-velopment in elderly subjects ater long-term unilateral disuse. J Appl Physiol 2004;97(5):1954-61.
17. Aagard P, Simonsen EB, Andersen JL, Magnusson P, Dyhre-Poulsen P. Increased
rate of force development and neural drive of human skeletal muscle following resistance training. J Appl Physiol 2002;93:1318-1326.
18. Tammik K, Matlep M, Ereline J, Gapeyeva H, Pääsuke M. Quadriceps femoris
muscle voluntary force and relaxation capacity in children with spastic diplegic cerebral palsy. Pediatr Exerc Sci 2008;20:18-28.
19. Moreau NG, Falvo M, Damiano DL. Rapid Force Generation is Impaired in
Cer-ebral Palsy and is Related to Decreased Muscle Size and Functional Mobility. Gait Posture 2012;35(1):154-8.
Rate of force development in spastic stroke survivors Freire et al.
Corresponding author
Bruno Freire
Universidade Federal do Rio Grande do Sul (UFRGS).
Escola de Educação Física (ESEF). Laboratório de Pesquisa do Exercício (LAPEX).
Rua Felizardo, 750 – Jardim Botânico. CEP: 90690-220 – Porto Alegre (RS), Brasil
E-mail: [email protected]
21. Malaiya R, McNee AE, Fry NR, Eve LC, Gough M, Shortland AP. he
morphol-ogy of the medial gastrocnemius in typically developing children and children with spastic hemiplegic cerebral palsy. J Electromyogr Kinesiol 2007;17(6):657-63.
22. Chou LW, Palmer JA, Binder-Macleod S, Knight CA. Motor unit rate coding is
severely impaired during forceful and fast muscular contractions in individuals post stroke. J Neurophysiol 2013;109(12):2947-54.
23. Li L, Tong KY, Hu X. he efect of poststroke impairments on brachialis muscle
architecture as measured by ultrasound. Arch Phys Med Rehabil 2007;88:243-50.
24. Gao F, Grant TH, Roth EJ, Zhang L. Changes in passive mechanical properties of
the gastrocnemius muscle at the muscle fascicle and joint levels in stroke survivors . Arch Phys Med Rehabil 2009;90(5):819-26.
25. Friden J, Lieber RL. Spastic muscle cells are shorter and stifer than normal cells. Muscle Nerve 2003;27:157-64.
26. Svantesson U, Takahashi H, Carlsson U, Danielsson A, Sunnerhagen KS. Muscle
and tendon stifness in patients with upper motor neuron lesion following a stroke. Eur J Appl Physiol 2000;82(4):275-9.
27. Hachisuka K, Umezu Y, Ogata H. Disuse muscle atrophy of lower limbs in
hemi-plegic patients. Arch Phys Med Rehabil 1997;78(1):13-8.
28. Dalton BH, Harwood B, Davidson AW, Rice CL. Triceps surae contractile properties and iring rates in the soleus of young and old men. J Appl Physiol 2009;107:1781-8.
29. Horstman A, Gerrits K, Beltman M, Janssen T, Konijnenbelt M, de Haan A. Muscle
function of knee extensors and lexors ater stroke is selectively impaired at shorter muscle lengths. J Rehabil Med 2009;41:317-21.