*Correspondence: F. R. Salazar. Faculdade de Farmácia. Universidade Federal do Rio Grande do Sul. Av. Ipiranga, 2752. 90570-040 - Porto Alegre - RS, Brasil. E-mail: [email protected]
Article
vol. 51, n. 2, apr./jun., 2015 http://dx.doi.org/10.1590/S1984-82502015000200012
Development of alternative methods for the determination of
raloxifene hydrochloride in tablet dosage form
Fernanda Rodrigues Salazar
*, Cristiane Franco Codevilla, Leonardo Meneghini, Ana Maria Bergold
Faculty of Pharmacy, Federal University of Rio Grande do Sul, Porto Alegre, RS, Brazil
Three methods are proposed for the quantitative determination of raloxifene hydrochloride in pharmaceutical dosage form: ultraviolet method (UV) high performance liquid chromatography (HPLC) and micellar capillary electrophoresis (MEKC). These methods were developed and validated and showed good linearity, precision and accuracy. Also they demonstrated to be speciic and robust. The HPLC and MEKC methods were tested in regards to be stability indicating methods and they showed to have this attribute. The UV method used methanol as solvent and optimal wavelength at 284 nm, obeying Lambert-Beer law in these conditions. The chromatographic conditions for the HPLC method included: NST column C18 (250 x 4.6 mm x 5 µm), mobile phase water:acetonitrile:triethylamine (67:33:0,3 v/v), pH 3.5, low rate 1.0 mL min-1, injection volume 20.0 µl, UV detection 287 nm and analysis temperature 30 °C. The MEKC method was performed on a fused-silica capillary (40 cm effective length x 50 µm i.d.) using as background electrolyte 35.0 mmol L-1 borate buffer and 50.0 mmol L-1 anionic detergent sodium dodecyl sulfate (SDS) at pH 8.8. The capillary temperature was 32°C, applied voltage 25 kV, UV detection at 280 nm and injection was perfomed at 45 mBar for 4 s, hydrodimanic mode. In this MEKC method, potassium diclofenac (200.0 µg mL-1) was used as internal standard. All these methods were statistically analyzed and demonstrated to be equivalent for quantitative analysis of RLX in tablets and were successfully applied for the determination of the drug.
Uniterms: Raloxifene/determination in tablets. High performance liquid chromatography/quantitative analysis. UV spectrophotometric method/quantitative analysis. Micellar capillary electrophoresis/ quantitative analysis. Stability-indicating methods.
Três métodos são propostos para a quantiicação de cloridrato de raloxifeno em sua forma farmacêutica de comprimidos: espectrofotometria no ultravioleta (UV), cromatograia líquida de alta eiciência (HPLC) e eletroforese capilar micelar (MEKC). Estes métodos desenvolvidos e validados demonstraram linearidade, precisão e exatidão. Também foram especíicos e robustos. Os métodos HPLC e MEKC foram desenvolvidos para indicar a estabilidade do fármaco e demonstraram ter este atributo. O método UV usou metanol como solvente e comprimento de onda de 284nm, obedecendo a Lei de Lambert-Beer nestas condições. Os parâmetros cromatográicos para o método HPLC foram: coluna NST C18 (250 x 4,6 mm x 5 µm), fase móvel composta de água:acetonitrila:trietilamina (67:33:0,3 v/v), pH 3,5, vazão da fase móvel de 1,0 mL min-1, volume de injeção de 20 µl, detecção no comprimento de onda de 287 nm e temperatura de análise de 30°C. O método MEKC foi realizado utilizando capilar de sílica fundida (40 cm de comprimento efetivo x 50 µm de diâmetro interno) usando como fase móvel solução tampão borato 35.0 mmol L-1 e solução de dodecil sulfato de sódio (SDS) 50.0 mmol L-1 pH 8,8. A temperatura de análise foi de 32 °C, com voltagem aplicada de 25 kV, detecção no comprimento de onda de 280 nm e injeção da amostra realizada a 45 mBar por 4 s em modo hidrodinâmico. Para este método MEKC, foi utilizado diclofenaco de potássio (200.0 µg mL-1) como padrão interno. Todos os métodos foram analisados estatisticamente e demostraram ser equivalentes para a análise quantitativa de raloxifeno em comprimidos e foram aplicados com sucesso na determinação do fármaco.
INTRODUCTION
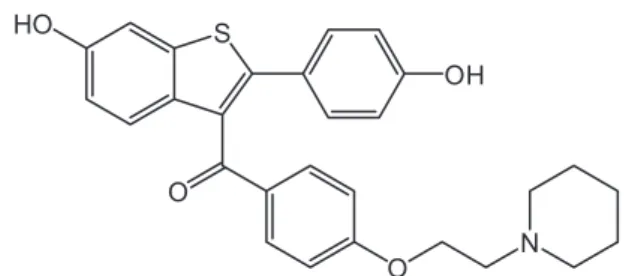
Raloxifene (RLX) chemically [6-hydroxy-2-(4-hydroxyphenyl)-benzotiophen-3-yl]-[4-[2-(1-piperidyl) ethoxy]phenyl]-metadon (Figure 1), is a selective oestrogen-receptor modulator (SERM) that has been approved for use in the prevention and treatment of osteoporosis in postmenopausal women. A SERM interacts with oestrogen receptors, functioning as an agonist in some tissues (bone and cardiovascular system) and as antagonist in other tissues (mammary tissue and uterus) (Katzung, 2006; Rang et al., 2006). Recently, raloxifene has been also approved by FDA for the prevention of invasive breast cancer. It was developed by Ely Lilly Company and marketed as Evista® in form of tablets of 60.0 mg.
It is generally well tolerated, but it has as most common adverse effects hot flashes and leg cramps. A serious adverse effect is venous thromboembolism (ANVISA, 2012; Brunton et al., 2010; NCI, 2012).
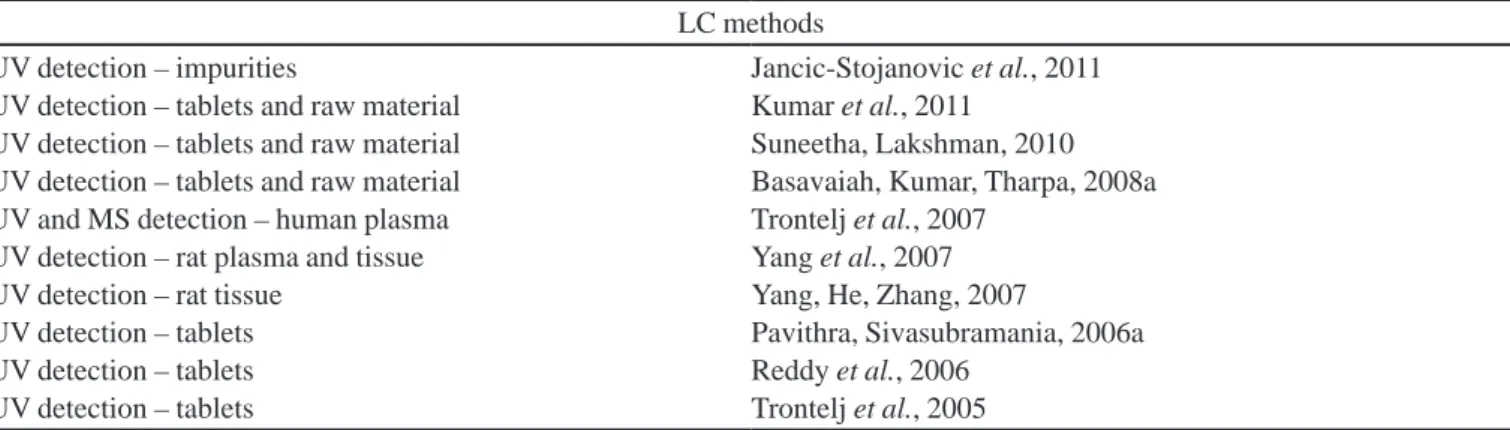
The literature survey reveals several methods f o r t h e d e t e r m i n a t i o n o f R L X c o m p r e h e n d i n g liquid chromatographic methods (HPLC) either for pharmaceutical dosage forms or biological fluids and spectrophotometric methods. The HPLC methods were mostly with UV detection but also detection by mass spectrometry. All these HPLC methods require use of buffer solutions as mobile phase in isocractic or gradient way. It has been also described a capillary zone electrophoresis method applied to quantify RLX in human plasma and tablets. The spectrophotometric methods were in the ultraviolet region (UV) or visible region (VIS) and required complex formation for the measurements. All these reported methods can be laborious and time consuming and some require special derivatization reactions. These reported methods are summarized at Table I.
The aim of this study was to develop simple, rapid and easy to execute procedures for routine analysis of raloxifene hydrochloride in dosage forms. The developed analytical methods were micellar capillary electrophoresis (MEKC), high performance liquid chromatography
(HPLC), widely used in routine analysis, using water instead of buffer solution as mobile phase, and a direct UV spectrophotometric method. A statistical comparison between these three developed methods was made.
Degradation studies also were done to ind the inherent
stability of the active substance.
MATERIAL AND METHODS
Chemicals
Standard bulk drug samples of RLX and potassium d i c l o f e n a c w e r e a c q u i r e d f r o m P h a r m a N o s t r a Distribuidora LTDA. The pharmaceutical dosage form Evista® containing 60.0 mg of RLX was furnished by
INCT-IF. All reagents were of analytical grade: HPLC methanol (Honeywell International Inc, Muskegon, USA), HPLC acetonitrile (Tedia, Fairfield, USA), boric acid (Merck, São Paulo, Brazil), sodium dodecylsulfate (Synth,
São Paulo, Brazil) and triethylamine (Vetec Química Fina
Ltda, Rio de Janeiro, Brazil).
T h e H P L C m o b i l e p h a s e w a s d e g a s s e d b y ultrasonication (Unique, São Paulo, Brazil). Running
electrolytes and samples were iltered through 0.45 µm ilters (Macherey-Nagel, Düren, Germany).
Apparatus and conditions
HPLC method was performed in a Shimadzu liquid chromatograph (Tokyo, Japan) equipped with a LC-20AT Prominance pump, UV/VIS SPD-10AVAvp
detector, BUS MODULE CBM-20A communicator, SIL-20A autosampler and CTO-20A column oven. The
data acquisition and analysis were made by CLASS-VP software (version 6.1). The stationary phase was a RP C18 NST column (250 x 4.6 mm id, particle size 5 µm) and the mobile phase consisted of water-acetonitrile-triethylamine (67:33:0.3 v/v) pH 3.5 (adjusted with o-phosphoric acid
20%). Other chromatographic conditions included mobile
phase flow rate of 1,0 mL min-1, injection volume of
20.0 µL and analysis temperature (30°C). The absorption wavelengths were set at 287 nm to detect the components.
A Agilent3D CE equipment (Agilent Technologies,
Germany) equipped with autosampler, diode array detector, temperature controlling system (4-60 °C), and power supply able to deliver up to 30 kV was used for the CE measurements. CE ChemStation software was used for instrument control, data acquisition and analysis. The detector wavelength was set at 280 nm. The separations were performed in a fused-silica uncoated capillary (48.5 cm x 50 µm id, Agilent, Germany) with temperature S
O
O
N HO
OH
TABLE I - Proposed methods for quantiication of RLX by LC, CE and spectrophotometry
LC methods
UV detection – impurities Jancic-Stojanovic et al., 2011 UV detection – tablets and raw material Kumar et al., 2011
UV detection – tablets and raw material Suneetha, Lakshman, 2010 UV detection – tablets and raw material Basavaiah, Kumar, Tharpa, 2008a UV and MS detection – human plasma Trontelj et al., 2007
UV detection – rat plasma and tissue Yang et al., 2007
UV detection – rat tissue Yang, He, Zhang, 2007
UV detection – tablets Pavithra, Sivasubramania, 2006a
UV detection – tablets Reddy et al., 2006
UV detection – tablets Trontelj et al., 2005
Spectrophotometric methods
VIS region – tablets Kalyanaramu, Raghubabu, 2011
VIS region – tablets Kalyanaramu et al., 2011
VIS region – tablets and raw material Basavaiah, Tharpa, Kumar, 2009 UV and VIS region – tablets and raw material Pavithra, Sivasubramanian, 2006b VIS region – tablets and raw material Basavaiah, Kumar, Tharpa, 2008b VIS region – tablets and raw material Annapurna, Rao, Kumar, 2007 VIS region – tablets and raw material Dharuman et al., 2004
VIS region – tablets Liu, 2002
EC method
UV detection – tablets and human plasma Perez-Ruiz et al., 2004 UV – ultraviolet; VIS – visible; MS – mass spectrometry
controled at 32 °C. The voltage was set at 25 kV and the samples were pressure-injected at 45 mbar for 4 s. The background electrolyte (BGE) consisted of 35.0 mmol L-1
borate buffer, and 50.0 mmol L-1 anionic detergent sodium
dodecyl sulfate (SDS) adjusted to pH 8.8 with sodium hydroxide 0.1 mol L-1. The capillary was activated with
sodium hydroxide 1.0 mol L-1. A daily conditioning
of the capillary was performed consisting of washing with sodium hydroxide 1.0 mol L-1 (20 min), ultrapure
water (15 min) and BGE (15 min). Also, between the
sample injections, the capillary was lushed with sodium
hydroxide 0.1 mol L-1 (3 min), ultrapure water (1 min) and
BGE (2 min). Diclofenac potassium was used as internal standard.
The UV absorbance was measured at 284 nm using methanol as solvent in a Shimadzu UV-1601PC (Tokyo, Japan) equipment. The same solvent was used as blank. The UV analyses were made using 1 cm quartz cells.
Samples and standard solutions preparations
HPLC method
Twenty tablets of Evista® were weighed and
average weight was calculated. The tablets were crashed
and stock solution was prepared weighing a quantity equivalent to 10.0 mg of raloxifene and transferred to a
100.0 mL volumetric lask (100.0 µg mL-1) dissolving with
water:acetonitrile (60:40 v/v). Working solutions were prepared by diluting appropriately 1.0 mL of the stock
solution into a 10.0 mL volumetric lask completing the
volume with mobile phase (10.0 µg mL-1).
Stock solution of raloxifene reference substance (RLX RS) was prepared weighing 10.0 mg of RLX RS and dissolving in water:acetonitrile (60:40 v/v). Aliquot
of this solution was diluted to give a inal concentration
of 10.0 µg mL-1.
These stock solutions were stored at room temperature, protected from light and the working
solutions were daily prepared and iltered before injection.
MEKC method
Standard stock solution was prepared in methanol weighing 25.0 mg of RLX RS and transferring into a 25.0 mL volumetric flask (1000.0 µ g mL-1). Working
solution was prepared transferring an aliquot which was
diluted in the BGE to a inal concentration of 80.0 µg mL-1.
was weighed and dissolved in methanol in a 25.0 mL
volumetric lask (1000.0 µg mL-1). From this solution, 0.8 mL was transferred into a 10.0 mL volumetric lask
and volume completed with BGE (80.0 µg mL-1).
A stock solution of the internal standard used in this method was prepared weighing 20.0 mg of potassium diclofenac RS and transferring to a 20.0 mL volumetric
lask diluting with methanol. From this solution 2.0 mL
were transferred into the working solution of standard
and sample, giving a inal concentration of 200.0 µg mL-1.
These stock solutions were stored at room temperature, protected from light and the working
solutions were daily prepared and iltered before injection.
UV method
A quantity of 15.0 mg of RLX RS was weighed and
transferred into 100.0 mL volumetric lask and dissolved
with methanol to prepare the standard stock solution (150.0 µg mL-1). From this solution, an aliquot of 1.0 mL
was transferred into a 20.0 mL volumetric and volume completed with the same solvent.
From the same tablet powder used to both MEKC and HPLC methods, a quantity equivalent to 15.0 mg of RLX was weighed and dissolved with methanol to a concentration of 150.0 µg mL-1 (stock solution). Working
solution was prepared transferring aliquot from the stock solution to a final concentration of 7.5 µ g mL-1 with
methanol.
Method validation
The developed methods were validated according to the International Conference on Harmonization (ICH) guidelines (2003, 2005) by determination of the following parameters:
Specificity
The methods specificity was investigated by observing interferences from RLX tablets excipients. Their concentration was based on information furnished by Handbook of Pharmaceutical Excipients (Rowe, 2009) and calculated in relation of its medium weight. The analyses of the placebo solutions were compared with the results of the tablet solutions to verify the probable interference of the excipients in the RLX determination.
Linearity
The linearity of the methods was evaluated by plotting calibration curves in the range of 3.0-12.0 µg mL-1
for the UV method, 4.0-16.0 µ g mL-1 for the HPLC
method with seven different concentrations for each one,
and 40.0-120.0 µg mL-1 for the MEKC method, with ive
concentrations in this range. All the analyses were made in triplicate every day, during three consecutive days. The values of the peak areas for LC and MEKC methods and UV absorbance were computed and analyzed by linear regression analysis.
Precision
Precision studies were done in terms of repeatability (intra-day precision) and intermediate precision (inter-day precision). The data precision was expressed in percent relative standard deviation (RSD%) of a series of measurements. Repeatability was analyzed through the determination of six samples containing an equivalent amount of 10.0 µg mL-1 RLX from the tablets powder for
the LC method and an equivalent amount of 80.0 µg mL-1
RLX from the tablets powder and 200.0 µ g mL-1 of
potassium diclofenac RS for the MEKC method. For the UV method, samples of RLX tablets powder in three different concentrations (6.0, 7.5 and 9.0 µg mL-1)
in triplicate were analyzed and intra-day precision determined. All the analyses were made in triplicate in the same day. Inter-day precision was studied by comparing the results on three different days.
Accuracy
The accuracy of the methods was evaluated by performing recovery studies. A solution of the RLX
tablets powder with ix concentration was prepared and
aliquots in three different concentrations (80.0, 100.0 and 120.0%) of RLX RS solution were added to the RLX tablet solutions. These solutions were analyzed in triplicate and concentrations and recoveries were calculated against the added concentrations.
Robustness
Robustness of the methods was evaluated by examining the influence of small variations in the analytical parameters of the method. The method should be robust enough with respect to all critical parameters so as to allow routine laboratory use. For the HPLC
method, the changed parameters were: temperature, low
rate, proportion of the mobile phase, pH of the mobile phase and a different column. The effects of changed parameters were evaluated based on the RSD% values obtained among the injections and values of recovery considering the determination value founded as 100%. For the MEKC methods, the changed parameters were combined in a factorial design of 24 calculating and
analyzing the influence of the changes by Minitab®15
acid, concentration of surfactant, pH of the buffer solution, temperature of the analysis and applied voltage. For the UV method the robustness was not evaluated.
(a) LOD and LOQ
The LOD and LOQ values were mathematically
determined through the calibration curve. The factors (3.3 and 10) were multiplied by the ratio from residual standard deviation and slope, according to the ICH guideline (2005).
(b) Degradation studies
The stability-indicating capability of the HPLC and MEKC methods was determined by performing forced degradation of RLX solution under acid/basic hydrolysis, oxidative, thermal and photolytic stress conditions to evaluate the interference of degradation products in the determination of the drug. Acid and basic hydrolysis were performed by subjecting RLX solution to a 24 h exposition to hydrochloric acid 1.0 mol L-1 and sodium
hydroxide 1.0 µg mL-1, respectively, in room temperature
and protected from light. The oxidation degradation was induced by exposing the RLX solution to 3.0% H2O2 for 24 h in room temperature, protected from light. For thermal degradation, the RLX solution in methanol was exposed at 80 °C in an oven for 24 h. For photolytic stress study, the sample in methanol was placed in quartz cuvettes in a light chamber and exposed to UV-A radiation (352 nm) for 24 h. Blank samples were also subjected to the same treatment of the degradation studies and control sample was prepared and stored protected from light. The same treatment was given to the solutions of both methods and samples were prepared and analyzed according to the
respective method. The speciicity of the methods was
established by determining the peak purity in the degraded samples using PDA detector.
RESULTS AND DISCUSSION
Method development
Chromatographic parameters for the HPLC method were optimized to achieve optimal conditions. Effect of the mobile phase composition was studied by varying the proportions of the components (water, acetonitrile and triethylamine) until the proposed composition of 67:33:0,3 v/v based on peak parameters such as symmetry, theoretical plates and capacity factor. The cost and preparation and so the effect on the equipment were also considered, therefore it was used as mobile phase water
instead of buffer solution that it is as eficient as buffer
solutions to perform the chromatographic separations. The retention time obtained was considered suitable and has demonstrated good sensitivity for the determination of the drug proposed. A good separation, with symmetrical peaks, was obtained using a RP C18 column (250 × 4.6 mm) and the mobile phase chosen above. The effect of the temperature was investigated and the optimal temperature
was 30 °C; optimum wavelength for quantiication was
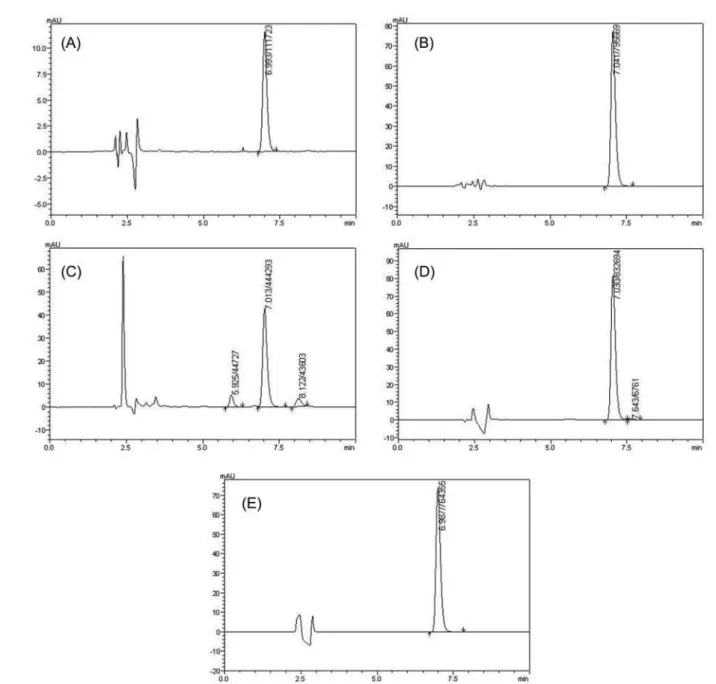
287 nm. The system suitability of the chromatographic system was performed during the development of the method and peak asymmetry, theoretical plate number and RSD of peak areas were determined. For the system suitability, it was found an asymmetry of < 1.5, theoretical plate number of > 8000 and RSD of peak area of < 1.0%. A typical chromatogram of RLX with retention time of
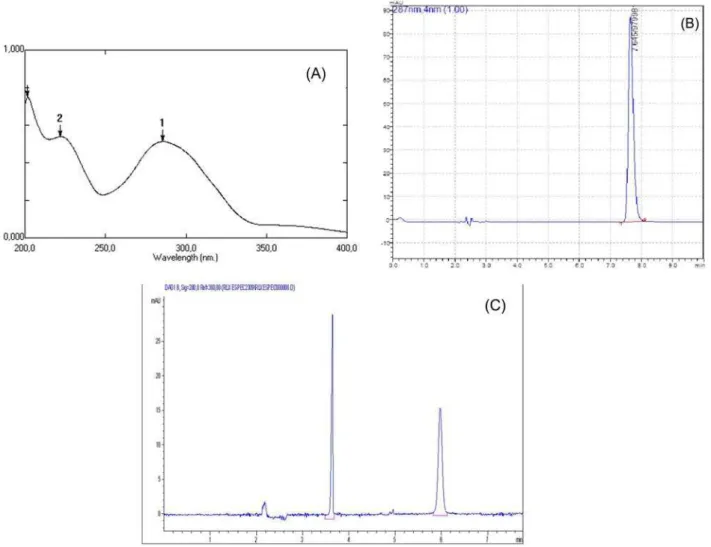
7.6 min is shown in igure 2-A.
For the electrophoretic conditions the inluence of pH, buffer concentration and electric ield on the migration
time and selectivity was investigated. The optimization of
the method was performed irst testing some electrolyte
solutions alone and with addition of surfactant SDS. Also the BGE pH was evaluated in the range of 4.5-6.0 for BGE electrolyte solutions alone and 8.0-9.0 for the solutions added with surfactant. The BGE which had the best results with good separation performance was 35.0 mmol L-1 boric acid and 50.0 mmol L-1 SDS. The
BGE pH 8.8 was selected since at this pH the resolution increased, while analysis time decreased. This pH 8.8 selected BGE obtained the best parameters, such as peak symmetry (about 1.0) and resolution between the peaks. The buffer concentrations varied from 20.0-50.0 mmol L-1
for boric acid and 20.0-60.0 mmol L-1 for SDS keeping the
pH constant at 8.8. The optimum conditions were found to be 35.0 mmol L-1 for boric acid and 50.0 mmol L-1 for
SDS, since above these concentrations the migration time increases; in these conditions suitable peak parameters
were also generated and good eficiency was achieved. The
effect of the voltage applied was investigated and better separation and migration time with acceptable current (about 30.0 µA) was established with 25 kV. The capillary temperature was evaluated and 32°C was chosen, because with the same the analysis time decreased. Due to increase of peak width and deformed shape above 45 mBar and 4 s the sample solutions were hydrodynamically injected at this condition. The optimum wavelength was set on 280 nm
for quantiication of RLX. An internal standard (IS) was used to compensate injection errors and luctuations of
with migration time of 3.6 min (DI) and 6.9 min (RLX), respectively is shown in Figure 2-B.
For the UV method conditions, RLX demonstrated to be completely soluble in methanol; it was selected as solvent, because provided the highest UV absorbance. The optimum wavelength was set on 284 nm. These conditions showed to obey Beer-Lambert’s law. A typical spectrum of RLX is shown in Figure 2-C.
Method validation
Interference from the formulation excipients was evaluated for all the methods. The excipients included povidone, polysorbate 80, lactose 70%, crospovidone, magnesium stearate, titanium dioxide,
hydroxypropylmethylcellulose, polyethylene glycol and propylene glycol. No interference was found in any of
the proposed methods. The speciicity, for the MEKC and
HPLC methods, was established through a determination of the purity peak of the analyte using diode array detector. The peaks were free from any coeluting peak. For the UV method, it was observed in the comparison of the spectrum of the drug solution and the solution containing excipients of the formulation that no interference occurred.
To check the linearity, a standard curve was constructed and the statistical parameters of the analytical curve for MEKC, HPLC and UV methods are presented in table 2. The calibration curves proved to be linear in concentration range of 40.0-120.0 µ g mL-1 for MEKC,
4.0-16.0 µ g mL-1 for HPLC and 3.0-12.0 µ g mL-1. All
FIGURE 2 - RLX solutions: (A) typical UV spectrum of RLX in 7.5 µg mL-1, (B) typical chromatogram of RLX in 10.0 µg mL-1,
chromatographic conditions - NST column C18 (250 x 4.6 mm x 5µ m), mobile phase of water:acetonitrile:triethylamine
(67:33:0,3 v/v), low rate 1.0 mL min-1, injection volume 20.0 µl, UV detection 287 nm and analysis temperature 30 °C, (C) typical
TABLE II - Linearity and precision of UV, HPLC and CE methods for quantiication of hydrochloride raloxifene in tablets
Parameters UV HPLC CE
Linearity 3.0-12.0 µg mL-1 4.0-16.0 µg mL-1 40.0-120.0 µg mL-1
Intercept 0.0099 11091 0.0443
Slope 0.0672 74555 0.0156
Correlation coeficient 0.9994 0.9992 0.9991
LOD 0.1 µg mL-1 0.5 µg mL-1 12.1 µg mL-1
LOQ 0.3 µg mL-1 1.5 µg mL-1 36.6 µg mL-1
Precision
Day I II III I II III I II III
Intraday* 101.09 100.29 102.35 99.24 99.39 101.69 99.07 99.51 101.07
RSD% 1.27 0.94 1.12 0.61 0.64 0.72 2.05 1.94 1.83
Interday ** 101.57 100.11 99.84
RSD % 1.12 1.37 2.03
HPLC and CE - n = 6; ** HPLC and CE - n = 18; UV - n = 9 ;UV - n= 27
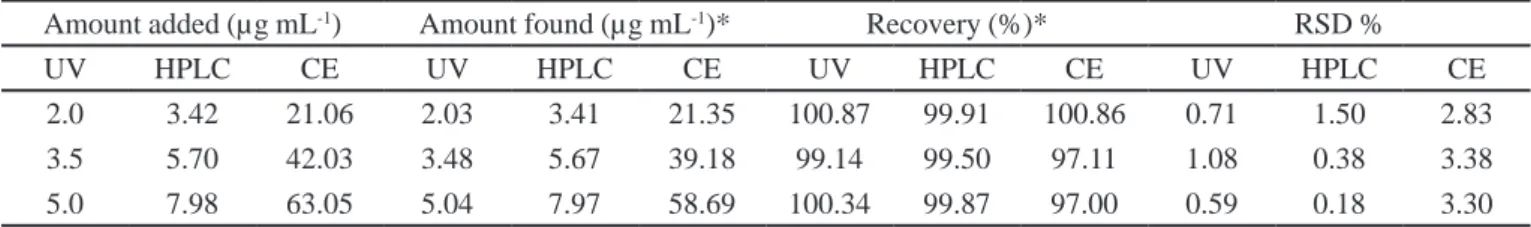
TABLE III - Accuracy data (recovery studies) of UV, HPLC and MEKC methods for quantiication of hydrochloride raloxifene in
tablets
Amount added (µg mL-1) Amount found (µg mL-1)* Recovery (%)* RSD %
UV HPLC CE UV HPLC CE UV HPLC CE UV HPLC CE
2.0 3.42 21.06 2.03 3.41 21.35 100.87 99.91 100.86 0.71 1.50 2.83
3.5 5.70 42.03 3.48 5.67 39.18 99.14 99.50 97.11 1.08 0.38 3.38
5.0 7.98 63.05 5.04 7.97 58.69 100.34 99.87 97.00 0.59 0.18 3.30
*Average of three determinations
methods showed good linearity with correlation coeficient (r) greater than 0.999 and linear regression was veriied by means of analysis of variance (ANOVA) and demonstrated
no deviation from linearity. All plots were based on analyte concentrations versus UV absorbance (UV), peak area response ratios (HPLC) and ratios of standard drug peak
areas to internal standard peak areas (MEKC). The LOD and LOQ were calculated and estimated to be 0.5 µg mL-1
and 1.5 µ g mL-1, respectively, for the HPLC method,
12.1 µ g mL-1 and 36.6 µ g mL-1 for the MEKC method
and 0.1 µ g mL-1 and 0.3 µ g mL-1 for the UV method. MEKC method obtained higher values for LOD and LOQ,
nevertheless, suitable sensitivity for the method. UV and HPLC methods demonstrated great sensitivity with
low LOD and LOQ values. Among the methods, the UV provided the lowest LOD and LOQ for the analysis of RLX.
Repeatability (intra-day) and intermediate (inter-day) precision for the three methods were determined and they were expressed as the RSD% of the results that are summarized in Table 2. In most cases, the variability of the results was low with RSD% of UV and HPLC method
was less than 1.5% for repeatability and intermediate precision. For the MEKC method, the RSD% obtained was within 2.0% for both intra e inter-precision. RSD values found for all the methods were within the acceptable range indicating that the methods proposed have good repeatability and low inter-day variability.
Recovery studies were performed using standard addition technique covering 80-120% (three levels concentration) of the nominal sample concentration to determine the accuracy of the methods and the results are presented in Table III. The RLX accuracy results showed % recoveries ranging from 99.14-100.76% for the UV method with RSD% lower than 1.5% and for HPLC method ranged from 99.50-99.91 with RSD% within 1.5%. These values obtained from the recovery results showed good accuracy for the UV and HPLC methods. For MEKC method, the recovery varied from 97.0-100.87% and showed values of RSD up to 3.38%, even though it varied more than the other methods still showed good accuracy.
HPLC method and in Figure 3 for the MEKC method. For the HPLC method it was varied to determine the robustness
chromatographic parameter such as low, proportion of the
mobile phase (water and acetonitrile), temperature of the column, pH of the mobile phase and different brand column. In the MEKC method, the electrophorectic conditions changed were concentration of boric acid, concentration of the surfactant used, pH of the buffer solution, temperature of analysis and applied voltage. For both methods only
non-signiicant changes in migration time and peak area
ratios are observed. All the recovery percentages obtained from the parameter changes varied less than 5.0% and the RSD obtained from the injections was less than 1.0%
indicating the robustness of the method. The inluence on
the analysis conditions of MEKC method was determined by factorial design and is presented in a Pareto Chart. As the
Pareto Chart shows, there was non-signiicant inluence of all parameter changes in the quantiication of RLX; so the
method was considered robust.
The speciicity and stability-indicating capability of
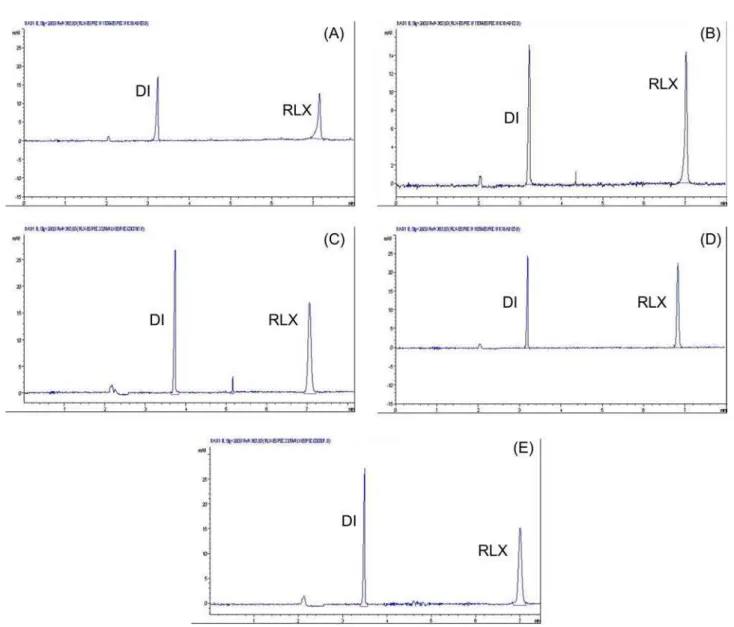
the MEKC and HPLC methods were evaluated by analysis of samples submitted to stress testing of RLX under different conditions. The proposed methods yielded to achieve peak purity to guarantee selectivity of the methods. No stability-indicating methods for determination of RLX have been reported. The results showed that when RLX
was submitted to acidic condition there was a signiicant
area decrease higher than 50.0% for both methods (Figure 4-A and Figure 5-A) and no peaks of degradation products were observed. For the oxidative conditions there was around 50.0% and 10.0% of area decrease for HPLC (Figure 4-C) and MEKC method (Figure 5-C), respectively. In the chromatogram of the HPLC method (Figure 4-C), peaks of degradation products were observed at 5.9 min and at 8.1 min, also at about 3.0 min. Another condition in which peak of degradation product was observed, was the photolytic condition, where the additional peak appeared in the
chromatogram at about 8.0 min (Figure4-D). No signiicant
area decrease occurred in this condition, as well as for the basic (Figure 4-B) and thermal conditions (Figure 4-E), corresponding to less than 5.0%. In the two last conditions no additional peaks were observed in the chromatograms. In the electropherograms of MEKC method (Figure 5), no additional peaks of degradation products were observed in any of the stress conditions to which RLX was submitted. It was observed the sensibility of MEKC method is probably less than the HPLC method, since it was necessary to work with higher concentrations. These samples were considered suitable for the methods development, since degradations products could be observed. The peak purity indexes
conirmed that for both methods there was no interference
of any other substances at the RLX and degradations products peaks; also no interference in the DI RS peak in MEKC method, showing that they were 99.9% pure in all
circumstances. It was veriied that the RLX peak presents
appropriate resolution and selectivity in relation to the degradation products formed. Analyzed by diode-array detector, the degradation products detected in the HPLC method had the same spectrum as RLX. This means that probably the structure of the same is very similar with the RLX structure.
According to these results, these proposed methods (HPLC and MEKC) can be considered stability-indicating, since they succeeded in separate and evaluate qualitatively and quantitatively the RLX in presence of degradation
TABLE IV - Robustness of HPLC method
Parameter RSD* Recovery (%)**
Proposed method 0.25
Different column 0.44 100.1
Temperature 29°C 0.04 100.6
Temperature 31°C 0.07 100.2
Flow 0,95ml/min 0.07 100.5
Flow 1,05ml/min 0.10 100.4
Water:acetonitrile (66:34) 0.08 100.3 Water:acetonitrile (68:32) 0.10 100.4
pH 3.4 0.11 100.2
pH 3.6 0.05 100.1
* between three injections; ** amount obtained with proposed method was considered 100.0%
FIGURE 3 - Robustness of MEKC method (Pareto chart of
FIGURE 4 - HPLC Chromatograms of RLX solutions submitted to forced degradation for 24 h (A) acidic hydrolysis (HCl
1.0 mol L-1), (B) basic hydrolysis (NaOH 1.0 mol L-1), (C) oxidative stress (H
2O2 3.0%), (D) photolytic stress (UV 352nm) and (E) heat stress (80 °C). Chromatographic conditions: NST column C18 (250 x 4.6 mm x 5µm), mobile phase of water:acetonitrile:tr
iethylamine (67:33:0,3 v/v), low rate 1.0 mL min-1, injection volume 20.0 µl, UV detection 287 nm and analysis temperature 30 °C.
products formed. Thus, the degradation studies showed that this drug is susceptible to acidic hydrolysis and oxidation and apparently not susceptible to basic hydrolysis, thermal and photolytic degradation.
Comparison between UV, HPLC and MEKC methods
The proposed methods were compared statistically
by ANOVA, using F-test. The results (Table V) showed
that there was no significant difference between the
experimental values obtained for the tablets by the three methods. The calculated F-value (0.99163) was found to be less than the critical F-value (3.17879) at 5.0% of significance level. This result shows that the three methods are equivalent for the quantitative determination of raloxifene hydrochloride in formulations.
Determination of RLX in tablets
FIGURE 5 - MEKC electropherograms of RLX solutions submitted to forced degradation for 24 h (A) acidic hydrolysis (HCl
1.0 mol L-1), (B) basic hydrolysis (NaOH 1.0 mol L-1), (C) oxidative stress (H
2O2 3.0%), (D) photolytic stress (UV 352 nm) and (E) heat stress (80°C). Electrophoretic conditions: BGE of boric acid 35.0 mmol L-1 + SDS 50.0 mmol L-1 pH 8.8, fused-silica capillary column (40.0 cm length x 50 µm i.d.), hydrodynamic injection time of 4 s at pressure 45 mBar, separation voltage 25 kV and column temperature 32 °C with detection at 280 nm.
TABLE V - Comparison between UV, HPLC and MEKC methods
UV HPLC CE
Average (%) 100.58 100.11 99.88
RSD 1.09 1.31 2.03
ANOVA (p = 0.05) Fcal = 0.99163 < Fcrit = 3.17879
are presented in Table VI and it showed that the amount founded for UV method was 59.76 mg (RSD 0.2), 59.41 mg for the HPLC (RSD 0.15) and 59.87 mg for the MEKC method (RSD 0.17). The tablets have 60.0 mg of
TABLE VI - Percent label amounts of hydrochloride raloxifene in tablets
Amount found (mg/tablet) RSD %
Labeled amount (mg/tablet) UV HPLC MEKC UV HPLC MEKC
60.0 59.76 59.41 59.87 0.20 0.15 1.17
CONCLUSIONS
The proposed UV, HPLC and MEKC methods are simple, precise, accurate and easy to execute. All methods used simple reagents with minimal sample preparation procedures. The HPLC and MEKC methods can be considered stability indicating, due to the capability to detect RLX in presence of degradation products, therefore they were recommended for determination of the drug and degradation products in stability study samples, especially the HPLC method. All the methods were successfully applied for quantitative determination of RLX in pharmaceutical dosage form and suitable for routine analysis of drug in formulation.
ACKNOWLEDGMENTS
This work was supported by INCT IF (Instituto
Nacional de Ciências e Tecnologia Inovações
Farmacêuticas) and the author wish to thank CNPq
(Conselho Nacional de Desenvolvimento Científico e
Tecnológico) for the support.
REFERENCES
ANNAPURNA, M.; RAO, B.; KUMAR, R. Spectrophotometric
determination of raloxifene hydrochloride in pharmaceutical formulations. E-J. Chem., v.4, p.79-82, 2007.
AGÊNCIA NACIONAL DE VIGILÂNCIA SANITÁRIA.
ANVISA. Bulário eletrônico. Available at: <http://www4. anvisa.gov.br/>. Accessed on: 19Jan. 2012.
BASAVAIAH K.; KUMAR U.R.A.; THARPA K. Gradient HPLC analysis of raloxifene hydrochloride and its aplications to drug quality control. Acta Pharm., v.58, p.347-356, 2008a.
BASAVAIAH, K.; KUMAR, U.R.A.; THARPA, K. Validated spectophotometric methods for the determination of raloxifene hydrochloride in pharmaceuticals. J. Chil. Chem. Soc., p.1635-1639, v.53, 2008b.
B A S AVA I A H , K . ; T H A R PA , K . ; K U M A R , V. ; RAJEDRAPASAD, N.; HIRIYANNA, S.; VINAY, K.
Optimized and validated spectrophotometric methods for
the determination of raloxifene in pharmaceuticals using permanganate. Arch. Pharm. Res., v.32, p.1271-1279, 2009.
BRUNTON, L.; PARKER, K.; BLUMENTHAL, D.; BUXTON
I. Goodman & Gilman: manual de farmacologia terapêutica. Porto Alegre: AMGH Editora, 2010. p.1003-1004.
DHARUMAN, J.; RAVICHANDRAN, V.; THIRUMOON
N.; DHARRAMSI A. Spectrophotometric analysis of raloxifene hydrochloride in pure and pharmaceutical formulations. Pharmazie, v.59, p.720-721, 2004.
INTERNATIONAL CONFERENCE ON HARMONISATION.
ICH. ICH-Q1A(R2) Guideline for Industry: Stability Testing of New Drugs Substance and Products, 2003.
INTERNATIONAL CONFERENCE ON HARMONISATION.
ICH. ICH-Q2(R1) Guideline for Industry: Validation of Analytical Methods Text and Methodology, 2005.
JANCIC-STOJANOVIC, B.; RAKIC, T.; KOSTIC, N.; VEMIC, A.; MALENOVIC, A.; IVANOVIC, D.; MEDENIA, M.
Advancement in optimization tactic achieved by newly developed chromatographic response function: application to LC separation of raloxifene and its impurities. Talanta, v.85, p.1453-1460, 2011.
KALYANARAMU, B.; RAGHUBABU, K.; KUMAR, Y.;
JAGANNADHARAO, V.A novel method for estimation
of raloxifene hydrochloride in bulk and pharmaceutical preparations by visible spectrophotometry. Pharm. Chem., v.3, p.250-256, 2011.
KALYANARAMU, B.; RAGHUBABU, K. Determination of raloxifene hydrochloride by oxidative coupling reaction in pharmaceutical formulations. Int. J. Appl. Pharm., v.3, p.6-9, 2011.
KUMAR, B.V.; KUMAR, K.P.; SUNESH, K.; APSAR, S.; SRI KANTH, P.; SUNEETHA, Y. Development and validation of RP-HPLC method for determination of raloxifene hydrochloride from pharmaceutical preparation. J. Chem. Pharm. Res., v.3, p.784-791, 2001
LIU, S. Fading spectrophotometric method for the determination of raloxifene with evans blue. Fenxi Huaxe, v.30, p.1486-1489, 2002.
NATIONAL CANCER INSTITUTE. NCI. Cancer Drug
Information. Available at: <http://www.cancer.gov/ cancertopics/druginfo/raloxifenehydrochloride>. Accessed on: 19 Jan. 2012.
PAV I T H R A , D . C . ; S I VA S U B R A M A N I A N , L . N e w s p e c t r o p h o t o m e t r i c d e t e r m i n a t i o n o f r a l o x i f e n e hydrochloride in tablets. Indian J. Pharm. Sci., v.68, p.375-376, 2006b.
PAVITHRA, D.C.; SIVASUBRAMANIAN, L. RP-HPLC estimation of raloxifene hydrochloride in tablets. Indian J. Pharm. Sci., v.68, p.401-402, 2006a.
PEREZ-RUIZ, T.; MARTINEZ-LOZANO, C.; SANZ, A.; BRAVO, E. Development and validation of a quantitative
assay for raloxifene by capillary electrophoresis. J. Pharm. Biomed. Anal., v.34, p.891-897, 2004.
RANG, H.P.; DALE, M.M.; RITTER J.M.; FLOWER, R.J.
Rang & Dale’s pharmacology. 6.ed. New York: Churchill/ Livingstone, 2006. p.467-469.
REDDY, P.; RANI, B.; BABU, G.; SESHAGINI, J. RP-HPLC Determination of raloxifene in pharmaceuticals tablets. E-J. Chem., v.3, p.60-64, 2006.
ROWE, R.C. Handbook of pharmaceutical excipients. 6.ed.
London: Pharmaceutical Press, 2009. p.208, 314, 376, 404, 517, 581, 592, 741.
SUNEETHA, D.; LAKSHMANA, R. A new validated RP-HPLC method for the estimation of raloxifene in pure and tablet dosage form. Rasayan J. Chem., v.3, p.117-121, 2010.
TRONTELJ, J.; VOVK, T.; BOGATAJ, M. HPLC analysis of
raloxifene hydrochloride and its aplications to drug quality control studies. Pharmacol. Res., v.52, p.334-339, 2005.
TRONTELJ, J.; BOGALAJ, M.; MAVE, J.; MRHAR, H.
Development and validation of liquid cromatograph-tandem mass spectrometry assay for determination of raloxifene and its metabolites in human plasma. J. Chromatogr. B., v.855, p.220-227, 2007.
YANG, Y.; ZHANG, F.; HE, X.; ZHAO, G.; ZHANG, Y.
Validation of a novel HPLC method for the determination of raloxifene and its pharmacokinetics in rat plasma. Chromatographia, v.65, p.197-201, 2007.
YANG, Z.; HE, X.; ZHANG, Y. The determination of raloxifene in rat tissue using HPLC. Biomed. Chromatogr., v.21, p.229-233, 2007.
![FIGURE 3 - Robustness of MEKC method (Pareto chart of the effects – []tampão =concentration of boric acid, []sds = concentration of the surfactant, pH = pH of the buffer solution, temp = temperature of the analysis, volt = applied voltage of the analy](https://thumb-eu.123doks.com/thumbv2/123dok_br/15413674.587239/8.892.63.436.454.703/figure-robustness-concentration-concentration-surfactant-solution-temperature-analysis.webp)