*Correspondence: K. C. Leandro. Instituto Nacional de Controle de Qualidade em Saúde, Fundação Instituto Oswaldo Cruz. Avenida Brasil, 4365–Manguinhos – 21090-000 - Rio de Janeiro, RJ, Brasil. E-mail: katia.leandro@incqs,iocruz.br
A
vol. 45, n. 2, abr./jun., 2009
Development and validation of an electroanalytical methodology
for determination of isoniazid and rifampicin content in
pharmaceutical formulations
Katia Christina Leandro*
1, Juliana Machado de Carvalho
1, Luiz Fernando Giovanelli
1, Josino
Costa Moreira
21National Institute for Health Quality Control, Oswaldo Cruz Foundation/FIOCRUZ, 2Center of Health Studies of Worker and
Human Ecology, Oswaldo Cruz Foundation/FIOCRUZ
Tuberculosis remains a major public health problem, especially in developing countries. Brazil presents the largest number of cases in Latin America and is among the 22 countries considered priorities by the World Health Organization (WHO). The Rio de Janeiro state has the largest number of cases registered in the country. The treatment of patients, commonly, makes use of the drugs isoniazid and rifampicin for six months. This study aimed to develop and validate an electroanalytical methodology, using the technique of differential pulse voltammetry for the determination of these drugs in the associated form, in order to evaluate the quality of medicines distributed in the state of Rio de Janeiro. The potential reduction for the isoniazid and rifampicin were -1.10 and -0.90 V. The developed and validated electroanalytical method presented a linear range of 0.25 to 1.25 mg/L to isoniazid, limits of detection and quantiication of 0.05 and 0.14 mg/L, and recovery of 98.2 ± 0.4%; a tracking linear of 0.40 to 2.00 mg/L for rifampicin, with limits of detection and quantiication of 0.07 and 0.19 mg/L and recovery of 95.8 ± 0.6%. Six lots of medicines from two pharmaceutical companies were analyzed. Only one of the samples showed unsatisfactory levels of rifampicin.
Uniterms: Isoniazid. Rifampicin. Tuberculosis/treatment. Tuberculostatics/quantitative analysis. Differential pulse voltammetry.
A tuberculose continua sendo um importante problema de saúde pública, especialmente em países em
desenvolvimento. O Brasil apresenta o maior número de casos da América Latina, estando entre os 22
países considerados prioritários nas ações de controle da doença pela Organização Mundial da Saúde (OMS). No Brasil, o Rio de Janeiro é o estado com o maior número de casos registrados no país. O tratamento de doentes com tuberculose faz uso dos fármacos isoniazida e rifampicina durante seis meses. O presente trabalho objetivou desenvolver e validar metodologia eletroanalítica, utilizando a técnica de voltametria de pulso diferencial, para a determinação desses dois princípios ativos na forma associada e avaliar a qualidade dos medicamentos distribuídos no estado do Rio de Janeiro. Os potenciais de redução para a isoniazida e rifampicina foram respectivamente -1,10 e -0,90 V. O método eletroanalítico desenvolvido e validado apresentou para a isoniazida faixa linear de 0,25 a 1,25 mg/L, limites de detecção e quantiicação de 0,05 e 0,14 mg/L e recuperação de 98,2 ± 0,4%; para a rifampicina faixa linear de 0,40 a 2,00 mg/L, limites de detecção e quantiicação de 0,07 e 0,19 mg/L e recuperação de 95,8 ± 0,6%. Foram analisados 6 lotes de medicamentos de dois laboratórios farmacêuticos. Apenas uma das amostras apresentou teor de rifampicina insatisfatório.
INTRODUCTION
The World Health Organization (WHO), since 1993, stated alert status in the world respecting to tuberculosis, which represents a great challenge in terms of world public health. A third of human population is infected by Mycobacterium tuberculosis and great proportion of them could develop and transmit the disease for the community (Kritisk et al., 2007). According to World Health Organi -zation, it is estimated that about 100 million of people are yearly infects, all over the world, out of which eight to ten million will develop the disease along their lives; a half of infected will present the contagious form and three million of them will die, every year (Freire, Bonametti, Matsuo, 2007). The tuberculosis is one of the main causes of death for infectious diseases, being responsible for 1.6 million of deaths all over the world, in 2005. This situation is aggravating since de appearance of AIDS (WHO, 2007).
Brazil occupies the 13th place in the ranking of 22 countries concentrating 80% of tuberculosis cases in the world. According to official data from the Ministry of Health, in Brazil there are, currently, about 50 million pe -ople infected with the Koch bacillus, but without disease development; with a contamination of more than 1 million people every year, due to contact with sick persons. Yearly in Brazil, approximately, 111thousand new cases appear and 6 thousand deaths occur, being Rio de Janeiro the state with higher number of registered cases yearly, approxima -tely 17,000; which corresponds to 20% of registered cases in the country (Souza, Vasconcelos, 2005). In the state of Rio de Janeiro, the disease was declared as priority since 1999 and the Program of Tuberculosis Control was been working hardly in the last years, in order to reverse this picture (Secretaria, 2008).
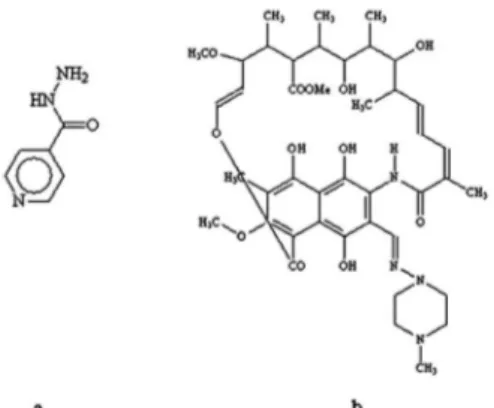
The treatment of tuberculosis patients is done with short duration chemotherapy during six months, including isoniazid, rifampicin and pyrazinamide during the irst two months, followed by isoniazid and rifampicin (Figure 1) during the next four months. The use of these last two drugs is justiied, based on their activity on the intracellular slow growing bacilli, as well as on those of intermittent growing present on caseous necrosis, which is essential for the successful sterilization of tissular lesions (Dalcolmo, Andrade, Picon, 2007).
The voltammetry technique is based on the study of potential-current curves (voltammograms) resulting from processes of electrons transference. These processes occur in the surface of a work electrode, always as a process of electrons transference (reduction or oxidation of electro -chemically active species) is observed, as a function of applied potential.
The analytical importance of voltammetry is origina -ted from two characteristics of obtained voltammograms. Firstly, the position of analytical signals respecting to applied potential could be utilized as a useful tool, in the identiication of electroactive species. Secondly, under speciic experimental conditions, the limiting current is governed by the concentration of electroactive species in the analyzed solution (Bard, Faulkner, 2001), which allows the use of this technique for quantitative analysis.
The electroanalytic methodology for the determi -nation of isoniazid and rifampicin in the medications utilized for tuberculosis treatment was developed, uti -lizing the differential pulse voltammetry. The isoniazid and rifampicin posses electroactive site and are reduced on the work electrode surface (Hanging Mercury Drop Electrode – HMDE).
Studies based in electroanalytical techniques are reported in the literature, as for the determination of iso -niazid, as for the characterization of its electrochemical behavior. Lund (1963), employing the polarography, has evidenced that isoniazid presents, in acid medium, two reduction waves. The irst one is attributed to amide group reduction, after transference of two electrons; the second corresponds to reduction of pyridinic ring involving the same number of electrons. Sulaiman and Hameed (1988) reported the determination of isoniazid and other hydra -zides using the polarography of differential pulse, which was applied in the determination of a ternary mixing with other hydrazides. Rodrigues-Mellado et al. (1993) have studied the oxidation of isoniazid on mercury electrode, in a pH interval between 6 and 13. Angulo et al. (1993) reported that polarographic reduction of isoniazid is characterized by two waves in pH <9.5. The irst one is referred to reduction of C=N binding present in the pyri -dinic ring of the molecule and the second results from the reduction of hydrazide group, which leads to ammonia formation. Tong et al. (1997) described the voltammetric determination of isoniazid on vitreous carbon electro -de. Ghoneim et al. (2003) reported the utilization of a procedure of voltammetry of adsorptive redissolution, employing a mercury electrode for the determination of isoniazid in pharmaceutical formulations and in biologic luids. Wahdan (2005) and Liang et al. (2007) studied the voltammetric behavior of rifampicin oxidation, reporting that the mechanism involves the same typical number of electrons and protons as for hydroquinones.
carbon paste. Lomillo et al. (2001) reported the utilization of a mathematic model to obtain a voltammetric resolution of ternary mixings containing rifampicin, isoniazid and pyrazinamide, employing polarography of differential pulse.
In this sense, the proposal of this work was to de -velop and validate an electroanalytical methodology for the determination of isoniazid and rifampicin drugs in the associated form in medications utilized for tuberculosis treatment, and evaluate the quality of these medications distributed in Rio de Janeiro state.
MATERIAL AND METHODS
Equipment and laboratory glasses
The voltammograms in differential pulse were registered utilizing the voltammetric system of Metrohm model 757 VA Computrace coupled to an electrochemical cell composed by three electrodes: hanging mercury drop electrode (HMDE) as work electrode, Ag/AgCl, KCl (3 mol/L) as reference electrode and platinum as auxiliary electrode.
All volumetric lasks and pipettes were calibrated.
Reagents and samples
All solutions were done utilizing ultrapure water from the Milli-Q system (Millipore).
All utilized reagents were of analytic grade (Merck). The support electrolyte was the monoacid sodium phosphate 0.2 mol/L and citric acid 0.1 mol/L (buffer McIlvaine pH 7.0).
The reference chemical substances isoniazid and rifampicin, utilized as standards, were obtained from Brazilian Pharmacopoeia.
Four lots of capsules of isoniazid and rifampicin (1,
2, 3 and 4), coming from Laboratory A, were analyzed. According to this laboratory, such capsules contained 200 mg of isoniazid and 300 mg of rifampicin. Two other lots (5 and 6) of tablets, from Laboratory B, were also analyzed. According to the package of lot 5, the content was 200 mg of isoniazid and 300 mg of rifampicin; and respecting lot 6, the content was 100 mg of isoniazid and 150 mg of rifampicin.
The electroanalytical methodology for the determi -nation of isoniazid and rifampicin, in medications utilized for tuberculosis treatment, was developed utilizing the differential pulse voltammetry.
The work, reference and auxiliary electrodes were the hanging mercury drop electrode (HMDE), Ag/AgCl, (KCl 3 mol/L) and platinum, respectively.
The analytical curves were built adding in the electrochemical cell, 5 consecutive portions of 50 µL of isoniazid (50 mg/L) and rifampicin (80 mg/L) standards and varied amounts of buffer McIlvaine pH 7, in order to obtain the cell total volume of 10.0 mL. The inal con -centrations, therefore, were of 0.25, 0.50, 0.75, 1.00 and 1.25 mg/L for the isoniazid and 0.40, 0.80, 1.20, 1.60 and 2.00 mg/L for the rifampicin. The solution was deaired for 5 minutes with nitrogen for the removal of oxygen and, next, static for some seconds before the step of scanning in the cathodic sense. Table I presents the optimized operatio -nal parameters for determination of these active principles, in medication samples in form of tablets or capsules.
All measurements were done in 10.0 mL of solution and in triplicate, as in the analytical curve preparation, as in the analyzed samples.
The developed electroanalytical methodology was validated according the document of INMETRO (INME -TRO, 2007). The evaluated parameters were: linearity (work range), detection and quantiication limits, preci -sion (repeatability and intermediate preci-sion), accuracy (recovery) and robustness. For the parameter robustness,
FIGURE 1 – Molecular structures of isoniazid (a) and rifampicin
(b).
TABLE I – Experimental parameters for the determination of isoniazid and rifampicin in medicines by differential pulse voltammetry
Voltammetric Parameters Optimized Value
Initial potential -0.80 V
Final potential -1.20 V
Scanning velocity 10 mV/s
Pulse amplitude 50 mV
Balance time 5 s
electrolyte pH and scanning velocity were evaluated. The software Statistic 8.0® (Statsoft) was used to determine the limits of detection and quantiication.
The methodology developed was also compared with the oficial method (high performance liquid chroma -tography) professed in The United States Pharmacopeia (USP 31, 2008).
After the methodology validation, the determinations of associated isoniazid and rifampicin, in form of capsules and tablets medications produced by two Pharmaceutical Companies (A and B), were developed. The samples mass was calculated and weighted utilizing the parametric values professed by the manufacturers, and dissolved in 1 mL of methanol and buffer McIlvaine pH 7 within a volumetric lask of 50 mL, in order to locate the obtained concentration around the middle of analytical curve.
RESULTS AND DISCUSSION
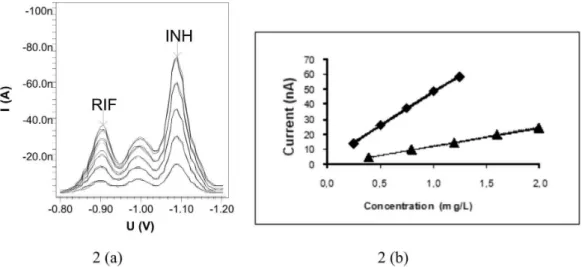
The isoniazid and rifampicin were determined by differential pulse voltammetry, according to experimental conditions described at Table I. In the voltammogram of isoniazid, two peaks were found, meaning two different electroactive sites in the respective molecule, in -0.98 V and in -1.10 V; with the latter one presenting the higher current. Because of that, the peak in -1.10 V was chosen for the building of analytical curve. For the rifampicin, it was found a single peak around -0.90 V (Figure 2).
The work ranges were of 0.25 to 1.25 mg/L (y (na) = 45.29 (mg/L) + 2.752; r2 of 0.9990) for the isoniazid (INH) and of 0.40 to 2.00 mg/L (y (na) = 12.64 (mg/L) – 0.9380; r2 of 0,9992) for the rifampicin (RIF).
To evaluate the two determination methods of associated isoniazid and rifampicin, Differential Pulse
Voltammetry (DPV – our developed method) and high performance liquid chromatography (HPLC – official method – UPS 31, 2008) were used. The bilateral test F, with 95% of conidence interval and (F6.6) grades of liberty was applied. To express the results accuracy, the standard deviation and relative standard deviation of every conjunct of determinations referring to sample of lot 5, coming from Pharmaceutical Company B, were calculated. Through the obtained results, with was possible to verify that the methods do not present statistically signiicant differences and the calculated values for the relative standard devia -tion were below 2% (Haswell, 1992), demonstrating so accuracy in both methods. For the calculations of isoniazid and rifampicin tenor in the analyzed medication, the values professed by its manufacturer were adopted. The method accuracy was evaluated by repeatability and intermediate accuracy (the same previous determinations, but in diffe -rent days), as described at Table II.
The developed electroanalytical methodology was validated according the parameters described in the orien -tation document from INMETRO (INMETRO, 2007).
During the pH study, it was verified a cathodic displacement of peak potential with an increase of pH, as for INH, as for RIF; however, between the pH 6.5 and 7.5 such displacements were practically absent. Respec -ting to pH, the method was robust for this narrow pH range. The obtained validation results are described at Table III.
After the validation of developed electroanalytical method, the medication samples from Pharmaceutical Companies A and B containing isoniazid and rifampicin in the associated form, were analyzed taking as a base the analytical curves presented at Figure 2. The obtained results are described at Table IV.
FIGURE 2 – Voltammograms (a) and analytical curves (b) of INH (¿) 0.25; 0.50; 0.75; 1.00 and 1.25 mg/L and of RIF (p) 0.40;
TABLE II – Comparison of ‘high performance liquid chromatography’ and ‘differential pulse voltammetry’ methods for determination of both, isoniazid and rifampicin, associated into a pharmaceutical formulation
Method of determination
Tenor (%) * Repeatability RSD (%) Intermediate
Accuracy RSD (%) (n=14) First day (n=7) Second day (n=7) First day (n=7) Second day (n=7)
ISONIAZID
HPLC 98.4 ± 0.2 98.0 ± 0.1 0.4 0.3 0.5
DPV 97.6 ± 0.3 98.2 ± 0.2 0.6 0.7 0.7
RIFAMPICIN
HPLC 97.0 ± 0.4 97.6 ± 0.3 0.8 0.9 1.1
DPV 96.4 ± 0.5 96.8 ± 0.5 0.6 0.7 0.9
* Composition of formulation: 200 mg/capsule of isoniazid and 300 mg/capsule of rifampicin.
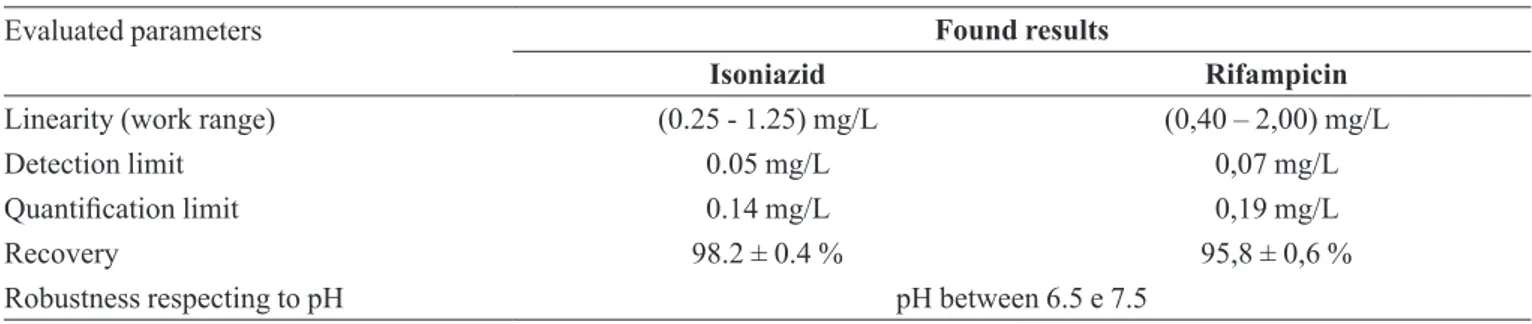
TABLE III – Evaluated parameters in the validation of electroanalytical methodology, according to document of INMETRO, 2007
Evaluated parameters Found results
Isoniazid Rifampicin
Linearity (work range) (0.25 - 1.25) mg/L (0,40 – 2,00) mg/L
Detection limit 0.05 mg/L 0,07 mg/L
Quantiication limit 0.14 mg/L 0,19 mg/L
Recovery 98.2 ± 0.4 % 95,8 ± 0,6 %
Robustness respecting to pH pH between 6.5 e 7.5
TABLE IV – Results found in medications from Pharmaceutical Companies A and B, using differential pulse voltammetry, under
the conditions described at Table I
Sample (Lot) (*) Pharmaceutical
Company Recovery (%) Isoniazid Rifampicin
(n=7) Accuracy RSD (%) Recovery (%) (n=7) Accuracy RSD (%)
1 A 96.1 ± 0.8 1.3 94.3 ± 0.7 1.0
2 A 94.2 ± 0.4 1.0 89.0 ± 0.9 1.4
3 A 98.3 ± 0.6 1.1 91.7 ± 0.6 1.2
4 A 100.9 ± 0.5 0.5 101.0 ± 0.8 0.2
5 B 97.6 ± 0.6 0.8 96.4 ± 0.9 1.4
6 B 98.4 ± 0.8 1.1 96.7 ± 0.9 1.3
* Values professed by manufactures: Lots 1, 2, 3 and 4 - 200 mg of isoniazid and 300 mg of rifampicin per capsule. Lot 5 - 200 mg of isoniazid and 300 mg of rifampicin per tablet. Lot 6 - 100 mg of isoniazid and 150 mg of rifampicin per tablet.
To evaluate the obtained results of isoniazid and rifampicin tenors in the analyzed samples, the acceptable ranges at USP 31, of 90 to 110% for isoniazid and 90 to 130% for rifampicin, both respecting to the value profes -sed by manufacturer, were consulted.
Both, as the samples from Pharmaceutical Company A, as those from Pharmaceutical Company B, presented satisfactory results respecting the isoniazid tenor. For the
rifampicin tenor, only one sample (Lot 2) presented a non-satisfactory result.
CONCLUSIONS
-mance liquid chromatography, such active principles could also be determined through differential pulse voltammetry (DPV), the technique developed and validated in this work.
Through the electroanalytical methodology, it was possible to determine simultaneously the isoniazid and rifampicin. The method was validated, being obtained satisfactory results, and presenting some advantages respecting to official method (USP 31), such as lower analysis time (approximately three times lower), operation practicability of equipment, higher easiness in preparation of samples and standards, and analyses cost estimated as approximately three times lower.
Respecting to voltammetric methods employing electrode of carbon paste, the proposed method presents better repeatability, due to perfect reproduction in the formation of mercury drop at every determination.
All the evaluated parameters are compatible with the recommendations established at the INMETRO docu -ment of orientation for validation, and the methodology could be utilized for quantitative and routine analyses of pharmaceutical formulations containing isoniazid and rifampicin in the associated form, in the format of both, tablets and capsules.
According to USP 31, the acceptability ranges for tenors of isoniazid and rifampicin are of, respectively, 90 to 110% and 90 to 130% of the value professed by manu -facturer. Out of the all samples analyzed, only a single lot from Pharmaceutical Company A presented a result below the range described at USP 31 for rifampicin. For isoniazid, all obtained results were satisfactory.
ACKNOWLEDGMENT
The authors thank to National Institute for Health Quality Control/FIOCRUZ by the motivation to developed researches, as well as to FAPERJ and CNPq by inancial support.
REFERENCES
ANGULO, J.M.; R, MARIN-GALVIN.; MONTOYA, M.R.; RODRIGUES-MELLADO, M. Reduction of the pyridine ring of niazid and isoniazid on mercury electrodes.
Comparison with other NAD+ model compounds. J.
Electroanal. Chem., v.348, p.303-315, 1993.
BARD, A.J.; FAULKNER, L.R. Electrochemical methods:
Fundamentals and applications. 2 ed. New York: John Wiley & Sons, 2001. p.833.
DALCOLMO, M.P.; ANDRADE, M.K.N.; PICON, P.D. Tuberculose multirresistente no Brasil: histórico e medidas
de controle. Rev. Saúde Pública, v.41, p.34-42, 2007.
FREIRE, D.N.; BONAMETTI, M.; MATSUO, T. Diagnóstico precoce e progressão da tuberculose em contatos.
Epidemiol. Serv. Saúde, v.16, p.155-163, 2007.
GHONEIM, M.M.; EL-BARADIC, K.Y., TAWFIK, A. Electrochemical behavior of the antituberculosis drug isoniazid and its square-wave adsorptive stripping voltammetric estimation in bulk form, tablets and biological luids at a mercury electrode. J. Pharm. Biomed. Anal., v.33, p.673-685, 2003.
HAMMAM, E.; BELTAGI, A.M.; GHONEIM, M.M..
Voltammetric assay of rifampicin and isoniazid drugs, separately and combined in bulk, pharmaceutical formulations and human serum at a carbon paste electrode.
Microchem. J., v.77, p.53-62, 2004.
HASWELL, S.J. Statistical evaluation of data. Practical guide
to chemometrics. New York: Marcel Dekker, 1992. p.5-38.
INMETRO. Orientação sobre Validação de Métodos de Ensaios
Químicos: DOQ – CGCRE – 008. Revisão 02. Rio de
Janeiro, jun. 2007. 24 p.
KRITSKI, A.L.; VILLA, T.S.; TRAJMAN, A.; SILVA, J.R.L.; MEDRONHO, R.A.; NETTO, A.R. Duas décadas de pesquisa em tuberculose no Brasil: estado da arte das publicações cientíicas. Rev. Saúde Pública, v.41, p.9-14, 2007.
LIANG, Y.D.; SONG, J.F.; XU, M. Electrochemiluminescence from successive electro- and chemo-oxidation of rifampicin and its application to the determination of rifampicin in
pharmaceutical preparations and human urine. Spectrochim.
Acta Part A: Mol. Biomol. Spectrosc., v.67, p.430-436,
2007.
LOMILLO, M.A.A.; RENEDO, O.D.; MARTINEZ, M.J.A. Resolution of ternary mixtures of rifampicin, isoniazid and pyrazinamide by differential pulse polarography and partial
least squares method. Anal. Chim. Acta, v.449, p.167-177,
2001.
LUND, H. Electroörganic Preparations: Polarography and reduction of isonicotinic hydrazide and related compounds.
RODRIGUES-MELLADO, J.M.; ANGULO, M.; MARIN-GALVIN, R. Electrochemical oxidation of niazid and isoniazid at mercury electrodes. Influence of the adsorption of the reaction product on the polarographic
and voltammetric curves. J. Electroanal. Chem., v.352,
p.253-265, 1993.
SECRETARIA ESTADUAL DE SAÚDE DO ESTADO DO
RIO DE JANEIRO. Plano Estratégico para o Controle
da Tuberculose no Estado do Rio de Janeiro, 2003 a 2005. Available at: < http://www.saude.rj.gov.br/tuberculose/
planos.shtml>. Accessed on: 14 aug. 2008.
SOUZA, M.V.N.; VASCONCELOS, T.R.A. Fármacos no combate à Tuberculose: Passado, presente e futuro. Quim. Nova, v.28, p.678-682, 2005.
SULAIMAN, S.T.; HAMEED, Y.O. Differential-pulse polarographic determination of isonicotinic acid hydrazide, and analogous hydrazides in admixture. Anal. Chim. Acta, v.206, p.385-390, 1988.
THE UNITED STATES PHARMACOPEIA: USP 31 NF 26.
Rockville: United States Pharmacopeia Convention, 2008. p.3000.
TONG, J.; DANG, X.; LI, H. Electrochemical oxidation of Isoniazid catalyzed by the 2,2,6,6-tetramethyl-4-acetypiperidine-1-oxy radical an its analytical application.
Electroanalysis, v.9, p.2165-168, 1997.
WAHDAN, T. Voltammetric method for the simultaneous
determination of rifampicin and isoniazid in pharmaceutical formulations. Chem. Anal., v.50, p.57-464, 2005.
WORLD HEALTH ORGANIZATION. Global tuberculosis control: surveillance, planning, financing. Available at:
<http://www.who.int/tb/publications/global_report/2007/ pdf/full.pdf>. Accessed on: 16 apr. 2007.