Taruska Ventorini VASCONCELOS Frederico Sampaio NEVES
Lívia Almeida Bueno MORAES Deborah Queiroz FREITAS
Universidade Estadual de Campinas – UNICAMP, Faculdade de Odontologia, Department of Oral Diagnosis, Piracicaba, SP, Brazil.
Vertical bone measurements from cone
beam computed tomography images
using different software packages
Abstract: This article aimed at comparing the accuracy of linear measurement tools of different commercial software packages. Eight fully edentulous dry mandibles were selected for this study. Incisor, canine, premolar, irst molar and second molar regions were selected. Cone beam computed tomography (CBCT) images were obtained with i-CAT Next Generation. Linear bone measurements were performed by one observer on the cross-sectional images using three different software packages: XoranCat®, OnDemand3D® and KDIS3D®, all able to assess DICOM images. In addition, 25% of the sample was reevaluated for the purpose of reproducibility. The mandibles were sectioned to obtain the gold standard for each region. Intraclass coeficients (ICC) were calculated to examine the agreement between the two periods of evaluation; the one-way analysis of variance performed with the post-hoc Dunnett test was used to compare each of the software-derived measurements with the gold standard. The ICC values were excellent for all software packages. The least difference between the software-derived measurements and the gold standard was obtained with the OnDemand3D and KDIS3D (-0.11 and -0.14 mm, respectively), and the greatest, with the XoranCAT (+0.25 mm). However, there was no statistical signiicant difference between the measurements obtained with the different software packages and the gold standard (p > 0.05). In conclusion, linear bone measurements were not inluenced by the software package used to reconstruct the image from CBCT DICOM data.
Keywords: Medical Informatics Applications; Cone-Beam Computed Tomography; Dental Implants; Mandible.
Introduction
Thecone beam computed tomography (CBCT) acquisition process involves computed activities in all its steps. During the rotation of the X-ray source and detector, multiple sequential planar projection images of the ield of view (FOV) are acquired and the volume is reconstructed through a complex process involving serial mathematical procedures and algorithms to turn the acquired data into a visible image.It has only been since the late 1990s that computers capable of computational complexity and X-ray tubes capable of continuous exposure have enabled clinical computer-based systems to be used in the dental ofice.1,2
Declaration of Interests: The authors certify that they have no commercial or associative interest that represents a conflict of interest in connection with the manuscript.
Corresponding Author: Taruska Ventorini Vasconcelos E-mail: [email protected]
DOI: 10.1590/1807-3107BOR-2015.vol29.0035
Submitted: Jun 18, 2014
CBCT scanners are becoming more eficient, and current software packages developed to process, manage, and analyze 3D images are also undergoing rapid growth. This requires a learning process, knowledge and the familiarity of professionals regarding the management of CBCT images. Once a CBCT scan has been acquired, some basic handling procedures and measurements in the data set can be performed with the software provided by the manufacturers.3
Ever since the development in 1993 of a standardized code of images obtained by computed tomography, called DICOM (Digital Imaging and Communications in Medicine), CBCT manufacturers have had the option of converting their proprietary formats into an exportable DICOM ile by way of their software. This strongly improved radiology communication and the DICOM pattern became so useful that many devices began acquiring images in this format.3,4 Today, the wide range of software packages able to import DICOM iles and export sections or images in other formats offers the additional beneit of using speciic measurements,5 thus increasing the number of tools for visualization, measurement, recording, superimposition and computation of 3D images.
Implant therapy has been established as a reliable rehabilitation treatment by several studies evaluating its long-term success.6,7 For preoperative planning of mandibular implant placement, bone volume and bone quality are factors of particular interest in determining the optimal location for placing dental implants and for their prognosis over time.8 The studies suggest that CBCT images provide reliable information regarding bone measurements, regardless of voxel size9,10 and exposure parameters.11,12 However, to the best of our knowledge, information about the accuracy of measurement tools of different software packages is not available. Therefore, this study aimed at comparing the accuracy of linear measurement tools of different commercial software packages, considering that this is an essential step for implant therapy success.
Methodology
This study received approval from the Research Ethics Committee of the Piracicaba Dental School,
Universidade Estadual de Campinas – UNICAMP
(Protocol #72/2011). Eight dry, fully edentulous
mandibles (totaling 16 hemimandibles), with resorbed alveolar processes, were selected for this study.
Ten regions were selected for evaluation, five on each side, according the criteria proposed by Neves et al.:12 incisor (1 cm distal from the median sagittal plane), canine (1 cm distal from the incisor region), premolar (at the level of the mental foramen), irst molar (1 cm distal from the mental foramen) and second molar region (2 cm distal from the mental foramen). Lines perpendicular to the base of the mandible in the buccal cortical were drawn in order to establish a pattern for each region evaluated. Then a radiopaque marker (gutta-percha cone) was ixed in the entire extension of these mandibles, to act as a reference for identifying the measurement sites.
The mandibles were placed in a polystyrene box illed with water prior to the CBCT examination in order to simulate soft-tissue attenuation and scattering. The size of the box was 162 mm (length) by 148 mm (width) by 106 mm (height). Two-thirds of the box was illed with water up to a level covering the alveolar process of the mandibles. This part of the methodology was already used by Neves et al.12 CBCT images were obtained with the i-CAT Next Generation® CBCT device (Imaging Sciences International, Inc., Hatield, USA), using 0.20 mm of voxel size, full-scan mode, 120 kVp, 37.07 mA and 26.9 seconds.
A previously calibrated oral radiologist with CBCT experience assessed the cross-sectional images under dim light, using three different software packages: the XoranCat® (version 3.1.62, Xoran Technologies, Ann Arbor, USA) used regularly to work with i-CAT images; OnDemand3D® (version 1.0, CyberMed Inc., Seoul, South Korea); and KDIS3D® (version 2.1.11, Kodak Dental Systems, Carestream Health, Rochester, USA); all are able to assess DICOM images. The observer was allowed to use the “zoom” tool and to change the brightness and contrast of the images; however, the enhancement ilters were not applied. The image analyses were conducted on a 24.1 inch LCD monitor (MDRC-2124, Barco N.V., Courtray, Belgium) with a resolution of 1920 x 1200 pixels.
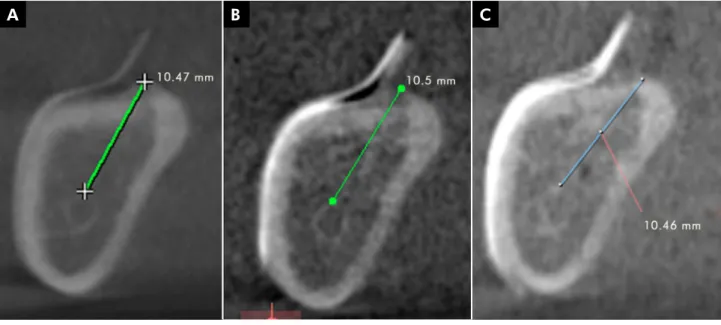
gutta-percha appeared in the entire extension of the buccal cortical. The linear measurement tool of each software package was used to obtain the bone height in each of these images, from the lowest point of the base of the mandible to the highest point of the alveolar crest. In order to determine the lowest and highest points, two horizontal lines were drawn tangent to the bone in the base of the mandible and to the bone crest, respectively. The irst point touching this line was considered the reference for the measurement. The following distances were measured: from the superior cortical of the mental foramen to the highest point of the alveolar bone crest in the premolar region, and from the superior cortical of the mandibular canal to the highest point of the alveolar bone crest in the irst and second molar regions (Figure 1). Twenty-ive percent of the sample was re-evaluated to obtain the reproducibility.
After acquiring the data, the mandibles were sectioned using an electrical saw (SFO 2.55- STB, São Paulo, Brazil), in all the regions evaluated, and transversal slices of each region were obtained. The slices were performed directly before the gutta-percha cone, soas not to lose the bone tissue in the site related to the tomographic image. In the dry segments of the mandibles, the vertical measurements were obtained for each site with a digital caliper (SC-6 digital caliper; Mitutoyo Corporation, Tokyo,
Japan), using marks previously drawn with ink on the measurement sites corresponding to the CBCT slices. The direct measurements in each region of the mandible were performed three times by another evaluator, and the gold standard means were determined.
The data were analyzed using SPSS version 18.0 (Statistical Package for the Social Sciences, Chicago, USA). The intraclass correlation (ICC) was calculated for the intraobserver agreement. The one-way analysis of variance (ANOVA) test with post-hoc Dunnett was used to compare each of the software-derived measurements with the gold standard. The signiicance level was set at 5%.
Results
According to Weir,13 the ICC values showed that the intraobserver reproducibility was excellent, i.e., 0.98 for XoranCat®, 0.99 for KDIS3D® and 0.98 for OnDemand3D®.
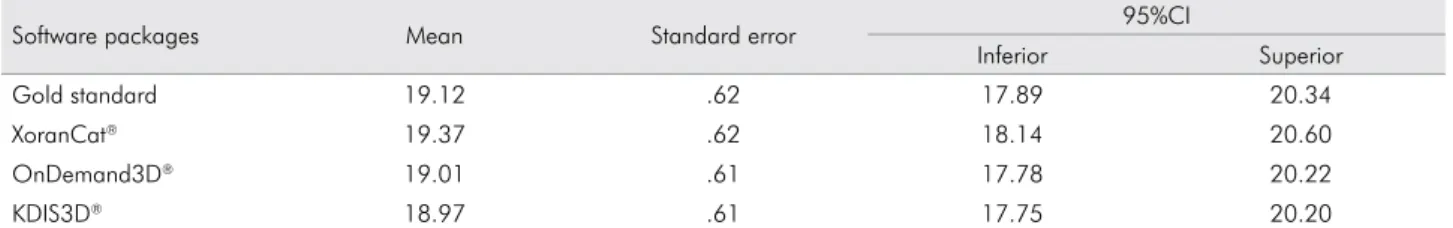
The means (average of all bone heights plus the distances between the mental foramen/mandibular canal and the alveolar bone crest), standard errors and conidence intervals obtained using the software packages are presented in Table 1.
The least difference between the software-derived measu rements a nd t he gold sta nda rd were obtained with OnDemand3D® and KDIS3D®
Figure 1. Distance from the superior cortical of the mandibular canal to the highest point of the alveolar bone crest: (A) XoranCat®;
(B) KDIS3D®; and (C) OnDemand3D®.
(-0.11 and -0.14 mm, respectively), and the greatest, with XoranCAT® (+0.25 mm). However, no statistical significant differences were observed between the measurements obtained with the different software packages and the gold standard (p > 0.05). The mean difference between the measurements of the images and those of the gold standard, as a p-value, are shown in Table 2. Table 3 presents the ANOVA results.
Discussion
In the present study, only one experienced radiologist was used to evaluate the images, and the intraobserver reproducibility was considered excellent in all three software packages. According to Mutch et al.,14 the single-observer method h a s some adva nt ages, such a s: obser vat ion consistency, better discrimination among groups and elimination of interobserver mistakes often found in multi-observer trials.
When the DICOM file format was introduced, the image analysis process crossed the laboratory barrier, allowing CBCT acquisitions ordered from an
imaging laboratory to be communicated to a greater number of interested parties. After the radiologist’s evaluation, each examination could be given to the respective patient or responsible clinician, recorded in a DICOM ile. This format enabled other professionals to analyze the image as well, thus improving radiology communication.3 For this reason, clinicians could now work with any software application that allowed open images in DICOM ile format. This process highlights two important steps: the converting of images to DICOM file format and the number of different software applications able to work with DICOM images. According to Grauer et al.,3 further research is needed to validate the process of converting images from a proprietary format to a DICOM ile format.
Software packages for dental applications capable of DICOM display can be categorized as proprietary or third-party commercial software. Speciic viewers are provided by the manufacturers of CBCT equipment, and act as both acquisition and viewing software. Most proprietary software is also capable of converting proprietary data formats to an exportable DICOM file. Commercial third-party DICOM viewers may not be directly associated with a speciic hardware.3 Therefore, this study analyzed two kinds of image iles and programs: the .XSTD format produced by the i-CAT® device and analyzed by XoranCat® software,used only to work with i-CAT images, and the DICOM-based data sets converted from the i-CAT image after acquisition, analyzed by OnDemand3D® and KDIS3D® software, both able to open DICOM images. Both XoranCat® and Table 1. Measurements (in mm) of the gold standard and using the three software packages.
Software packages Mean Standard error 95%CI
Inferior Superior
Gold standard 19.12 .62 17.89 20.34
XoranCat® 19.37 .62 18.14 20.60
OnDemand3D® 19.01 .61 17.78 20.22
KDIS3D® 18.97 .61 17.75 20.20
Table 3. ANOVA-based study results.
Degrees of freedom Sum of squares Mean squares F ratio
Among groups 3 10.924 3.641 .084
Within groups 448 19348.013 43.188
Table 2. Differences between the measurements (in mm) of the gold standard and those obtained by the three software packages.
Software packages Mean difference from gold standard p-value
XoranCat® .25 .998
OnDemand3D® -.11 .984
OnDemand3D® must be purchased, whereas KDIS3D® is available for free on the manufacture’s website.
The results of the present study did not show any differences between the measurements performed with these different types of image software packages and those of the gold standard. This indicates that the conversion process is reliable and does not inluence the diagnostic task. This corroborates other studies, in which bone measurements were reliable and accurate using the XoranCAT®,9,10,15 OnDemand3D®12,16,17 and KDIS3D®.18 Moreover, Melo et al.19 did not ind any statistical differences among four software packages (XoranCAT®, Dolphin®, KDIS3D® and InVivo®) in the diagnosis of vertical root fractures. Although no statistical differences were found, the measurements obtained with OnDemand3D® and KDIS3D® were closer to the gold standard than those obtained with XoranCAT®. Moreover, it is interesting to observe that two software packages underestimated the measurements, whereas one overestimated them.
Even though the same image format is used (e.g.
DICOM-based data set), the number of software packages able to manage the images generated by this format has been increasing steadily. The implication is that there are many possibilities for treating and analyzing images that can influence the final image, i.e., the secondary reconstruction process, the gray scale value, the windowing/contrast control, plane definition, slice thickness and number of slices measured.1,20 Nevertheless, a major problem is that the selection of parameters related to image generation and manipulation in CBCT imaging, as well as the selection of software packages, seems to be performed almost arbitrarily.21
In the present study, we obtained the images from the i-CAT Next Generation, using a 0.2 mm voxel size.
This CBCT unit offers other options of voxel sizes (0.12, 0.25, 0.30 and 0.40 mm). However, Torres et al.9 and Waltrick et al.10 found that the voxel size of the i-CAT does not have any inluence on preoperative implant bone measurements.
The visualization of the mandibular canal is fundamental to obtaining accurate bone measurements in the posterior region of the mandible. The best radiographic technique should allow measurements of the mandibular canal in relation to the alveolar crest, within limits of 1 mm, as well as the evaluation of the width and inclination of the alveolar process.22 Moreover, a safety margin between 1 and 2 mm is suggested when the implant is to be placed close to the mandibular canal. In the present study, it was possible to observe that the difference between the gold standard means and the measurements obtained with all of the software packages was less than 1 mm. Therefore, all software packages used in the present study can be considered clinically useful in the preoperative evaluation of dental implant placement.
The use of dry mandibles without soft tissues could be considered a limitation, as in any in vitro
study. However, the study used water as a soft tissue simulation, because water is considered a soft tissue equivalent material in studies with phantoms.23 Nonetheless, further studies with cadavers and other software packages are necessarily.
Conclusion
Linear bone measurements may be performed with high accuracy by any of the software packages used in the present study, insofar as they were not inluenced by the software package used to reconstruct the image from CBCT DICOM data.
1. Scarfe WC, Farman AG. What is cone-beam CT and how does it work?. Dent Clin North Am. 2008 Oct;52(4):707-30. 2. Schulze R, Heil U, Gross D, Bruellmann DD, Dranischnikow
E, Schwanecke U, et al. Artefacts in CBCT: a review. Dento-maxillofac Radiol. 2011 Jul;40(5):265-73.
3. Grauer D, Cevidanes LS, Proffit WR. Working with DICOM craniofacial images. Am J Orthod Dentofacial Orthop. 2009 Sep;136(3):460-70.
4. Digital Imaging and Communications in Medicine
[Inter-net]. Rosslyn (VA): National Electrical Manufacturers As -sociation (NEMA); 2008 [cited 2015 Jan 6]. Available from:
http://medical.nema.org/dicom/2004/04_01PU.PDF.
5. De Vos W, Casselman J, Swennen GR. Cone-beam computer -ized tomography (CBCT) imaging of the oral and maxillo-facial region: a systematic review of the literature. Int J Oral Maxillofac Surg. 2009 Jun;38(6):609-25.
6. Leonhardt A, Gröndahl K, Bergström C, Lekholm U. Long-term follow-up of osseointegrated titanium implants using clinical, radiographic and microbiological parameters. Clin Oral Implants Res. 2002 Apr;13(2):127-32.
7. Vere J, Joshi R. Quality assessment of prospective case series of dental implant surgery and prosthodontics published be-tween 2004 and 2008: a systematic review. Int J Oral Maxil-lofac Implants. 2012 Jul-Aug;27(4):865-74.
8. Esposito M, Hirsch JM, Lekholm U, Thomsen P. Biological factors contributing to failures of osseointegrated oral im-plants. (I). Success criteria and epidemiology. Eur J Oral Sci.
1998 Feb;106(1):527-51.
9. Torres MG, Campos PS, Segundo NP, Navarro M, Crusoé-Rebello I. Accuracy of linear measurements in cone beam computed tomography with different voxel sizes. Implant Dent. 2012 Apr;21(2):150-5.
10. Waltrick KB, Abreu Junior MJN, Corrêa M, Zastrow MD,
Dutra VD. Accuracy of linear measurements and visibility
of the mandibular canal of cone-beam computed tomogra-phy images with different voxel sizes: an in vitro study. J Periodontol. 2013 Jan;84(1):68-77.
11. Panmekiate S, Apinhasmit W, Petersson A. Effect of electric potential and current on mandibular linear measurements in cone beam CT. Dentomaxillofac Radiol. 2012 Oct;41(7):578-82. 12. Neves FS, Vasconcelos TV, Campos PS, Haiter-Neto F, Freitas
DQ. Influence of scan mode (180°/360°) of the cone beam
computed tomography for preoperative dental implant
mea-surements. Clin Oral Implants Res. 2014 Feb;25(2):e155-8.
13. Weir JP. Quantifying test-retest reliability using the intraclass correlation coefficient and the SEM. J Strength Cond Res.
2005 Feb;19(1):231-40.
14. Mutch LMM, Johnson MA, Morley R. Follow up studies: design, organization, and analysis. Arch Dis Child. 1989 Oct;64(10 Spec No):1394-402.
15. Timock AM, Cook V, McDonald T, Leo MC, Crowe J, Ben -ninger BL, et al. Accuracy and reliability of buccal bone height and thickness measurements from cone-beam com-puted tomography imaging. Am J Orthod Dentofacial Or-thop. 2011 Nov;140(5):734-44.
16. Park CS, Park JK, Kim H, Han SS, Jeong HG, Park H. Compari-son of conventional lateral cephalograms with corresponding CBCT radiographs. Imaging Sci Dent. 2012 Dec;42(4):201-5. 17. Kim M, Huh KH, Yi WJ, Heo MS, Lee SS, Choi SC. Evaluation
of accuracy of 3D reconstruction images using multi-detector CT and cone-beam CT. Imaging Sci Dent. 2012 Mar;42(1):25-33. 18. Maret D, Molinier F, Braga J, Peters OA, Telmon N, Treil J,
et al. Accuracy of 3D reconstructions based on cone beam computed tomography. J Dent Res. 2010 Dec;89(12):1465-9. 19. Melo SL, Haiter-Neto F, Correa LR, Scarfe WC, Farman
AG. Comparative diagnostic yield of cone beam CT re-construction using various software programs on the de-tection of vertical root fractures. Dentomaxillofac Radiol. 2013;42(9):20120459.
20. Spin-Neto R, Marcantonio Junior E, Gotfredsen E, Wenzel A. Exploring CBCT-based DICOM files. A systematic review on the properties of images used to evaluate maxillofacial bone grafts. J Digit Imaging. 2011 Dec;24(6):959-66.
21. Chadwick JW, Lam EW. The effects of slice thickness and interslice interval on reconstructed cone beam computed tomographic images. Oral Surg Oral Med Oral Pathol Oral Radiol Endod. 2010 Oct;110(4):e37-42.
22. Klinge B, Petersson A, Maly P. Location of the mandibular canal: comparison of macroscopic findings, conventional radiography, and computed tomography. Int J Oral Maxil-lofac Implants. 1989 Winter;4(4):327-32.