Aspects of Sports Injuries in Athletes with
Visual Impairment
Marília Passos Magno e Silva1 Edison Duarte1
Anselmo de Athayde Costa e Silva1 Hésojy Gley Pereira Vital da Silva2 Roberto Vital3
1. Physical Education College of the State University of Campinas – Campinas, SP.
2. Medical Sciences College of the State University of Campinas– Campinas, SP.
3. Medicine College of the Federal University of Rio Grande do Norte – Natal, RN.
Mailing address:
Laboratório de Atividade Motora Adaptada - Faculdade de Educação Física - Universidade Estadual de Campinas - Avenida Érico Veríssimo, 701 - Cidade Universitária zeferino Vaz – Barão Geraldo –13083-851 Campinas, SP, Brazil Caixa Postal 6.134.
E-mail: [email protected]
ABSTRACT
Most research on sport injuries in disabled athletes uses a cross-disability (physical and sensorial) design and merges different sport modalities in the same study. This procedure creates difficulties in interpreting the results, since different disabilities and modalities may cause different injury conditions. The purpose of this study was to analyze the sports injuries frequency in visually impaired athletes, to identify the site of the injury, its mechanism, and the main injuries that occur to these athletes as well as to verify if the visual class relates to the sports injury frequency. The subjects were male and female visually impaired athletes, members of the Brazilian team of athletics, soccer 5, goalball, judo, and swimming, who played in international competitions between 2004 and 2008. Data was collected using the Brazilian Paralympic Committee and the Brazilian Confederation of Sports for the Blind medical form, which included the following information: name, age, modality, competition, visual classification (B1, B2, B3), injury type, location of injury, and diagnosis. A total of 131 athletes participated in this study: 42 female, 89 male amongst which 61 were B1, 46 B2, and 24 B3. From this total, 102 athletes reported 288 sports injuries; 2.82 injuries per athlete. Female athletes presented more injuries than male athletes; however, this difference did not show statistical significance. Regarding visual classification, B1 athletes got more injuries than B2 athletes, and these more than B3 athletes; statistically significant difference was found only between B1 and B3 group. As one group, athletes presented similar values between accident and overuse injuries. Concerning body segment, lower limbs showed more injuries, followed by upper limbs, spine, head, and trunk. Twenty-one diagnoses were reported, being tendinopathies, contractures, and contusions the most frequent.
Keywords: visually impaired subjects, disabled, athletic injuries.
INTRODUCTION
In Brazil, Paralympic sports have increased over the last years, especially after the Paralympic Games of Athens, in 2004. The media promotion made a wider number of individuals with disabilities search for sports as a resource of recreational or competitive physical activity. Thus, the increase in the number of athletes with disabilities who practice physical activities also generated increase in the number of sports injuries derived from its practice.
Epidemiological studies about injuries in athletes with disabilities are important to inform the athletes and coaches about the injury risks of the sport, provide information to the health staff, guarantee suitable help and give grounding for the performance of prevention work which reduces the incidence of sports injuries in this population(1).
Some studies in the field of sports injuries in athletes with disabilities have been published(2-4); however, the majority
presents methodology which joins data of different disabilities and sports modalities, making the sample heterogeneous and unspecific(5).
The specification of these data, according to the group of athletes with disability and modality practiced, may inform on the sports injuries which occur in a modality or a group of athletes with disability, aiding in the application of specific preventive
strategies. Thus, this research presents the sports injuries which occur only with visual impairment.
In order to compete, the athlete with visual impairment goes through a visual classification process composed of three categories: B1 – total blind (may have light perception, but are not able to recognize the shape of a hand at any distance in any direction); B2 – visual impaired (recognize the shape of a hand, their visual perception does not surpass 2/60 and their vision spectrum reaches an angle narrower than five degrees); and B3 – visual impaired with better eye sight (visual perception is situated between 2/60 meters and 6/60 meters and their visual spectrum reaches an angle between five and 20 degrees)(6).
This study had as main aim to analyze the frequency of the sports injuries in athletes with visual impairment, besides identifying the body areas mostly injured, the mechanism of the sports injuries, the main sports injuries which occur to athletes with visual impairment and verifying whether the level of visual impairment presents relation with the incidence of sports injuries.
METHODS
The research project was submitted to evaluation by the Ethics and Research Committee of Unicamp, under the protocol number 340/2007 and was approved on June, 2007.
ORIGINAL ARTICLE
320 SUBJECTS
Elite athletes of both sexes with visual disability and chosen to represent the Brazilian team in international competitions between the years of 2004 and 2008 participated in this research. Their modalities were: track and field, soccer 5, goalball, judo and swimming. Athletes with injuries occurred during the sports practice and the athletes whose data were incomplete on the evaluation sheet were excluded from the study. Recurrent injuries were counted only once, even if have occurred in subsequent competitions.
All athletes received visual classification according to the international guidelines, proposed by the IBSA (B1, B2 and B3), performed by the representing doctors in the federation (IBSA) in the sports events held.
The athletes were informed on the benefits and risks of their participation as volunteers in the study, according to the criteria proposed for research with humans, as exemplified in the consent form model. The referred organizing institutions of the spots events were informed and authorized this study.
Research site
The research was based on the data collection of international competitions from 2004 to 2008, namely: Paralympic Games of 2004, Athens (GRE); Pan-American Games IBSA 2005, held in São Paulo (SP); World Games IBSA 2007, held in São Paulo (SP); Pan-American Games 2007, Rio de Janeiro (RJ); Paralympic Games of 2008, held in Beijing (CHI).
Instrument description
The data were collected from a model used by the medical team of the Brazilian Paralympic Committee and the Brazilian Sports Confederation for the Blind, composed of the following information: name, modality, age, visual classification (B1, B2, B3), injury site and injury diagnosis.
Terms definition
In the present study, sports injury was defined as any injury which has occurred with the athlete during practice, training or competition which causes interruption, limitation or alteration in his/her participation for one or more days(7).
In order to standardize the injury sites, the researcher considered five body segments, with their specific regions: Head: head, face and neck.
Upper limb: scapular waist, shoulder, arm, elbow, forearm, wrist, hand and fingers.
Lower limb: pelvic waist, pubis, hip, gluteus, thigh, knee, leg, ankle, foot and toes.
Back: cervical, thoracic and low. Trunk: thorax and abdomen.
Concerning the injury mechanism, the terms ‘overload injury’ and ‘accident injury’ have been used and they have the following definition(8):
Overload injury is characterized by repetition microtrauma, resulting from repetition physical loads dosing with inadequate recovery of the musculoskeletal system.
Injury by sports accident occurs in a single and acute way, resulting in an impact or macrotrauma.
STATISTICAL ANALYSIS
The data collected were transformed in numbers and recorded in the Microsoft Excel 2007 program®
. Descriptive statistics was used to calculate the total and relative frequency of the data collected. Data normality was evaluated through the Shapiro-Wilk test. The results comparison concerning sex and visual classification was done through the Student’s t test
for sex and mechanism. Visual classification used the one-way ANOVA test. Whenever data were not normal, the non-parametric equivalents of Mann-Whitney (for the t test) and
Kruskal-Wallis (for ANOVA) were used. The soccer 5 modality data were not part of the comparisons since it presented only male athletes and with class B1. The analyses were done through the SPSS 14.0® statistical program for Windows®.
Multiple comparison of the Kruskal-Wallis test used the DUNN test through the Bioestat 5.0®.
RESULTS
131 athletes participated in this study, out of which, 102 presented some sports injury. Tables 1, 2, 3, 4 and 5 and figures 1, 2, 3 and 4 present the numbers of participating and injured athletes by sex and visual class.
DISCUSSION
Out of 315 recorded injuries in the study, 27 (8.57%) were recurrent injuries. The absence of pain may be related to the decision to early return of the athlete to training after an injury, not considering the disadaptation process caused by the prolonged time away from sport(9), and which can cause reoccurrence or
severity to the injury. Therefore, in the present study, the recurrent injuries were counted only once.
It is very common in the professional sports scenario, either Olympic or Paralympic, the pressure on the athlete to return to the sports practice after an injury. However, the health team should be very confident when releasing the athlete, based on this/her clinical evolution, time of tissue healing, rehabilitation process as well as athlete’s report.
There was reduction in the percentage of athletes injured during a Paralympic cycle (Paralympic Games of 2004 and 2008),
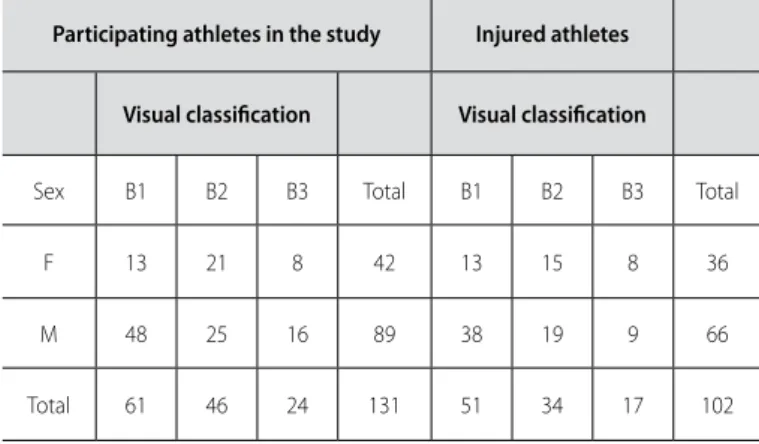
Table 1. Number of participants and injured athletes according to visual classifi-cation and sex.
Participating athletes in the study Injured athletes
Visual classiication Visual classiication
Sex B1 B2 B3 Total B1 B2 B3 Total
F 13 21 8 42 13 15 8 36
M 48 25 16 89 38 19 9 66
Figure 1. Mechanism of the sports injury.
Figure 2. Injuries by body segment.
Mechanism of the SportsInjury
Table 5. Percentage of injured athletes and mean of injuries by athlete.
Competition Participating athletes
Injured athletes
% injured athletes
Number of injries
Injuries by athlete
1 35 30 85.71 47 1.57
2 92 46 50 62 1.35
3 83 54 65.06 95 1.76
4 61 29 47.54 39 1.34
5 53 29 54.72 45 1.55
General 131 102 77.86 288 2.82
1. Paralympic Games, 2004; 2. Pan-American IBSA,2005; 3. World IBSA,2007; 4. Pan-American 2007; 5. Paralympic Games,2008.
Table 2. Number of injury per visual class, sex and injury mechanism.
Sex Visual class
Mechanism F M Total B1 B2 B3 Total
Accident 40 96 136 71 43 22 136
Overload 58 94 152 66 59 27 152
General 98 190 288 137 102 49 288
Table 3. List of the visual classiication and sex.
Visual classiication Sex
B1 B2 B3 F M
M 5* 4.25 2.12 9 13.5
SD ±2.26 ±1.66 ±1.72 ±2.16 ±4.64
Mean of injuries by visual class and sex. Adopted statistical signiicance level p ≤ 0.05. *B1 > B3. P = 0.018.
Table 4. Comparison of the injury mechanism by visual class.
Visual class
Mechanism B1 B2 B3
Accident SDM 2.2632±2.4 ±2.62132.2632 ±1.61861.2105
Overload M
SD
3.1053* ±2.1054
3.1053** ±2.4921
1.3684 ±1.5352
Mean of injuries by visual class and mechanism. Adopted statistical signiicance level p ≤ 0.05. *B1 > B3. **B2 > B3.
despite the increase in the number of participants (Table 5). This decrease is related to the investment in the athletes and health team (doctors, physiotherapists, nurses, psychologists), who followed the training and competition periods, promoting not only the injury treatment, but also prevention guidance.
Injuries by Body Segment
LL
UL
BACK
HEAD
TRUNK
57.99%
21.53%
17.36%
2.43%
0.69%
ACCIDENT OVERLOAD
47.22%
52.78%
Figure 3. Injuries by body region.
Injury by Body Region
0.69% 0.69% 1.04%
1.39% 1.39% 1.74% 1.74% 1.74% 1.74% 1.74% 2,43%
2.78% 3.47%
5.21% 7.29%
7.99% 8.33%
9.03% 11.11%
12.85% 15.63%
322
Generally speaking, in the five assessed competitions, out of the 131 participant athletes, 102 (77.86%) presented sports injuries, with a total of 288 injuries (Table 5). The risk of injury in athletes with visual disability is higher, since a high number of injuries per competitor was found when compared to athletes with other disabilities(7). Nevertheless, this reference value was not specified
so that a comparison could be made with the found data. The highest incidence of sports injuries in athletes with visual disability occurred in the lower limbs (57.99%), followed by upper limbs, back, head and trunk (Figure 2). These data were found in other references(3,7,10,11).
This result may be explained by the reason that the proprioception in blind individuals tends to be worse than in those with partial vision, affecting mainly the lower limbs and resulting in abnormal gait and biomechanics(4).
A great variety of body regions was affected (Figure 3), and structures such as biarticular muscles (in the thigh region), more unstable articulations with higher freedom level (shoulder and knee) are also the ones with higher injury frequency. The sports modality can also be a determinant factor of the injured body regions since each sport presents specific tactics and technique.
The main diagnosis found were tendinopathies, sprains and contusions. The muscle and tendon injuries are the most frequent in athletes in the Paralympic environment(12). The
contusions may be related to the visual impairment, which make the athletes more vulnerable to bump into other players, barriers in the training and competition area or hurdles or other objects on the field(13,14).
Regarding the severity of injuries, we found that the majority of injuries were light, with time away from zero to seven days; moderate and severe injuries were less frequent. These results were also found in a previous study(15).
Concerning the injury mechanisms, a close value has occurred
between accident and overload injuries (Table 2) being the latter more frequent. Overload injury is defined as chronic damage to the tissue, as a result from countless microtrauma which hamper the recovery capacity of the tissue(16).
The lower the visual classification of the athlete, the higher his/her chance to suffer a sports injury (Table 1). However, the statistical analysis (Table3) revealed significant difference only between classes B1 and B3 (p = 0.018). When the injury mechanisms were compared by visual class, significant difference was found only in the overload injuries, in which the B1 athletes injured more than the B3 athletes and the B2 athletes more than the B3 athletes (Table 4).
The capacity of aerobic work of individuals with visual disability is reduced when compared to individuals with no visual compromising(17,18). Therefore, athletes with visual impairment
spend more energy to perform the same activity and are more prone to rapidly fatigue(19) and be subjects to overload injuries.
Additionally, the B3 athletes are able to perform a previous observation of the training or competition environment (which is not possible for the B1 athletes), making them more susceptible to suffer injuries by sports accident.
Female athletes (83.33%) suffered more injuries than male athletes (75.28%) (Table 2); however, this difference was not significant (Table 3). The alterations of the menstrual cycle and the use of contraceptives have been related as triggering factors of sports injuries in female athletes with no disabilities(20). Further
studies could verify whether there is this correlation in the Paralympic sport as well. The fact that male athletes with visual impairment present better performance than female ones may be another determinant factor, since lower performance of this group may influence on the onset of sports injuries.
A study on the injury pattern of female and male athletes, aged 18-22 years, with no disability, in seven modalities, revealed there is not significant difference of the injury pattern between sexes(21).
Female athletes suffer more overload injuries; while male athletes by sports accident injuries (Table 4). Nevertheless, no significant difference has been found for these values. Anatomical, physiological and psychological aspects are related to the higher frequency of overload injuries in female athletes(22). The same
factors may be present in athletes with visual impairment. It was concluded in this study that the athletes with visual disability are also prone to suffer sports injuries The lower limbs of these athletes were the most frequent, namely the thigh, knee and shoulder as the regions most affected. Concerning the diagnostics, tendinopathy, contracture and contusion were the most frequent. The athletes’ sex was not a determinant factor to sports injuries onset. Regarding the level of visual impairment, athletes with lower visual capacity (B1) are more vulnerable to injury in comparison to athletes with better visual capacity (B3). The overload injuries mainly occur to athletes with visual class B1.
We hope that the found results are able to inform the ones involved in the Paralympic sports on the injury risks; to inform the health team in order to guarantee suitable help to the athletes as well as to give support to prevention work with the aim to reduce the incidence of sports injuries in this population.
All authors have declared there is not any potential conflict of interests concerning this article.
Figure 4. Diagnostics of the sports injuries. Diagnostics of Injuries
skin boil cervicalgia sciatica fasciitis avulsion fracture labral injury meniscal injury bursitis stress fracture dorsalogia dislocation TFCC pubitis periostitis excoriation low back pain strain sprain contusion contracture tendinopathy
0.35% 0.35% 0.35% 0.35% 0.35% 0.35% 0.35% 0.35% 1.04% 1.04% 1.74%
2.43% 2.43% 2.43%
5.51% 6.25%
7.99% 9.38%
16.67% 18.75%
REFERENCES
1. Hamer P. Disability Sport. In: Caine C, Lindner K, Caine D. Epidemiology of Sports Injuries. Illinois: Human Kinetics, 1996.
2. Ferrara MS, Palutsis GR, Snouse S, Davis RW. A Longitudinal Study of Injuries to Athletes with Disabilities. Int J Sports Med 2000;21:221-4.
3. Nyland J, Snouse SL, Anderson M, Kelly T, Sterling JC. Soft Tissue Injuries to USA Paralym-pians at the 1996 Summer Games. Arch Phys Med Rehabil 2000;81:368-73.
4. Klenck C, Gebke K. Practical Management: common medical problems in disabled athletes. Clin J Sport Med 2007;17:55-60.
5. Ferrara M, Peterson C. Injuries to Athletes with Disabilities: identifying injury patterns. Sports Med 2000;30:137-43.
6. IBSA Medical Procedures. Disponível em: ttp://www.ibsa.es/docinteres/procedimien-tosdedepartamentomedico/ibsamedicalproceduresrevised.pdf. Acesso em: 25 de out. 2009.
7. Ferrara MS, Buckley WE, McCann BC, Limbird TJ, Powell JW, Robl R. The Injury Experience of The Competitive Athlete With a Disability. Med Sci Sports Exerc 1992;24:184-8. 8. Sandoval A. Medicina do Esporte: princípios e prática. Porto Alegre: ArtMed, 2005. 9. Platonov V. O Traumatismo no Desporto. In: Tratado Geral de Treinamento Desportivo.
São Paulo: Phorte, 2008.
10. Davis R, Ferrara M. Sports Medicine and Athlete with Disabilities. In: Depauw K, Gravon S. Disability and Sport Injuries. Illinois: Human Kinetics, 1995.
11. Depauw K. Sport for Individuals with Disabilities: research opportunities. Adapt Phys Activ Q 1988;5:80-9.
12. Vital R, Silva HGP, Sousa RPA, Nascimento RB, Rocha EA, Miranda HF, Maria Irany Knackfuss MI, Filho JF4. Lesões Traumato-Ortopédicas nos Atletas Paraolímpicos. Rev Bras Med Esporte 2007;13:165-8.
13. Ferrara M, Davis R. Disability Sports and Medical professionals. Athletic Therapy Today, Champaign, p. 7-9, jan. 1997.
14. Makris VI, Yee RD, Langefeld CD, Chappell AS, Slemenda CW. Visual Loss and Performance in Blind Athletes. Med Sci Sports Exerc 1993;25:265-9.
15. Ferrara M, Buckley W. Athletes with Disabilities Injury Registry. Adapt Phys Activ Q 1996;13:50-60. 16. Pecina M, Bojanic I. Overuse Injuries of The Musculoskeletal System. 2nd ed. Florida: CRC
Press, 2004.
17. Çolak T, Bamaç B, Aydin M,, Meriç B, Özbek A. Physical fitness levels of blind and visually impaired goalball team players. Isokinet Exerc Sci. 2004; 12:247-252.
18. Longmuir, P. E.; BAR-OR, O. Factors Influencing the Physical Activity Levels of Youths with Physical and Sensory Disabilities. Adapt Phys Activ Q. 2000;17:40-53.
19. Ferrara, M.; BUCKLEY, W.;PETERSON, C. Epidemiology of Sport related Injuries for Athletes with Disability. Athletic Therapy Today, Champaign, p.30-33, jan.1997.
20. ZALUAK, B. et al. The Effects of the Menstrual Cycle on Anterior Knee Laxity. Sports Med. 2006; 36 (10): 847-862.
21. Sallis, R. et al. Comparing Sports Injuries in Men and Women. Int J Sports Med. 2001; 22; 420-423.