The use of capture-recapture methods to
monitor diabetes in Dominica, West Indies
Eugene S. Tull,
1Cleve Butler,
2Leyale Gumbs,
1and
Sherida Williams
1The aim of this project was to evaluate the utility of capture-recapture (CR) estimation methodology, together with easily accessible sources of information, for monitoring the fre-quency of diabetes mellitus in a developing country. On the Caribbean island of Dominica, from July 1995 through July 1996, the names were collected of all individuals who were listed in at least one of three sources as having been diagnosed with diabetes during 1995. The sources were the membership list of the Dominica Diabetic Association, a register of patients in seven regional health centers, and clinic records of the Princess Margaret Hospital, which is the main hospital on the island. Capture-recapture techniques were used to estimate the number of Dominicans with diagnosed diabetes who were missed by all three sources of infor-mation and to evaluate dependencies among the sources. An ascertainment-corrected preva-lence estimate of diagnosed diabetes was then calculated. The three sources identified a total of 1 945 different individuals. When this number was compared with the ascertainment-corrected estimate obtained with CR methodology (2 688), it appeared to represent only 72.3% of the true prevalence of diagnosed diabetes. Most of the under-ascertainment by the data sources was due to cases that were missed in the urban area of the island. This approach to dis-ease monitoring may be useful for other Caribbean countries. However, standardized proce-dures for collecting and reporting prevalence and morbidity data are needed to maximize its accuracy and cost-effectiveness.
ABSTRACT
The global trend toward increasing rates of diabetes mellitus has raised concerns about the consequences and cost of associated morbidity and mor-tality in developing countries (1, 2). In-formation about diabetes frequency is crucial for the effective allocation of limited resources to deliver needed ser-vices to diabetic individuals. In many
countries throughout the world, how-ever, data about diabetes prevalence are lacking at the regional and national levels. The countries of the Caribbean are noteworthy in this context. Sus-tained economic development com-bined with high genetic susceptibility for Type 2 diabetes suggests that cur-rent rates of the disease will continue to increase (3). Yet in most countries of the region, little is known about the popu-lation frequency of diabetes mellitus, and reliable systems for monitoring the disease have not been developed.
Capture-recapture (CR) methods, traditionally used in demography to adjust population estimates to reflect the level of census undercount, may be
useful for establishing disease moni-toring systems in the Caribbean (4). The basic assumption of CR is that the sources of ascertainment are indepen-dent. This assumption is difficult to achieve when working with human diseases. However, when three or more sources are employed to identify cases, log linear modeling techniques can be used to estimate the depen-dency among sources and the number of cases that are not counted. By adjusting for the undercount and source dependencies, a more accurate estimate of the total number of cases in the population can be determined with corresponding 95% confidence intervals (95%CI).
1 University of Pittsburgh, Graduate School of
Pub-lic Health, Pittsburgh, Pennsylvania, USA. All cor-respondence and reprint requests should be sent to Eugene Tull at the following address: Virgin Islands Center for Chronic Disease Research, P.O. Box 3414, Christiansted, St. Croix Virgin Islands, 00820. Telephone: 809-778-8400; fax: 809-778-8407.
2 Dominica Diabetic Association, Roseau Health
Some epidemiologists have pro-moted the use of CR methods to mon-itor chronic illnesses such as diabetes (5, 6). Such monitoring would utilize existing national and local sources of information to provide raw data on diabetes frequency, and then apply CR to these data to adjust for the number of cases missed by the sources of ascer-tainment. The resulting ascertainment-corrected estimates would provide ministries of health with reliable bases for strategic planning (7). Moreover, additional information about the treat-ment and complications status of dia-betic subjects could be collected to monitor the quality of care delivered to patients. To evaluate the potential for utilizing CR methods in determin-ing the frequency of diagnosed dia-betes in a developing Caribbean coun-try, we implemented a system on the island of Dominica.
MATERIALS AND METHODS
The first step in CR estimation of the overall prevalence of diagnosed dia-betes on Dominica was to collect data on all individuals who were listed as having diabetes during the period Jan-uary 1, 1995 to December 31, 1995. Three sources were used to identify diabetic individuals: the membership list of the Dominica Diabetic Associa-tion (DDA); the combined case lists of the seven government-run regional health clinics; and the patient list from the diabetes clinic of the Princess Mar-garet Hospital, the main hospital on the island. With very active affiliate DDA chapters located throughout the island, the DDA maintains a member-ship that is geographically representa-tive of the entire island population. The regional clinics are distributed geographically so as to provide the entire population with equal access to health care services. The Princess Mar-garet Hospital clinic serves individu-als from throughout the island who have diabetes complications or comor-bid conditions—such as hypertension and dyslipidemia—that put them at higher risk for mortality.
At the regional health clinics and the Princess Margaret Hospital, public health nurses responsible for the care of diabetic patients confirmed that their cases met WHO criteria (8) for the diagnosis of diabetes. To assess the diagnostic validity of the cases on the DDA list, we randomly selected a 10% sample and checked their 1995 medica-tion status and blood sugar values. The use of insulin or oral hypoglycemic medication or, alternatively, two or more fasting glucose values >7.8 mmol/L (140 mg/dL) were regarded as confirmation of the diagnosis of dia-betes. By these criteria, the entire sam-ple had diabetes.
The lists from all sources were examined for mortality status. At the time the lists were initially obtained from the clinics and diabetic associa-tion, they were reviewed by a study representative and clinic nurses to identify individuals who were de-ceased. At the end of the study period, a second review was conducted to determine if additional individuals had died. The mortality status of in-dividuals identified as deceased was confirmed by examination of medical records at the Queen Elizabeth Hos-pital. Individuals known to be de-ceased were removed from all lists. All other subjects were assumed to be alive on December 31, 1995, the date to which the prevalence estimates apply.
The information collected on each diabetic individual included his or her name, gender, age, and address. For regional information, the case listings were checked to ensure that all addresses corresponded to appropri-ate regions. Pair-wise comparisons of the sources were performed by health region, matching cases on name, age, and address.
Using the technique described by LaPorte et al. (9), log linear modeling with the General Linear Interactive Models (GLIM) software (10) was used to estimate the total number of individuals with diagnosed diabetes and to examine the dependence among the data sources. First, each diabetic individual was assigned to a
cell in an eight-cell3contingency table
corresponding to the source or sources in which he or she appeared—the DDA list (S1), the regional clinic records (S2), the hospital registry (S3), or a combination of these (S1+S2, S1+S3, S2+S3, or S1+S2+S3). The remaining open cell in the contingency table corresponds to the number of cases that are present in the popula-tion but do not appear in any of the three lists. Log linear models were then fitted that predict the open cell based on the data in the seven filled cells. Interaction terms were included in the models to assess whether the appearance of a name on any one list increased or decreased the likelihood of its appearing on any other (depen-dency).
It was anticipated that the propor-tions of cases ascertained by the sources would be different in Roseau, which is urban, than it was in the other regions, which are rural. Therefore, in addition to the analysis of the overall data, log linear models were fitted to the data from the Roseau area alone, and to data from the combination of the other regions excluding Roseau. The significance of parameters in the models was assessed with the chi-square test statistic. Population denom-inators for the calculation of preva-lence rates were obtained from the 1991 Dominica census (11).
RESULTS
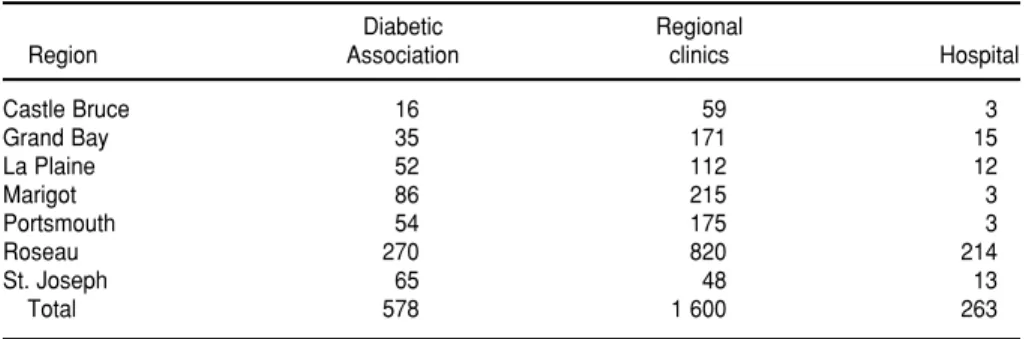
The numbers of individuals with diagnosed diabetes tallied in the three sources in each of Dominica’s health regions are presented in Table 1. After matching, the number of different individuals was found to total 1 945 (Figure 1). The best fitting log linear model for the overall data (Table 2) indicated that approximately 743 cases (27.6% of the island’s diabetics) were missing from all three sources. There-fore, the ascertainment-corrected esti-mate of the total number of diagnosed
diabetic subjects on Dominica in 1995 was 2 688 (95%CI: 2 548 to 2 828). The corresponding crude and ascertain-ment-corrected estimates of the preva-lence of diagnosed diabetes were 2.71% and 3.75%, respectively.
In every source, the majority of dia-betic individuals were identified in the Roseau region. The best fitting log lin-ear model for the data from Roseau indicated that 546 cases (95%CI: 396 to
696) in that region were missed by all three sources of ascertainment. When compared to the observed number of cases, 1 044, this figure represents an under-ascertainment of approximately 34.3%. This suggests that most of the missed cases on the island were in the Roseau region. When the Roseau region was excluded from analysis, the best fitting log linear model in-dicted that the three sources of ascer-tainment failed to ascertain only 50 (95%CI: 12 to 87) diabetic individuals in the other six health regions. Thus, with 901 observed cases of diabetes in the rural areas, underascertainment was only 5.3%.
The patterns of interaction in the national data and the Roseau data were similar. In both best fit models, there was positive interaction between the lists from the DDA and the hospi-tal, and negative interaction between the lists from the regional clinics and the hospital. However, for the data from the rural areas excluding Roseau, there was negative interaction both between the DDA and the regional
clinics and between the regional clinics and the hospital.
DISCUSSION
In many countries, monitoring sys-tems that rely on counting cumulative cases are too inaccurate to serve as a basis for the effective allocation of re-sources to address the problem of dia-betes (12). An alternative monitoring strategy, blood glucose screening, is usually too costly for these countries to use to obtain national estimates of the prevalence of diabetes. Capture-recapture with log linear modeling appears to be a useful means of obtain-ing cost-efficient, reliable estimates of diabetes frequency (9). However, the feasibility of using CR to monitor dia-betes in developing countries depends to a great extent on the ease of access to sources of information and the amount of manpower required to obtain the necessary information.
On the island of Dominica, we were able to find three sources of informa-tion that could be used to identify dia-betic subjects across the island. Similar sources may be available in many of the other Caribbean countries in the region. The major manpower costs associated with this study involved the time required to travel to various clinics to collect the lists, and follow-up of diabetic subjects to confirm diag-nosis of diabetes or mortality status. We anticipate that once the available sources have been integrated into an ongoing monitoring system, the costs associated with data collection and follow-up will be minimized.
TABLE 1. Total number of diabetic subjects identified, by source and region
Diabetic Regional
Region Association clinics Hospital
Castle Bruce 16 59 3
Grand Bay 35 171 15
La Plaine 52 112 12
Marigot 86 215 3
Portsmouth 54 175 3
Roseau 270 820 214
St. Joseph 65 48 13
Total 578 1 600 263
FIGURE 1. Number of diabetic subjects identified by source and the number com-mon to multiple sources
S1 = Diabetic Association
S2 = Regional
Clinics S3 = Hospital 195
309 30
44
1 178
83
106
TABLE 2. Best-fit log linear models for the data from the three sources (S1, S2, S3)aof ascertainment with parameter coefficients and esti-mated number of missed cases with 95% CI, by region
Region Model Cases Missed
All regions (⫺1.338)S1 + (0.460)S2 + (⫺1.931)S3 + (0.400)S1.S3b+ (⫺0.7436)S2.S3b 743(95%CI: 603 to 883)
Urban (Roseau) (⫺1.648)S1 + (0.1082)S2 + (⫺1.777)S3 + (0.4072)S1.S3b+ (⫺0.3335)S2.S3b 546(95%CI: 395 to 696)
Rural regions (combined) (0.5978)S1 + (2.441)S2 + (⫺1.504)S3 + (⫺1.676)S1.S2b+ (⫺2.241)S2.S3b 50(95%CI: 12 to 87)
Similar to other reports (13, 14), the results of our CR study indicated that the pooled data from the sources of ascertainment significantly under-represented the number of diabetic individuals on the island. They ac-counted for only 72.4% of the total dia-betic population as estimated with CR. It is interesting to note that the portion of estimated cases that was missed by the three sources of ascertainment was greatest (34.2%) in the Roseau region, the urban center of the island. This may reflect the fact that, compared to the rural areas, there are larger num-bers of private physicians in the Roseau region who are more accessible as alternative sources of care for dia-betic subjects. Additional sources of ascertainment (for example, lists from pharmacies that dispense diabetic medications) may be needed in that region to provide a more stable na-tional estimate of the frequency of diagnosed diabetes on the island. In the six other regions, the three sources of ascertainment appear to be ade-quate, as they identified approximately 94.7% of the estimated total number of individuals with diagnosed diabetes.
Given that the majority of diabetic individuals were identified in the Roseau region, it is not surprising that
the pattern of interactions among the three sources of ascertainment was parallel in Roseau and nationwide. The finding in Roseau of a positive interaction between the DDA and clinic lists—such that an individual’s presence on one increased the likeli-hood that he or she would also be rep-resented on the other—may reflect an increased awareness of the need for specialized care among the DDA members, and Roseau residents’ rela-tive ease of access to the hospital clinic, compared to their more remote com-patriots. The negative interactions observed among the sources of infor-mation in the rural areas suggest that the rural clinics may have access to rel-atively unique populations of diabetic individuals. This may indicate that the DDA is not reaching the rural areas as well as it is the urban population, and that rural residents are dissuaded from using the Princess Margaret Hos-pital clinic by the distance they would have to travel.
At the start, it was our intention to use CR to monitor diabetes treatment and complications issues as well as disease prevalence. However, we found the regional clinics did not all record diabetic complications in the same way, which put this objective
beyond reach. Nevertheless, in princi-ple, CR methods can be used for mon-itoring important disease features in addition to prevalence.
In summary, to our knowledge, this is the first use of CR methods to mon-itor the frequency of diabetes in the Caribbean. To optimize accuracy and cost-effectiveness, these methods should be used with a surveillance system that incorporates standardized guidelines for data collection. Such a system would assist ministries of health with strategic planning for the allocation of resources to meet the needs of diabetic individuals in the Caribbean.
Acknowledgments. This research
was supported by a Minority Interna-tional Research Training grant, NIH 5 T37 TW00038-01, from the Fogarty International Center, National Insti-tutes of Health, USA. We would like to thank Ron LaPorte and Yue-Fang Chang from the University of Pitts-burgh for the technical assistance they provided to this project. We also appreciate the efforts of staff members at the regional health clinics and the Princess Margaret Hospital on Domi-nica who assisted us in obtaining the lists of diabetic subjects.
1. Zimmet P. Type 2 (noninsulin-dependent) diabetes—an epidemiological overview. Diabetologia1982;22:399–411.
2. Alberti KGM. World aspects of diabetes. Diabetic Med1986;3:103–105.
3. Tull ES. Diabetes in the West Indies: cur-rent aspects and future prospects. IDF Bulletin1993;38:21–23.
4. Hook EB, Regal RR. The value of capture-recapture methods even for apparent ex-haustive surveys: the need for adjustment for source of ascertainment intersection in attempted complete prevalence studies. Am J Epidemiol1992;135:1060–1067. 5. LaPorte RE, McCarty DJ, Tull ES, Tajima
N. Counting birds, bees, and NCDs (let-ter). Lancet1992;339:495.
6. Bruno G, LaPorte RE, Merletti F, Biggeri A, McCarty DM, Pagano G. National dia-betes programs: application of capture-recapture to count diabetes? Diabetes Care 1994;17:548–556.
7. LaPorte RE, McCarty D, Bruno G, Tajima N, Baba S. Counting diabetes in the next millennium: application of capture-recapture technology. Diabetes Care1993; 16:528–534.
8. World Health Organization. WHO Expert Committee on Diabetes Mellitus. Geneva: WHO; 1985.
9. LaPorte RE, Dearwarter SR, Chang Y, Songer TJ, Aaron DJ, Anderson RL, Olsen T. Efficiency and accuracy of disease mon-itoring systems: application of capture-recapture methods to injury monitoring. Am J Epidemiol1995;142:1069–1077. 10. Barker RJ, Nelder JA. GLIM Manual
(re-lease 3.77). Oxford, England: Royal Statis-tical Society; 1987.
11. Central Statistical Office.Commonwealth of Dominica, Population and Housing Census, 1991. Roseau, Dominica: CSO; 1991. 12. International Working Group for Disease
Monitoring. Capture-recapture and
mul-tiple-record systems estimation II: appli-cations in human disease. Am J Epidemiol 1995;142:1059–1068.
13. McCarty DJ, Tull ES, Moy CS, Kwoh CK, LaPorte RE. Ascertainment corrected rates: applications of capture-recapture methods. Int J Epidemiol1993;22:559–565. 14. LaPorte RE, Tull ES, McCarty D.
Moni-toring the incidence of myocardial in-farctions: applications of capture-mark-recapture technology. Int J Epidemiol1992; 21:258–262.
Manuscript received on 22 September 1997. Revised ver-sion accepted for publication on 12 December 1997.
El propósito de este trabajo fue evaluar la utilidad de la metodología de estimación por captura y recaptura (CR), aplicada junto con fuentes de información fácilmente accesibles, para monitorear la frecuencia de diabetes mellitus en un país en desarrollo. En la isla caribeña de Dominica, se recogieron de julio de 1995 a julio de 1996 los nom-bres de todas las personas que figuraban como mínimo en una de tres fuentes dife-rentes por haber recibido un diagnóstico de diabetes en el transcurso de 1995. Las fuentes fueron la lista de miembros de la Asociación de Diabetes de Dominica, un re-gistro de los pacientes atendidos en siete centros de salud regionales y las fichas clíni-cas del Hospital Princess Margaret, que es el más importante de la isla. Se aplicaron técnicas de CR para estimar el número de dominicanos con diabetes diagnosticada que no fueron detectados por ninguna de las tres fuentes, y para evaluar las discre-pancias entre las distintas fuentes. Se procedió a calcular la prevalencia estimada de diabetes diagnosticada, corrigiéndola según los datos obtenidos. Las tres fuentes iden-tificaron a un total de 1 945 individuos diferentes. Cuando se comparó con la esti-mación corregida que se obtuvo por el método de CR (2 688), se observó que esta cifra representaba solamente 72,3% de la verdadera prevalencia de diabetes diagnosticada. La mayor parte de la subdetección en las fuentes de datos correspondió a casos que no fueron captados en la zona urbana de la isla. Esta forma de monitorear la enfermedad podría resultar útil en otros países caribeños. No obstante, hacen falta procedimientos estandarizados de recolección y notificación de datos sobre prevalencia y morbilidad para lograr que este enfoque rinda al máximo en exactitud y costo-efectividad.
RESUMEN
Uso de métodos de captura y
recaptura para monitorear
la diabetes en Dominica,
Indias Occidentales
VIII Congreso Argentino de Micología
Fechas: 12 a 14 de agosto de 1998 Lugar: San Miguel de Tucumán, Argentina
Este encuentro científico, organizado por la Asociación Argentina de Micología, se cele-bra con el propósito de conseguir un intercambio de experiencias entre estudiantes y profe-sionales que de alguna manera se beneficiarían de la adquisición de mayores conocimientos en el campo de la micología. Se incluyen entre ellos los profesionales de la medicina, bioquímica, odontología, ingeniería, veterinaria, biología, farmacia y otros campos afines. El encuentro tam-bién está dirigido a facilitar la creación de vínculos entre expertos de distintos países y a for-talecer la formación de recursos humanos para el próximo milenio.
Participarán en el VIII Congreso numerosos expertos de prestigio y reconocimiento internacional. El programa incluye conferencias, mesas redondas y la presentación de trabajos científicos. Simultáneamente se ofrecerán cursos de actualización para graduados.
Información:
Secretaría del VIII Congreso Argentino de Micología Cátedra de Micología
Instituto de Microbiología “Luis C. Verna” Facultad de Bioquímica, Química y Farmacia
Universidad Nacional de Tucumán Ayacucho 491 – (4000) Tucumán, Argentina
Tel.: 054 81 247752 Fax: 054 81 248025