www.scielo.br/ eq
Volume 34, número 2, 2009
Flow injection visible diffuse relectance quantitative analysis
of total sulfur in biodiesel, in plant leaves and in natural waters
Matthieu Tubino*, Carlos A.R. Queiroz Institute of Chemistry, State University of Campinas
CP 6154, CEP 13083-970 Campinas, SP, Brazil
Abstract: Flow injection (FI) methodology, using diffuse reflectance in the visible region of the spectrum, for the analysis of total sulfur in the form of sulfate, precipitated in the form of barium sulfate, is presented. The method was applied to biodiesel, to plant leaves and to natural waters analysis. The analytical signal (S) correlates linearly with sulfate concentration (C) between 20 and 120 ppm, through the equation S= 1.138+0.0934 C (r = 0.9993). The expe-rimentally observed limit of detection is about 10 ppm. The mean R.S.D. is about 3.0 %. Real samples containing sulfate were analyzed and the results obtained by the FI and by the referen-ce batch turbidimetric method using the statistical Student’s t-test and F-test were compared. Keywords: diffuse relectance; solution; sulfur; sulfate; biodiesel; plant leaves; water
Introduction
When compared, for example, with those methods that use transmittance (absorbance), re-lectance quantitative analytical methods in the UV–Vis region are not very popular. This fact can be attributed, in part, to the dificulty in preparing rigorously homogeneous relecting surfaces. Ho-wever, despite this problem, several quantitative relectometric methods for the determination of analytes immobilized on solid supports have been developed offering quite good results [1–10]. It is also possible to work in solution, measuring the diffuse relectance of solids suspended in liquids [1-2, 8].
Turbidimetry and nephelometry are closely related analytical techniques based on the scatte-ring of radiation by a solution containing disper-sed particulate matter. When a radiation passes through a transparent medium in which solid par-ticles are dispersed, part of the radiation is scat-tered in all directions, giving a turbid appearance to the mixture. Turbidimetry is based on the
mea-suring of the intensity of the radiation transmitted by the solution whereas nephelometry is based on the scattered radiation at an angle, usually at the right angle. Turbidimetry is usually applied in the cases of concentrated particulates disper-sed in solution whereas nephelometry is badisper-sed on the scattered radiation at an angle, usually at the right angle. Turbidimetry is usually applied in the cases of concentrated particulates dispersed in so-lution while nephelometry offers reliable results at low concentrations because a small scattering intensity against a black background is easier to measure than a small change in intensity of inten-se transmitted radiation. The intensity of radiation appearing at any angle depends upon the number of particles, their size and shape, as well as the wavelength of the radiation [11].
The application of low methods based on the formation of precipitates in line implies in some possible problems. Among them the most obvious are the clogging of the tubes and the de-position of precipitate on the windows of the op-tical cell.
Despite these problems however various turbidimetric, nephelometric, and relectometric methods were reported in the literature [10 – 24].
Recently, the possibility to determine ni-ckel by diffuse relectance in a low system where it was precipitated and kept dispersed as nickel dimethylglyoximate, a solid compound that easily adders to surfaces and that rapidly forms agglo-merates was demonstrated [1].
Sulfate is probably the most popular analyte determined by low turbidimetric proce-dure, based on its precipitation as barium sulfate. Krug et al., in 1977 [25] adapted to a low injec-tion procedure the classical batch turbidimetric method for the determination of sulfate in natural waters and plants digest. It has been successfully applied to a variety of matrixes as environmental, plant digests, clinical and wine samples [24-48]. Alternatively, low procedures for sulfate analysis are based on the precipitation of PbSO4 [49]. A nephelometric low method for sulfate was also described [50].
The nucleation of barium sulfate is pH de-pendent [27,31,46]. The pH not only affects the formation of the barium sulfate precipitate but also its structure. A precipitate obtained in a solu-tion which pH is below 3 consists of well-shaped crystals, whereas at pH from 3 to 7 the precipitate is amorphous [27]. To obtain an acidic medium, hydrochloric acid is frequently applied. This addi-tion is also done to prevent the formaaddi-tion of pre-cipitates like carbonate, sulite and phosphate of barium, which may interfere [48].
One of the critical problems in sulfate de-termination using its precipitation with barium ions is the formation of deposits of barium sulfa-te in the syssulfa-tem, including on the cell windows. To resolve this situation, Liu and Dasgupta [40] proposed an elegant method where the precipitate is formed in situ in a drop. However, despite the fact that this system solved the problem of the de-position on the cell windows, the precipitation of
barium sulfate in the capillary tubes of the low system probably still remains.
In this work the objective was to develop a very simple relectometric method for the deter-mination of sulfate in natural water and in digests in which the deposition of barium sulfate into the low system is minimized. In this sense, a simple glass cell without corners was idealized (essen-tially a glass tube) and a very thin precipitate was desired.
Experimental
Apparatus
the batch procedure a Micronal model B–382 was used. Mixer with magnetic stirring: already des-cribed [54-55].
In Figure 1 a scheme of the low injection system is shown. A1 is the low containing barium
ions 0.050 mol L-1 with polyvinyl alcohol 0.05%
m/v in HCl 0.01 mol L-1. The low A
2 (carrier) is
an HCl 0.01 mol L-1 aqueous solution. In this
stre-am the sstre-ample containing sulfate is introduced. In the mixer M and in the coil L the reaction (preci-pitation) that is detected by the relectometric sen-sor occurs. After ive determinations it is
recom-mendable to clean the line injecting 1 mL of an EDTA 0.02 mol L-1 in NaOH 0.6 mol L-1 solution
[27,31], using a hypodermic syringe S, in order to avoid accumulation of the precipitate along the line, including on the cell windows. In the mixer
M the mixture of the reagent with the analyte so-lution is vigorously stirred, increasing the contact of the reagent species and therefore decreasing the reaction time. It is also expected that this stirring favors the formation of very small particles.
FIGURE 1
Figure 1. Scheme of the low injection manifold: A1 = reagent solution of Ba2+ 0.050 mol L-1 with polyvinyl alcohol 0.05% m/v in HCl 0.01 mol L-1 at a low rate of 2.27 mL min-1; A
2 = HCl 0.01 mol L
-1 at a low rate of 2.27 mL min-1 (carrier solution); D = pulsation damper; L = 100 cm length reaction coil; M = mixer with magnetic stirring; ML = introducing of EDTA cleaning solution; S = syringe with EDTA solution; P = peristaltic bomb; I = entrance of the aliquot one; V = sample introducing valve; W= waste; BT = 6 V battery; PS = 12.0 V power supply; WB = Wheatstone bridge; RE = potentiometric chart recorder; LED = light emitter diode; LDR = light dependent resistance; I = sampling inlet, volume of the aliquot 500 µL.
Reagents and solutions
All the reagents used were of analytical grade. The water was distilled in a glass distiller and deionized in a Milli-Q Plus Ultra-Pure sys-tem. 1.0 L of sulfate 1000 ppm stock solution was prepared: 1.3760 g of the (NH4)2SO4 dried in an oven for 2 hours at 120 oC was dissolved in 1000.0
mL of water in a volumetric lask. The concen-trations of the analyte used for the construction of the calibration curve were obtained from this stock solution after adequate dilutions.
Barium ions solution 0.050 mol L-1, with
polyvinyl alcohol 0.05% m/v in HCl 0.01 mol L-1,
mol L-1, was prepared by diluting 0.8 mL of
con-centrated HCl in 1 liter of water.
Reference method
As reference method the batch turbidime-tric procedure was used [56-57]. The construc-tion of the calibraconstruc-tion curve was done as follo-ws. Using a class A glass pipette, 2.0 mL of the barium 0.050 mol L-1 solution was put in a small
25 mL beaker containing a magnetic bar. 2.0 mL of the sulfate solution (in presence of PVA (0.05 % w/v) and HCL (0.01 mol L-1)) was carefully
added under magnetic agitation. The system was allowed to react during 2 minutes with stirring. In sequence, the turbidimetric measurement was done in the spectrophotometer at 420 nm, using a 2 cm pathway glass cell. The standard sulfate solutions were prepared in the following concen-trations: 20, 40, 60, 80, 100 and 120 ppm (w/v). The calibration curve is described by the equation
A = 0.0879 + 0.01122 C (r = 0.998), where A is the absorbance value and C the sulfate concentra-tion in mg L-1.
Real samples
Natural waters:In the case of natural wa-ters I and II, an initial volume of the original sam-ples was evaporated in order to concentrate the sulfate. 10 mL of HCl 0.1 mol L 1 per liter of
wa-ter before the concentration process was added to avoid precipitation of carbonates. Natural water
III was analyzed as it was in the bottle after de-gasiied using ultrasound. Plant leaves:Adequate mass of soy leaves was carefully calcinated in a microwave furnace. The temperature was increa-sed from the ambient to 100 oC and then in steps of
100 oC until 400 oC, following a direct heating to
550 oC. In the intermediate temperatures the
sam-ple stands during 30 minutes and at 550 oC during
one hour. The residue was treated with water and with sodium carbonate during 30 minutes at about 80 oC, following iltration directly in a 25.0 mL
volumetric lask. Enough HCl solution 0.1 mol L-1
was drop-wise added until a pH lower than 4. The volume was completed to the mark with HCl 0.01 mol L-1. This solution was directly introduced in
the low system and analyzed with the batch tur-bidimetric procedure. Biodiesel:A sample of bio-diesel was carefully calcinated at 550 oC similarly
to the soy leaves procedure above described and the residue treated as done above for soy leaves.
Results and Discussion
In the FI relectometric cell the LED and the LDR are relatively positioned in an angle of 90◦ which vertex falls below the low cell. This angle was chosen in order to minimize the specu-lar relection component and, at the same time, to maintain enough radiation reaching the detector.
When water or transparent solutions pass through the cell, the light coming from the light emitter diode (LED; λmax = 566 nm) partially relects on the walls of the glass tube and on the solution interfaces. The relection on the walls of the cell was minimized as it was constructed in black PTFE. The relections on the glass walls and on the interfaces glass-solution and solution-glass still occur and are comparable to those in the cell constructed with white PTFE [1]. A constant part of this radiation reaches the detector (LDR;
λmax = 550 nm) which resistance is then equili-brated in the Wheatstone bridge until the read vol-tage is zero. When the white precipitate of barium sulfate enters the cell, the radiation is randomly relected on the particles in all directions. With the relection process, the intensity of the light that reaches the detector changes upsetting the Whe-atstone bridge. The resultant signal is registered, being proportional to the quantity of precipitate, in the working concentration range.
with the increasing of the analyte concentration, reaching the maximum limit in the solid case.
Considering the coniguration of the detec-tion cell used in the present work these relecdetec-tions occur on the suspended particles in the glass tube
placed into the detection cell. The walls of the tube and the relection and refraction on them and on interfaces are not shown in igure 2, for visual simplicity purposes.
Taking into account the geometry of the cell, the relectance (radiation that is relected out of the plane of incidence of the light) that occurs on the irst rows of the suspended particles in the solution can be considered, in a whole, as a diffuse relectance phenomenon.
FIGURE 2
Figure 2. Simpliied scheme representing some of the possible light relections on solid particles suspended in a solution, in a diffuse relection process.
To optimize the FI system, the inluence of various parameters was investigated. The depen-dence of the signal height on the total low rate from 1.90 mL to 4.67 mL min−1 was studied. The rate of 4.67 mL min−1 for the method was selected as it combines analytical signal of good intensi-ty and high analytical frequency. The analytical signal was considered good when the obtained R.S.D. (i.e. the relation 100 × S.D. / S; S.D. is the standard deviation and S is the analytical signal) was about 3% or better.
The inluence of the reaction coil length was also investigated. It was observed that the signal increases when L increases from 50 to 100 cm, falling beyond this length. The length of 100 cm was adopted.
The inluence of the sampling volume on the analytical signal was studied from 200 to 500
µL. After an initial fast increase, beyond 400 µL a minor inluence on the signal is observed. For the experiments the volume of 500 µL was adopted as it furnishes a very good analytical signal without decreasing the analytical frequency.
Barium chloride solutions in presence of polyvinyl alcohol (PVA) 0.05% w/v, in HCl 0.01
mol L 1, were prepared [25]. PVA acts as
stabili-zer of colloids increasing the repeatability of the system.
The inluence of the concentration of ions Ba2+ on the analytical signal was studied and the
results are shown in igure 3. Krug et al. [25] used a solution of Ba2+ 0.204 mol L-1 for the
quanti-tative precipitation of barium sulfate in a FI tur-bidimetric method. In the present work however it was observed that, above ca. 0.025 mol L-1 of
Ba2+, the analytical signal does not present
signi-icant increase. To guarantee a safety margin of concentration for the quantitative precipitation of barium sulfate, a solution of barium chloride 0.05 mol L-1 was adopted. This decrease in the barium
FIGURE 3
Figure 3. Inluence of the concentration of ions Ba2+ on the height of the analytical signal. Concentration of sulfate ions = 100 ppm; Flow rate = 4.67 mL min−1; Bobbin of reaction = 100 cm; Sampling volume = 500
µL.
To avoid accumulation of barium sulfate in the low system, it periodically cleaned, after a set of ive determinations, with an EDTA 0.06 mol L-1
in NaOH 0.2 mol L-1 solution, using a syringe S
located before the mixer with magnetic agitation, as can be seen in igure 1.
The calibration curve of the method was studied between 0 and 275 ppm. The linear
beha-vior is obeyed between 20 and 120 ppm and is described by the equation h = – 1.138 + 0.0934 C, where h is the height of the signal in centime-ters and C the concentration of sulfate in ppm (mg L-1). The correlation coeficient is r = 0.9993.
From 20 to 180 ppm the calibration curve is described by the polynomial equationh = – 2.46 + 0.144 C – 3.05 × 10⁻⁴C2 (r = 0.998).
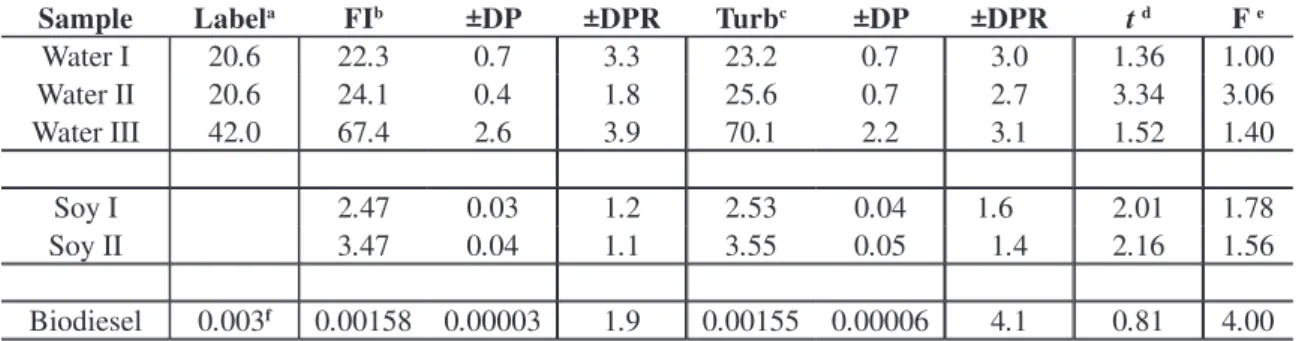
Table 1. Comparison between values obtained by the proposed FI method and by the turbidimetric batch method, for different samples, using the statistical Student’s t-test and the F test [58] in 5% signiicance level. Ιn the biodiesel case, the results are expressed as % w/wof sulfate; the soy leaves results are expressed as mg kg-1; waters analyses are expressed as mg L-1 of sulfate.
Sample Labela FIb ±DP ±DPR Turbc ±DP ±DPR t d F e
Water I 20.6 22.3 0.7 3.3 23.2 0.7 3.0 1.36 1.00 Water II 20.6 24.1 0.4 1.8 25.6 0.7 2.7 3.34 3.06 Water III 42.0 67.4 2.6 3.9 70.1 2.2 3.1 1.52 1.40
Soy I 2.47 0.03 1.2 2.53 0.04 1.6 2.01 1.78 Soy II 3.47 0.04 1.1 3.55 0.05 1.4 2.16 1.56
Biodiesel 0.003f 0.00158 0.00003 1.9 0.00155 0.00006 4.1 0.81 4.00
a Value declared in the label; bFI = proposed low injection method; c Turb= turbidimetric batch
signiicance level: tabled F = 6.94; the number of determinations, n1, for the low method, was n1=5; for the turbidimetric batch method n2 = 3; tabled t is 2.45.
In table 1 it can be observed that, excepting in the case of water II where the t calculated value is a little above the tabled value, all other results indicate agreement between the two methods in the 5% signiicance level. If the 1% signiicance level is considered, the tabled t = 3.71, and, there-fore, even in the case of water II statistical agree-ment is observed [58].
Conclusions
In face of the above explained, the pro-posed FI relectometric procedure for the deter-mination of sulfate in various matrixes offers analytical quantitative results of good precision and accuracy; it is very simple to be performed; the instrumentation used is of relatively low cost; the reagent concentration is low; about 120 deter-minations can be easily performed per hour.
In comparison with the turbidimetric ba-tch procedure the low proposed method is more precise and simpler to be performed. In compa-rison with the low turbidimetric method
propo-sed by Krug et al. [25], the results are similar but the used reagent concentration in the method here proposed is lower; it also uses a commercial spec-trophotometer whereas the here proposed proce-dure uses a home made detection device. Krug’s method was applied to natural water samples and leaves digest. In the present work a new analytical matrix, biodiesel, was introduced presenting very good results.
Based on these results the method can be recommended as an alternative for the quantitati-ve analysis of sulfate in a variety of samples.
Acknowledgements
The authors are grateful to CAPES, Coor-denação de Aperfeiçoamento de Pessoal de Nível superior, to CNPq, Conselho Nacional de Pes-quisa Cientíica e Tecnológica, and to FAPESP, Fundação de Amparo à Pesquisa do Estado de São Paulo, for the inancial support.
Determinação Potenciométrica De Minoxi-dil Em Formulações Farmacêuticas De Uso Tó-pico
Received November 03 2008 Accepted October 14 2009
Resumo: Um método potenciométrico para a determinação de minoxidil em formulações far-macêuticas baseado na reação redox entre K2Cr2O7 e o minoxidil, foi desenvolvido. Os melho-res melho-resultados foram obtidos usando concentrações de 1,00 x 10⁻² mol L-1 para o minoxidil e
1,00 x 10⁻³ mol L-1 para o K
2Cr2O7 ambos diluídos em uma solução em de H2SO4 2,00 mol L -1, a
60°C. As recuperações para método proposto foram da ordem de 98,7 % a 97,4 % dependendo da amostra comercial. O método proposto foi aplicado à amostras comerciais contendo mino-xidil e, quando comparado com resultados obtidos a partir de procedimentos cromatográficos, apresentou concordância no nível de confiança de 95%, de acordo com o teste t-Student. Palavras chave:Determinação minoxidil; titulação; potenciometria.
References
[1]. M. Tubino, C.A.R. Queiroz, Anal. Chim. Acta 600 (2007) 199.
[2]. F.A.A. Matias, M.M.D.C. Vila, M. Tubino, Sens. Actua-tors B Chem. 88 (2003) 60.
[3]. M.A. Gotardo, A.C. Gigante, H.R. Pezza, Talanta 64 (2004) 36.
[4]. A. Ghauch, C. Turnar, C. Fachinger, J. Rima, A. Charef, J. Suptil, M. Martin-Bouyer, Chemosphere 40 (2000) 1327. [5]. A. Ghauch, J. Rima, A. Charef, J. Suptil, C. Fachinger, M. Martin-Bouyer, Talanta 48 (1999) 385 .
[6]. M. Kompany-Zareh, M. Mansourian, F. Ravaee, Anal. Chim. Acta 471 (2002) (2002) 97.
[7]. I.A. Raimundo, R. Narayanaswamy, Sens. Actuators B Chem. 90 (SI) (2003)189.
[9]. N. Malcik, P. Caglar, R. Narayanaswamy, Quim. Anal. 19 (Suppl. 1) (2000) 94.
[10]. J. Ruzicka, E.H. Hansen, Anal. Chim. Acta 173 (1985) 3.
[11]. I.P.A. Morais, I. V. Tóth, A. O. S. S. Rangel, Spectrosc. Lett. 39 (2006) 547.
[12]. G. Kortum, W. Brawn, G. Herzog, Angew. Chem. 2 (1963) 333.
[13]. J. Ruzicka, C.H. Pollema, K.M. Scudder, Anal. Chem. 65 (1993) 3566.
[14]. J. Ruzicka, Anal. Chim. Acta 308 (1995) 14.
[15]. B. Kuswandi, R. Narayanaswamy, Anal. Lett. (1998) 31 395.
[16]. R.H. Taylor, J.W. Grate, Talanta 42 (1995) 257. [17]. M. Miró, W. Frenzel, J.M. Estela, V. Cerdà, Analyst 126 (2001) 1740.
[18]. M.I. Albero, J.A. Ortuno, M.S. Garcia, C. Sanchez-Pedreño, R. Exposito, , J. Pharm. Biomed. Anal. 29 (2002) 779.
[19]. N.A. Yusof, M. Ahmad, Sens. Actuators B Chem. 94 (2003) 201.
[20]. C. Pons, R. Forteza, V. Cerdà, , Anal. Chim. Acta 528 (2005) 197.
[21]. L. Ferrer, G. Armas, M. Miró, J.M. Estela, V. Cerdà, Talanta 68 (2005) 343.
[22]. J.H. Lee, M.A. Han, S.W. Kang, S.S. Seo, H. Hwang, Bull. Korean Chem. Soc. 26 (2005) 36.
[23]. V. Kuban, Fresenius J.Anal. Chem. 346 (1993) 873. [24]. S. M. B. Brienza, F. J. Krug, J. A. G. Neto, A. R. A. Nogueira, E. A. G. Zagatto, J. Flow Injection Anal. 10 (1993) 187.
[25]. F. J. Krug, H. Bergamin Filho, E. A. G. Zagatto, S. S. Jørgensen, Analyst 102 (1977) 503.
[26]. J. F. van Staden, W. D. Basson, Lab. Practice 29 (1980)1279.
[27]. S. Baban, D. Beetlestone, D. Betteridge, P. Sweet, Anal. Chim. Acta.114 (1980) 319.
[28]. W. D. Basson, J. F. van Staden, Water Res. 15 (1981) 333.
[29]. J. F. van Staden, Fresenius J. Anal. Chem. 310 (1982) 239.
[30]. J. F. van Staden, Fresenius J. Anal. Chem. 312 (1982) 438.
[31]. F. J. Krug, E. A. G. Zagatto, B. F. Reis, F. O. Bahia, A. O. Jacintho, S. S. Jørgensen, Anal. Chim. Acta. 145 (1983) 179 .
[32]. J. F. van Staden, Fresenius J. Anal. Chem. 326 (1987) 754.
[33]. A. B. Marsden, J. T. Tyson, Anal. Proc. 26 (1989) 157. [34]. D. L. Heanes, Anal. Lett. 23 (1990) 543.
[35] D. L. Heanes, Anal. Lett. 23 (1990) 675.
[36]. K. Sonne, P. K. Dasgupta, Anal. Chem. 63 (1991) 427. [37]. C. Morante, Anal. Chim. Acta. 249, 479 (1991).
[38]. M. M. Santos Filho, B. F. Reis, F. J. Krug, C. H. Collins, N. Baccan, Talanta 40 (1993) 1529.
[39]. S. M. B. Brienza, R. P. Sartini, J. A. G. Neto, E. A. G. Zagatto, Anal. Chim. Acta. 308 (1995) 269.
[40]. H. Liu, P. K. Dasgupta, Anal. Chim. Acta. 326 (1996) 13.
[41]. J. F. van Staden, R. E. Taljaard, Anal. Chim. Acta. 331 (1996) 271.
[42]. J. F. van Staden, R. E. Taljaard,. Fresenius J. Anal. Chem. 357 (1997) 577.
[43]. J. A. Vieira, B. F. Reis, E. A. M. Kronka, A. P. S. Paim, M. F. Giné, Anal. Chim. Acta. 366 (1998) 251.
[44]. R. A. S. Lapa, J. L. F. C. Lima, I. V. O. S. Pinto, Analusis 28 (2000) 295.
[45]. J. A. Vieira, I. M. Jr. Raimundo, B. F. Reis, Anal. Chim. Acta 438 (2001) 75.
[46]. I. P. A. Morais, A. O. S. S. Rangel, M. R. S. Souto, J. AOAC Int. 84 (2001) 59.
[47]. I. P. A. Morais, M. R. S. Souto, T. I. M. S. Lopes, A. O. S. S. Rangel, Water Res., 37 (2003) 4243.
[48]. H. R. Silva, M. A. Segundo, A. O. S. S. Rangel, J. Braz. Chem. Soc. 14 (2003) 59.
[49]. R. E. Santelli, P. R. S. Lopes, R. C. L. Santelli, A. L. R. Wagener, Anal. Chim. Acta. 300 (1995) 149.
[50]. J. Jakmunee, Y. Udnan, R. Morrison, R. Beckett, I. Mckinnon, K. Grudpan, Anal. Sci. 19 (2003) 1495.
[51]. M. Tubino, F.G. Barros, Quím. Nova 14 (1991) 49. [52]. J. Ruzicka, E.H. Hansen, Anal. Chim. Acta 114 (1980) 19.
[53]. T. C. Rodrigues, M. Tubino, O. E. S. Godinho, G. Oli-veira Neto, Analytical Sciences, 17 (2001) 629.
[54]. M. Tubino, M. M. D. C. Vila, J. Flow Injection Anal. 23 (2006) 112.
[55]. M. Tubino, M. M. D. C. Vila, Ecl. Quím. 33 (2008) 67. [56]. O. A. Ohlweiler, Química Analítica Quantitativa, vol. 3, Livros Técnicos e Científicos, Rio de Janeiro, 1974, p. 723. [57]. Official Methods of Analysis, 16th Ed., 3rd Suppl.,