www.scielo.br/ eq
Volume 34, número 2, 2009
Spectrophotometric low injection system for determination of
Zn
2+in ophthalmic formulations using Alizarin red S
Orlando Fatibello-Filho1 and Heberth Juliano Vieira2*
1Centro de Ciências Exatas e de Tecnologia, Departamento de Química,
Universidade Federal de São Carlos – UFSCar, P.O. Box 676, CEP 13.560-970, São Carlos, SP, Brazil.
2Centro de Ciências Exatas e Tecnológicas, Universidade do Pampa - Unipampa, P.O. Box 07, CEP 96400-970, Bagé, RS, Brazil.
Abstract: A spectrophotometric flow injection method for the determination of Zn(II) in
ophthal-mic formulations was developed. In this work, Zn(II) ion was complexed with Alizarin red S in borate buffer solution (pH 9.0) and the chromophore produced was monitored at 520 nm. The analytical curve was linear in the Zn(II) concentration range from 6.05 x 10⁻⁶ to 1.50 x 10⁻⁴
mol L-1 with a detection limit of 3.60 x 10⁻⁶ mol L-1. Recoveries ranged from 96.3 to 105 % and
a relative standard deviation of 1.2 % (n = 10) for 5.5x10⁻⁵ mol L-1 Zn(II)reference solution
were obtained. The sampling rate was 60 h-1 and the results obtained of Zn(II) in ophthalmic
products using this procedure are in close agreement with those obtained using a comparative spectrophotometric procedure at 95 % confidence level.
Keywords: Flow injection analysis; Zinc(II); Alizarin red S; spectrophotometry; ophthalmic formulations.
Introduction
Zinc compounds have bactericidal activi-ty since they can precipitate and denature several bacterial proteins. For this reason, they have been employed as antiseptic and disinfectant agents in pharmaceutical products such as creams, oint-ments and eye drops [1,2]. The antibacterial ac-tivity is enhanced in the mixture with quaternary ammonium compounds. Thus, the determination of Zn(II) in pharmaceutical preparations is an im-portant analytical task.
The USP XXIII Pharmacopoeia recom-mends the determination of Zn(II) by atomic ab-sorption spectrometry (AAS) or by an extractive spectrophotometric method [3].
Several spectrophotometric procedures re-ported in the literature for the determination of Zn(II)are summarized by Bhalotra et al.[4] and a previous solvent extraction step is required in
other spectrophotometric methods [5-9]. Elec-troanalytical methods such as potentiometry [10-12], potenciometric stripping analysis [13,14] and anodic redissolution stripping voltammetry also were described [15].
Several low injection methods have been
proposed employing different detections such as optosensor [16-19], anodic stripping voltammetry [20], diode array [21] and electrothermal atomic absorption spectrometry [22]. A
multicommuta-tion low procedure [23] and a sequential injec -tion analysis system [20] were described for the determination of Zn(II) in pharmaceutical formu-lations
The development of automated low proce -dures are of the great interest to quality control laboratories due the high number of analysis and possibility of data acquisition.
soluble complex between Alizarin red S (ALZ) and Zn2+ [24].
Experimental
Apparatus
A model 8452A Hewlett-Packard (Boise, ID, USA) UV-visible spectrophotometer was used in a comparative spectrophotometric method for Zn2+ in the ophthalmic formulations samples [8].
A peristaltic pump supplied with Tygon®
pump tubing was used for the propulsion of the solutions. The manifold was constructed with polyethylene tubing (0.8 mm i.d.). The solutions were injected using an injector-commutator 2-3-2 made of Perspex® [25]. The detection was
per-formed using a spectrophotometer (Femto, Model
435, São Paulo) equipped with a glass low-cell
(optical path, 10 mm). The absorbance was re-corded using a two-channel strip-charter recor-der Model 1202-0000 Cole Parmer (Chicago, IL, USA) connected to spectrophotometer.
Reagents and solutions
All reagents used were of analytical grade and water from a Millipore (USA) Milli-Q system was used throughout. Zinc sulphate heptahydrate and Borax were obtained from Mallinckrodt. Red Alizarin red S was purchase from Vetec® (São
Paulo, Brazil).
The 1.60x10⁻² mol L-1 borate buffer
solu-tion (pH 9.0) was prepared by dissolving 1.55 g of Na2B4O7·10H2O with desionized water and
com-pleting the volume in a 250 mL calibrated lask.
The 0.100 mol L-1 Zn2+ stock solution was
prepared by dissolving 2.874 g Zn(SO4).7H2O
with desionized water in 100 mL calibrated lask.
This solution was standardized volumetrically as described elsewhere [26]. Working solutions containing concentration range of Zn2+ between
6.05x10⁻⁶ to 1.50x10⁻⁴ mol L-1 were prepared by
the appropriated dilution of the stock solution with desionized water and the volume was
com-pleted in 25 mL calibrated lask.
The 1.00x10⁻² mol L-1 Alizarin Red S
stan-dard solution was prepared by dissolving 900 mg of monosodium salt (C.I. 58005) with 1.6x10⁻²
mol L-1 borate buffer solution (pH 9.0) in a 250.0 mL calibrated lask and the volume was completed
with the same buffer solution. The 3.00x10⁻⁴ mol
L-1 Alizarin Red S working solution was
prepa-red by diluting 3.0 mL in the 100.0 mL calibrated
lask and the volume was completed with the same
1.6x10⁻² mol L-1 buffer solution (pH 9.0).
Flow injection system
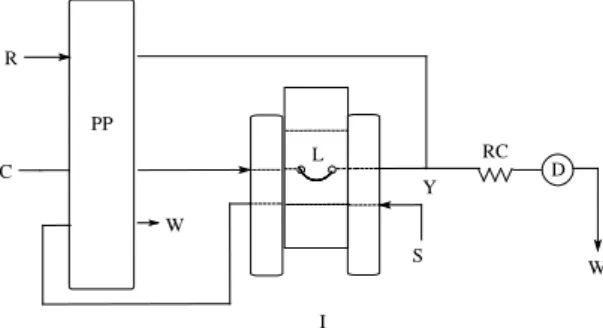
A schematic diagram of the low manifold
in injection position is shown in Figure 1. The carrier stream (H2O) merges downstream with the Alizarin red S solution where both are pumped at 1.2 mL min-1 generating a stable baseline. When
a 250 µL (50 cm) sample volume containing Zn2+
reference or sample solution was injected, occur the formation of the soluble complex between Ali-zarin red S and Zn2+ in the reactor coil (150 cm),
which was monitored spectrophotometrically at 520 nm. The analytical signal (absorbance) was proportional to Zn(II) concentration in the injec-ted solution.
C
W PP
W L
I
D RC
S Y R
Figure 1. Flow injection manifold for the
determi-nation of Zn2+ in pharmaceutical solutions. PP
rep-resents peristaltic pump; I: injector-commutator, D: spectrophotometer (520 nm); C: Carrier (H2O: 1.2
mL min-1); R: Alizarin Red S solution (3.0x10⁻⁴ mol
L-1: 1.2 mL min-1); L: sample loop (250 µL); Y:
Preparation of pharmaceutical samples
Three Brazilian pharmaceutical formu-lations containing Zn(II) such as Moura Brasil®
(Aventis Pharma LTDA.), Lerin® (Allergan
Produ-tos Farmacêuticos LTDA) and Zincolok®(Allergan
Produtos Farmacêuticos Ltda) were analyzed
using a proposed low injection procedure. Eye
drops formulations were appropriately diluted with desionized water to obtain a concentration of
ca. 5.0 x 10⁻⁵ mol L-1 of Zn(II) in the diluted
solu-tion of samples. The results obtained by the
pro-posed low injection method were compared with
the results obtained by a spectrophotometric batch procedure described by Manouri et al. [8].
Results and discussion
The proposed low injection procedure for
the determination of Zn2+ was based on the
for-mation of complex with Alizarin red S in borate buffer (pH 9.0).
The optimization of chemical and low in -jection parameters were performed using a univa-riate method in order to achieve a best compromi-se between the peak height, sample throughput, reproducibility and baseline stability.
Chemical parameters
To establish the best conditions for the Zn(II) determination, some chemical parame-ters such as carrier solution and Alizarin Red S concentration were investigated. The optimized values studied and selected were showed in the Table 1.
Table 1. Optimized low injections and chemical parameters.
Parameter Studied range Selected value
Sample loop length /µL
ALZ concentration / mol L-1
ALZ low rate / mL min-1
Carrier low rate / mL min-1
pH buffer
Reactor coil length / cm
100 to 350
7.5 x 10⁻⁵ to 4.7 x 10⁻⁴
0.7 to 1.7
0.7 to 1.7
7.1 to 9.8
50 to 230
250
3.0 x 10⁻⁴
1.2
1.2
9.0
150
ALZ = Alizarin Red S.
Initially, the effect of the carrier solution on the analytical signal was studied using 0.01 mol L-1 buffer solutions (acetate and borate
ffers) in the pH range from 7.1 to 9.8. The bu-ffer solution that promoted the highest analytical signals was 0.01 mol L-1 borate buffer at pH 9.0.
Thus, the 1.6x10⁻² mol L-1 borate buffer at pH 9.0
was selected for further experiments.
The effect of Alizarin red S solution on the analytical signal was studied between 7.5x10⁻⁵
and 4.7x10⁻⁴ mol L-1 using a 1.6x10⁻² mol L-1
bora-te buffer (pH 9.0). The analytical signal increased with the increases of Alizarin red S concentration up to 4.7x10⁻⁴ mol L-1. The highest concentrations
of reagent promotes intense oscillation of baseline with severe increase of the washing time. The in-crease of washing time to highest concentrations was due the impregnation of Zn2+-Alizarin com-plex in the low cell. Thus, considering the best
compromise between height peaks and repeatabi-lity, the 3.0x10⁻⁴ mol L-1 Alizarin Red S solution
was selected for further experiments.
Flow injection parameters
To determine the optimum low procedure
parameters, the sample volume, carrier and
rea-gent low rate and reactor coil length were inves -tigated. The parameters range studied and selected are shown in Table 1. The effect of sample volume from 100 to 350 µL (50 to 70 cm) on the analyti-cal signal was evaluated by injection of 6.0 x 10⁻⁴
mol L-1 Zn2+ solution in 0.01 mol L-1 borate buffer
The effect of the Alizarin red S low rate
and the carrier low rate on the analytical sig -nal were studied from 0.7 to 1.7 mL min-1 each one. The low rates of 1.2 mL min-1 were
selec-ted to each channels because promotes the higher analytical signals.
The inluence of tubular coiled reactor
length on the absorbance was also evaluated in the range from 50 to 230 cm using a 4.0x10⁻⁵ mol
L-1 Zn2+ reference solution. The analytical signal
increased gradually with increase of length up to 230 cm. To the highest reactor lengths, the base-line was achieved slowly due the impregnation of
complex on the glass low cell. This impregnation
was not observed up to 150 cm reactor length. Thus, the 150 cm reactor coil length was chosen, taking account height of the analytical signal and analytical frequency.
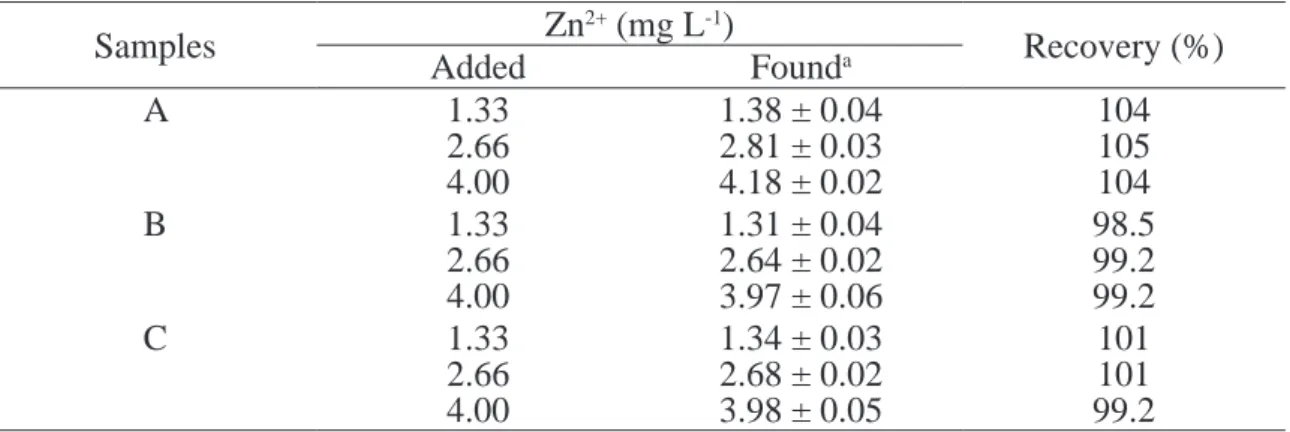
Recoveries and interferences studies
The recovery study was examined by adding Zn2+ reference solution at three levels (1.33, 2.66
and 4.00 mg L-1) to the samples solution
contai-ning ca. 2.0x10⁻⁵ mol L-1 Zn2+ concentration. The
results of Zn2+ determination obtained of theses
solutions were compared with the results of re-ference solutions without addition of the sample solutions. Recoveries from 96.3 to 105 % of Zn2+
from three pharmaceutical formulations were
ob-tained using the optimized low procedure. The
results are shown in the Table 2 and suggests no
signiicant matrix effect in the samples studied.
Table 2. Study of the recovery experiments
Samples
Zn
2+
(mg L
-1)
Recovery (%)
Added
Found
aA
1.33
2.66
4.00
1.38 ± 0.04
2.81 ± 0.03
4.18 ± 0.02
104
105
104
B
1.33
2.66
4.00
1.31 ± 0.04
2.64 ± 0.02
3.97 ± 0.06
98.5
99.2
99.2
C
1.33
2.66
4.00
1.34 ± 0.03
2.68 ± 0.02
3.98 ± 0.05
101
101
99.2
a n=3, mean ± standard deviation.The interference of some compounds com-monly founded in eye drop formulations was
studied with the proposed low procedure. Chlo -ride sodium, benzalkonium chlo-ride, citric acid, CuSO4 and EDTA were tested. In this study, ali-quots of solutions containing the interferences at three concentration levels were added to 5.0x10⁻⁵
mol L-1 Zn2+ reference solution. The results
obtai-ned in Zn2+ determination in theses solutions were
compared with those obtained of the reference solutions without interference added. The tole-rated concentration was that promote the signal variation of ±5 %. In these group of substances studied, only the benzalkonium chloride causes severe interference on the response of proposed procedure at same concentration that Zn(II) stan-dard solution. The cationic surfactant, such as benzalkonium chloride promotes a hyperchromic shift of the complex spectrum [27]. This benzalko-nium chloride concentration was not founded in the analyzed commercial formulations. To others substances, no interference was observed in the
response of low system procedure in the presen -ce of 10-fold ex-cess of these studied substan-ces. Cu2+ causes severe interference due the formation
of stable complex with Alizarin red S with con-siderable overlapping of the spectra of their of Zn(II)-Alizarin complex [24]. The use of thiosul-phate and thiourea as the masking reagent for Cu2+
do not eliminated the Cu2+ interference in the Zn2+
Analytical curve and applications
In the optimized conditions, the analytical curve was linear in the concentration range from 6.0x10⁻⁶ to 1.5x10⁻⁴ mol L-1 (Abs = 0.013 + 4
508.2 x C, r = 0,999; where Abs is the absorbance and C is the Zn2+ concentration in mol L-1). The
relative standard deviation (R.S.D.) for a solution containing 5.5x10⁻⁵ mol L-1 Zn2+ of 1.2% (n = 10)
and the detection limit of 3.60x10⁻⁶ mol L-1 were
obtained (three times blank standard deviation/ slope of analytical curve). The sampling rate of 60 h-1 was attained. The relative standard
devia-tion of 3.5% (n=6) for the slope of analytical cur-ve to Zn2+ determination was obtained at different
working days.
The proposed low procedure was applied
to determine Zn2+ in eye drops under conditions ixed and shown in the Table 1. The results ob -tained in the determination of Zn2+ employing the
proposed procedure are presented in Table 3. The
results obtained using the proposed low procedu -re a-re in good ag-reement with the -results obtained
by batch procedure [8] at 95% conidence level
(t-paired test) [28].
Table 3. Determination of Zn2+ in commercial formulations by using low procedure and comparative batch
procedure [29]
Samples
Zn
2+
(mg mL
-1)
Relative error (%)
Comparative
Proposed low procedure
A
B
C
0.069 ± 0.003
0.602 ± 0.003
0.126 ± 0.002
0.071 ± 0.001
0.585 ± 0.002
0.129 ± 0.001
2,9
-2.8
2.4
n=3, mean ± standard deviation; Re1, relative error between proposed low procedure vs. comparative
method. Sample composition: zinc sulphate or zinc phenolsulphonate, sodium borate, acid boric, potas-sium chloride, citric acid, disodium edetate dehydrated, Thimerosa
Conclusions
The low injection procedure proposed was
applied to the determination of Zn2+ contained in
eye drop solutions. The automatized procedure is simple, precise and has sensitive enough for the analysis of a variety of ophthalmic solutions with
high sample throughput. Thus, the developed low
injection procedure is very suitable for routine analytical applications.
Acknowledgements
The authors are gratefully acknowledged to
CNPq, CAPES and FAPESP by inancial support. Sistema de análise por injeção em luxo
com detecção espectrofotométrica para a determi-nação de Zn2+ em colírios empregando vermelho
de Alizarina S como reagente. Received August 04 2008
Resumo: Um método de análise por injeção em fluxo para determinação de Zn2+ em colírios foi
descrito. Neste trabalho, o íon Zn2+ foi complexado com vermelho de Alizarina S em tampão
borato (pH 9,0) e o cromóforo formado foi monitorado espectrofotometricamente em 520 nm. A curva analítica foi linear no intervalo de concentração de Zn2+ de 6,05 x 10⁻⁶ a 1,50 x 10⁻⁴ mol
L-1, com um limite de detecção de 3,60 x 10⁻⁶ mol L-1. As recuperações variaram de 96,3 a 105%
e o desvio padrão relativo foi de 1,2 % (n = 10) para uma solução padrão de Zn2+ de 5,5x10⁻⁵
mol L-1. A freqüência analítica de 60 h-1 foi obtida. Os resultados obtidos para determinação de
Zn2+ em colírios empregando-se o procedimento proposto estão em concordância com os
resul-tados obtidos empregando-se um procedimento comparativo a um nível de confiança de 95%.
Palavras-chave: Análise por injeção em luxo; zinco; vermelho de Alizarina S; espectrofotometria; colírio.
References
[1] C.P. Gonçalves, Oftalmologia, São Paulo, Livraria Athe-neu, 1979.
[2] J.J. Zeelie, T.J. McCarthy, Analyst 123 (1998) 503. [3] USP, United States Pharmacopeial XXII, Rockville, MD, U.S Pharmacopeial Convention, 1990.
[4] A. Bhalotra, B.K. Puri, Talanta 49 (1999) 485.
[5] Shrirama, V.N. Pathak, I.C. Shukla, Chem. Anal-Warsaw 25 (1980) 91.
[6] S. Zareba, Pharmaceutical Acta Helvetica 70 (1995) 195. [7] J. Karpinska, M. Kulikowska, J. Pharm. Biomed. Anal. 29 (2002) 153.
[8] O.C. Manouri, N.D. Papadimas, S.E. Salta, G.C. Ragos, M.A. Demertzis, P.B. Issopoulos, Farmaco 53 (1998) 563. [9] G. Gumus, H. Filik, B. Demirata, Anal. Chim. Acta 547 (2005) 138.
[10] J. Raba, C.A. Fontan, V.A. Cortinez, Talanta 41 (1994) 273.
[11] R. Fakhari, M. Shamsipur, K. Ghanbari, Anal. Chim. Acta 460 (2002) 177.
[12] M.B. Gholivand, Y. Mozaffari, Talanta 59 (2003) 399. [13] F. Lo-Coco, L. Ceccon, L. Ciraolo, V. Novelli, Food Control 14 (2003) 55.
[14] E. Muñoz, S. Palmero, Food Chemistry 94 (2006) 478. [15] M.F.d. Oliveira, A.A. Saczk, L.L. Okumura, N.R. Stra-diotto, Ecl. Quim. 27 (2002) 153.
[16] M.I. Albero, J.A. Ortuño, M.S. García, C. Sáchez-Pe-dreño, R. Expósito, J. Pharm. Biomed. Anal. 29 (2002) 779. [17] M.J. Ayora-Cañada, M.I. Pascual-Reguera, A. Molina-Díaz, Anal. Chim. Acta 375 (1998) 71.
[18] R. Liu, D. Liu, A. Sun, Talanta 40 (1993)
[19] L.S.G. Teixeira, F.R.P. Rocha, M. Korn, B.F. Reis, S.L.C. Ferreira, A.C.S. Costa, Talanta 51 (2000) 1027.
[20] S. Suteerapataranon, J. Jakmunee, Y. Vaneesorn, K. Gru-dpan, Talanta 58 (2002) 1235.
[21] L. Yuanqian, H. Jingmei, Y. Jingguo, Z. Bo, H. Yuan-qing, Anal. Chim. Acta 461 (2002) 181.
[22] M. Burguera-Pascu, A. Rodríguez-Archilla, J.L. Burgue-ra, M. BurgueBurgue-ra, C. Rondón, P. Carrero, Anal. Chim. Acta 600 (2007) 214.
[23] F.R.P. Rocha, P.B. Martelli, B.F. Reis, Anal. Chim. Acta 438 (2001) 11.
[24] K. Ueno, T. Imamura, L. Cheng, Handbook of Organic Analytical Reagents, 2, London, CRC Press, 1992.
[25] H. Bergamin-Filho, E.A.G. Zagatto, F.J. Krug, B.F. Reis, Anal. Chim. Acta 101 (1978) 17.
[26] J. Mendham, Vogel’s Quantitative Chemical Analysis, 6th Edition, New York, Longman,

![Table 3. Determination of Zn 2+ in commercial formulations by using low procedure and comparative batch procedure [29]](https://thumb-eu.123doks.com/thumbv2/123dok_br/18977451.455798/5.807.88.726.579.713/table-determination-commercial-formulations-using-procedure-comparative-procedure.webp)
