Discordance between Prevalent Vertebral
Fracture and Vertebral Strength Estimated by
the Finite Element Method Based on
Quantitative Computed Tomography in
Patients with Type 2 Diabetes Mellitus
Nobuaki Kiyohara☯, Masahiro Yamamoto
*☯, Toshitsugu Sugimoto☯
Internal Medicine 1, Shimane University Faculty of Medicine, Izumo, Shimane, Japan
☯These authors contributed equally to this work. *[email protected]
Abstract
Background
Bone fragility is increased in patients with type 2 diabetes mellitus (T2DM), but a useful method to estimate bone fragility in T2DM patients is lacking because bone mineral density alone is not sufficient to assess the risk of fracture. This study investigated the association between prevalent vertebral fractures (VFs) and the vertebral strength index estimated by the quantitative computed tomography-based nonlinear finite element method (QCT-based nonlinear FEM) using multi-detector computed tomography (MDCT) for clinical practice use.
Research Design and Methods
A cross-sectional observational study was conducted on 54 postmenopausal women and 92 men over 50 years of age, all of whom had T2DM. The vertebral strength index was com-pared in patients with and without VFs confirmed by spinal radiographs. A standard FEM procedure was performed with the application of known parameters for the bone material properties obtained from nondiabetic subjects.
Results
A total of 20 women (37.0%) and 39 men (42.4%) with VFs were identified. The vertebral strength index was significantly higher in the men than in the women (P<0.01). Multiple regression analysis demonstrated that the vertebral strength index was significantly and positively correlated with the spinal bone mineral density (BMD) and inversely associated with age in both genders. There were no significant differences in the parameters, including the vertebral strength index, between patients with and without VFs. Logistic regression OPEN ACCESS
Citation:Kiyohara N, Yamamoto M, Sugimoto T (2015) Discordance between Prevalent Vertebral Fracture and Vertebral Strength Estimated by the Finite Element Method Based on Quantitative Computed Tomography in Patients with Type 2 Diabetes Mellitus. PLoS ONE 10(12): e0144496. doi:10.1371/journal.pone.0144496
Editor:Deepak Vashishth, Rensselaer Polytechnic Institute, UNITED STATES
Received:July 19, 2015
Accepted:November 19, 2015
Published:December 7, 2015
Copyright:© 2015 Kiyohara et al. This is an open access article distributed under the terms of the
Creative Commons Attribution License, which permits unrestricted use, distribution, and reproduction in any medium, provided the original author and source are credited.
Data Availability Statement:All relevant data are within the paper.
analysis adjusted for age, spine BMD, BMI, HbA1c, and duration of T2DM did not indicate a significant relationship between the vertebral strength index and the presence of VFs.
Conclusion
The vertebral strength index calculated by QCT-based nonlinear FEM using material prop-erty parameters obtained from nondiabetic subjects, whose risk of fracture is lower than that of T2DM patients, was not significantly associated with bone fragility in patients with T2DM. This discordance may indirectly suggest that patients with T2DM have deteriorated bone material compared with nondiabetic subjects, a potential cause of bone fragility in T2DM patients.
Introduction
The association between diabetes mellitus and osteoporosis is a great concern for the elderly. Meta-analyses have demonstrated that patients with type 2 diabetes mellitus (T2DM) are at
increased risk of hip fracture compared with non-T2DM subjects [1,2]. The risk of vertebral
fractures (VFs) in T2DM patients is significantly elevated despite the elevated bone mineral
density (BMD) of T2DM patients compared with nondiabetic subjects [3]. Assessing the bone
fragility in patients with T2DM by BMD is difficult because BMD at any site such as the spine,
femoral neck and distal radius 1/3 are not significantly associated with the presence of VFs [3]
and because the fracture risk of T2DM patients is elevated compared with nondiabetic subjects
at any age and BMD T-score [4]. Bone strength is a composite of both BMD and bone quality
[5], and these findings suggest that the patients with T2DM might have poor bone quality that
is not apparent in the BMD measurements. Thus, tools are needed to assess comprehensively the bone fragility of T2DM patients, especially the bone quality which consists of material properties such as bone collagen as well as structural properties such as bone geometry and microarchitecture.
The finite element method (FEM) is a computational analytical tool for a complex system
such as the stress analysis of a structure.Ex vivostudies showed that quantitative computed
tomography-based FEM (QCT-based FEM) was superior to BMD and QCT alone for assessing
the bone strength of vertebrae [6–8]. In addition,in vivoQCT-based nonlinear FEM computed
by thin-slice imaging produced by multi-detector computed tomography (MDCT) for clinical
use had a higher diagnostic power for VFs than BMD in nondiabetic subjects [9,10]. These
advantages suggest that QCT-based FEM may be useful for T2DM patients to determine the
bone fragility, which is difficult to find by BMD, [3] because QCT-based FEM can estimate the
integrated the bone strength which consists of BMD and bone structure (one of component of bone quality); however, it is unknown whether the bone strength of T2DM patients can be esti-mated by QCT-based nonlinear FEM.
To clarify this issue, we investigated the relationship between the presence of VFs and the index of bone strength calculated by QCT-based nonlinear FEM in patients with T2DM.
Subjects and Methods
Subjects
This cross-sectional study was approved by the ethical review board of our institution the Shi-mane University Institutional Committee on Ethics (IRB No. 1648) and it complied with the
data collection and analysis, decision to publish, or preparation of the manuscript.
Helsinki Declaration. All of the subjects agreed to participate in the study and provided written informed consent. A total of 146 Japanese patients with T2DM were sequentially enrolled [54
postmenopausal women (age range 47–84 years) and 92 men (age range 51–88 years)]; these
patients had been referred to Shimane University Hospital from community clinics for the treatment of diabetes. All of these patients underwent BMD measurements for the diagnosis of osteoporosis and CT scans for screening to exclude malignant neoplasm-induced or functional adrenal tumor-induced diabetes under standard clinical conditions. Subjects who had higher
than normal serum creatinine levels (normal range for women, 0.44–0.83 mg/dl; for men,
0.56–1.23 mg/dl) were excluded from the study and were subjects with primary
hyperparathy-roidism, hyperthyhyperparathy-roidism, and rheumatoid arthritis to avoid metabolic bone disorders caused by secondary osteoporosis, or a history of falls or traffic accidents to eliminate the possibility of injury-associated fractures. None of the subjects received drugs or hormones that might affect their bone metabolism, including sex steroids, glucocorticoids, warfarin, bisphosphonates, teri-paratide, and denosumab.
Biochemical measurements
Blood samples from fasting patients were analyzed for hemoglobin A1c (HbA1c) and serum
creatinine (Cr) using automated techniques at our hospital’s central laboratory. Serum
bone-specific alkaline phosphatase (BAP) and urinary N-telopeptide (uNTX) were measured using
commercially available enzyme–linked immunosorbent assays (ELISAs).
BMD measurements
BMD values for the lumbar spine (L) and the femoral neck (FN) were measured by dual-energy X-ray absorptiometry (DXA) using a QDR-4500 system (Hologic, Waltham, MA). The values were expressed relative to the standard deviation (SD) of age- and sex-matched normal Japa-nese BMD values provided by the manufacturer (Z-score). The coefficients of variation for the measurements of L-BMD and FN-BMD were less than 1%.
Ascertainment of fractures
For all of the subjects, conventional thoracic and lumbar radiographs using lateral and
ante-rior-posterior projections were obtained. A VF was diagnosed according to a reduction of
20% as defined by the Genant visual criteria [11]; observations were made by two investigators
who were blinded to each other's readings. If the VF assessments were discordant between two independent investigators, then the film was separately reassessed. If the re-evaluated findings were discordant, then the case was regarded as a non-fracture.
Computed tomography scanning and QCT-based nonlinear FEM
The FEM procedure in this study was performed according to the protocol of the previous
study for nondiabetic subjects [9] in order to compare with the results from this population.
QCT data were embedded into an image that was diverted from scans performed by multi-detector computed tomography (the Aquilion 64, Toshiba Medical Systems Corporation, Ota-wara, Japan) with a calibration phantom equipped with hydroxyapatite rods in the standard condition for clinical practice as follows: a slice thickness of 2 mm, a pixel width of 0.35 mm, a tube voltage of 120 kVp, a tube current of 360 mA, and a 512 x 512 matrix. The FEM procedure
was performed as previously described [9]. A cylindrical region of interest (ROI) with a radius
3-dimensional FEM of the vertebral body without including the spinous process and inter-spinal disk was constructed with 2-mm tetrahedral elements and 2-mm triangular plates from
the CT image using Mechanical Finder software (Mitsubishi Space Software, Tokyo, Japan) [9,
12]. Young’s modulus and the thickness of each triangular plate on the outer surface of the
cor-tical shell were allocated values of 10 GPa and 0.4 mm, respectively. The mechanical properties of each element were calculated from the Hounsfield unit values. The ash density of each voxel was assigned using the linear regression equation created from the values of the calibration phantom. The ash density of each element was determined as the average ash density of the
voxels contained in one element. Poisson’s ratio of each element was set to 0.4. Young’s
modu-lus and the yield stress of each element were calculated from the equations proposed for
nondi-abetic subjects [13] according to a previous study [9].
Complete restraint to all nodes of the lower end of the vertebral model was applied as boundary conditions for the simulation of VF. The bone strength was calculated every 50 N under the condition of uniaxial and uniformly distributed compression to the upper site of the
vertebrae. Each element was considered to yield when its Drucker–Prager equivalent stress
reached the element yield stress. Failure was defined as the occurrence of the minimum princi-pal strain of the first element with less than -10,000 microstrains. The vertebral yield and VFs were determined by the occurrence of the yield and failure in at least one element. The fracture load was defined as the vertebral strength index.
Statistical analysis
All of the parameters are presented as the mean ± standard deviation for each group. The statisti-cal analyses were conducted using StatView (Abacus Concepts, Inc., Berkeley, CA, USA). The
statistical significance of the continuous variables was determined using the Mann-WhitneyU
test. Multiple regression analyses were performed with significant variables selected from a sim-ple regression analysis to determine the significant independent variables against the vertebral strength index. Multiple logistic regression analysis was performed after adjusting for the
vari-ables shown in the tvari-ables.P-values of less than 0.05 were considered to be significant.
Results
Baseline characteristics of the participants
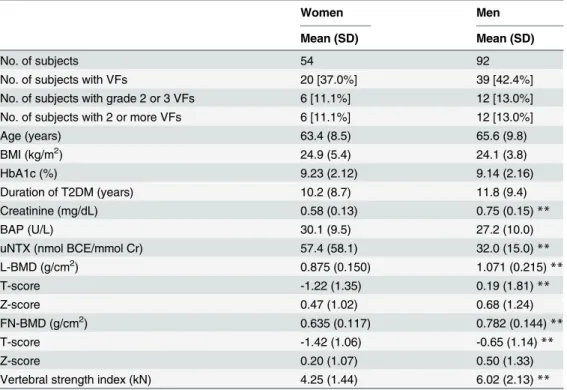
The background data are shown inTable 1. In total, 20 women (37.0%) and 39 men (42.4%)
had VFs. Six women (11.1%) and 12 men (13.0%) had grade 2 or 3 VFs and multiple prevalent VFs. There were no significant differences in the age, BMI, duration of T2DM, and serum levels of HbA1c and BAP between the men and women. The urinary levels of N-telopeptide (uNTX)
were significantly lower in the men than in the women (P<0.01). Serum creatinine levels,
BMD values, and T-scores were significantly higher in the men than in the women (P<0.01).
The vertebral strength index was significantly higher in the men than in the women (P<0.01).
Correlations of the vertebral strength index with clinical parameters
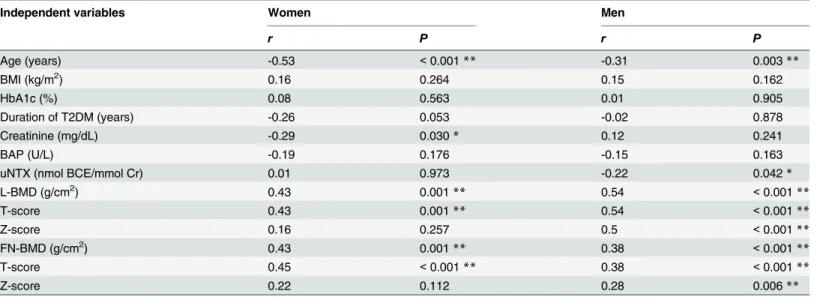
The factors that affect the vertebral strength index were investigated by a simple regression
analy-sis (Table 2). The vertebral strength index of both genders was significantly and inversely
determinant factors for the vertebral strength index in both women (r= -0.43,P<0.001;
r= 0.35,P= 0.003) and men (r= -0.36,P<0.001;r= 0.55,P<0.001) (Table 3).
Assessment of the VF risk between patients with and without VFs
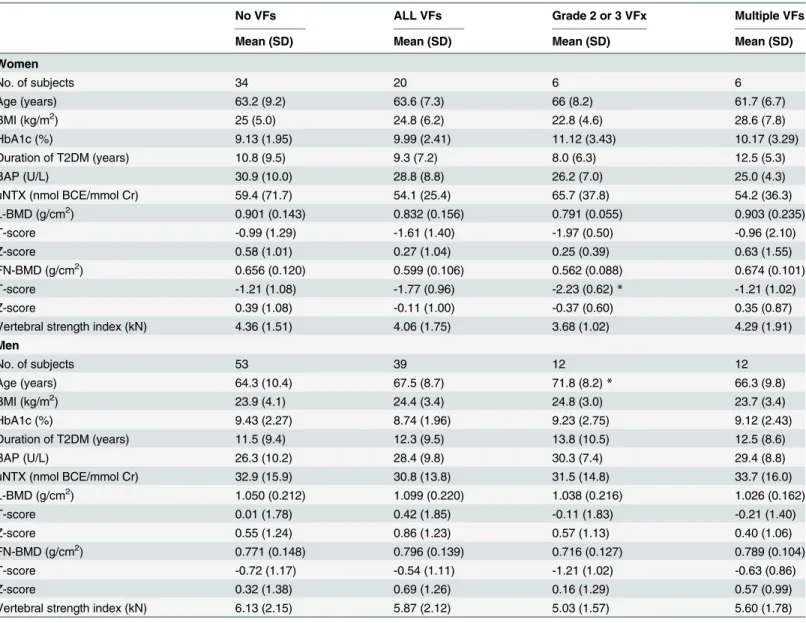
The clinical parameters of the group without VFs and the group with at least one VF did not
differ significantly, including the vertebral strength index (Table 4). Significant differences
between the group with more severe VFs, such as grade 2 or 3 VFs and multiple VFs, and with-out VFs were observed only in the female T-score of femoral neck and the male age in the
group with grade 2 or 3 VFs, which were significantly lower (P<0.05) and higher (P<0.05),
respectively, than those in the group without VFs.
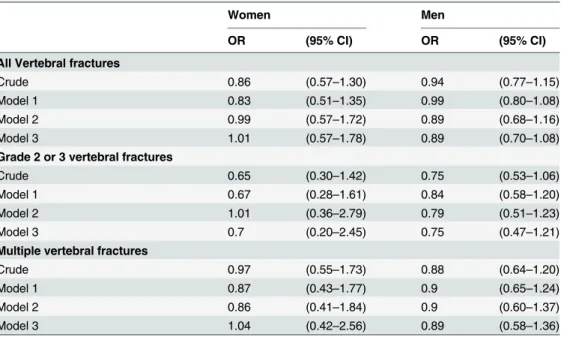
Next, the association between the presence of VFs and the vertebral strength index was
investigated (Table 5). Logistic regression analysis that adjusted for age (Model 1), L-BMD
(Model 2), BMI, HbA1c, and duration of T2DM (Model 3) did not reveal a significant relation-ship between any of the severities of the VFs defined by the grade or number and the vertebral strength index.
Discussion
In contrast to previous reports on the fracture risk in nondiabetic subjects, the vertebral strength index calculated by the QCT-based nonlinear FEM of patients with T2DM was not Table 1. Background data.
Women Men
Mean (SD) Mean (SD)
No. of subjects 54 92
No. of subjects with VFs 20 [37.0%] 39 [42.4%]
No. of subjects with grade 2 or 3 VFs 6 [11.1%] 12 [13.0%]
No. of subjects with 2 or more VFs 6 [11.1%] 12 [13.0%]
Age (years) 63.4 (8.5) 65.6 (9.8)
BMI (kg/m2) 24.9 (5.4) 24.1 (3.8)
HbA1c (%) 9.23 (2.12) 9.14 (2.16)
Duration of T2DM (years) 10.2 (8.7) 11.8 (9.4)
Creatinine (mg/dL) 0.58 (0.13) 0.75 (0.15)**
BAP (U/L) 30.1 (9.5) 27.2 (10.0)
uNTX (nmol BCE/mmol Cr) 57.4 (58.1) 32.0 (15.0)**
L-BMD (g/cm2) 0.875 (0.150) 1.071 (0.215)**
T-score -1.22 (1.35) 0.19 (1.81)**
Z-score 0.47 (1.02) 0.68 (1.24)
FN-BMD (g/cm2) 0.635 (0.117) 0.782 (0.144)**
T-score -1.42 (1.06) -0.65 (1.14)**
Z-score 0.20 (1.07) 0.50 (1.33)
Vertebral strength index (kN) 4.25 (1.44) 6.02 (2.13)**
**,P<0.01
The data are expressed as the mean±S.D. The values in parentheses represent the percentages. VFs, vertebral fractures; BMI, body mass index; T2DM, type 2 diabetes mellitus; BAP, bone-specific alkaline phosphatase; uNTX, urinary levels of N-telopeptide; BCE, Bone Collagen Equivalents; L, lumbar; FN, femoral neck; BMD, bone mineral density
associated with any prevalent VFs when utilizing material properties that were obtained from a
previous study in nondiabetic subjects [13] according to a standard protocol [9,12].
The estimation of the skeletal strength of the vertebrae by QCT-based nonlinear FEM is well established in non-diabetic subjects. This method could predict failure loads and fracture
patterns in cadaver studies [14] and assess the vertebral compressive strength better than BMD
or QCT alone inex vivostudies [6–8,15] because individual geometric and densitometric
inho-mogeneities such as bone shape, trabecular structure and mineralization obtained by MDCT can be embedded in FEM. The calculation of bone strength by FEM requires Young's modulus and Poisson's ratio, which are components of material properties; however, FEM using a
patient’s own material properties has not been achieved because the determination of the
mate-rial properties requires invasive procedures such as a bending strength test. According to a
published protocol [9,12], the values obtained from nondiabetic subjects [13] were used as the
bone material properties of T2DM patients in this study because no specific values are available Table 2. Simple regression analysis between the vertebral strength index and the independent variables.
Independent variables Women Men
r P r P
Age (years) -0.53 <0.001** -0.31 0.003**
BMI (kg/m2) 0.16 0.264 0.15 0.162
HbA1c (%) 0.08 0.563 0.01 0.905
Duration of T2DM (years) -0.26 0.053 -0.02 0.878
Creatinine (mg/dL) -0.29 0.030* 0.12 0.241
BAP (U/L) -0.19 0.176 -0.15 0.163
uNTX (nmol BCE/mmol Cr) 0.01 0.973 -0.22 0.042*
L-BMD (g/cm2) 0.43 0.001** 0.54 <0.001**
T-score 0.43 0.001** 0.54 <0.001**
Z-score 0.16 0.257 0.5 <0.001**
FN-BMD (g/cm2) 0.43 0.001** 0.38 <0.001**
T-score 0.45 <0.001** 0.38 <0.001**
Z-score 0.22 0.112 0.28 0.006**
*,P<0.01 **,P<0.01
T2DM, type 2 diabetes mellitus; VF, vertebral fracture; BMI, body mass index; BAP, bone-specific alkaline phosphatase; uNTX, urinary levels of N-telopeptide; L, lumbar; FN, femoral neck
doi:10.1371/journal.pone.0144496.t002
Table 3. Multiple regression analysis of the clinical parameters that affect the vertebral strength index.
Independent variables Women Men
r p r p
Age (year) -0.43 <0.001** -0.36 <0.001**
Creatinine (mg/dL) -0.18 0.125 0.06 0.543
uNTX (nmol BCE/mmol Cr) -0.01 0.995 -0.08 0.398
L-BMD (g/cm2) 0.35 0.003** 0.55 <0.001**
R2
= 0.44,P<0.01 R2
= 0.44,P<0.01
**,P<0.01
L, lumbar; BMD, bone mineral density; uNTX, urinary levels of N-telopeptide; BCE, Bone Collagen Equivalents;R2indicates coefficient of determination
for patients with T2DM. However, substituting these values may lead to false results. The increased bone content of pentosidine, an advanced glycation end-product, in spontaneous-onset diabetic rats and the elevated serum levels of pentosidine in patients with T2DM have
been associated with bone fragility independent of the bone mineral density [16,17], which
suggests that patients with T2DM have poor bone material properties compared with nondia-betic subjects. In addition, a recent study of the direct measurement of bone strength by micro-indentation revealed that the bone material strength of T2DM individuals was significantly
lower than that of the control subjects [18]. Considering these findings, the lack of association
Table 4. Comparison of various parameters between the group without vertebral fractures and each group with vertebral fractures by various definitions.
No VFs ALL VFs Grade 2 or 3 VFx Multiple VFs
Mean (SD) Mean (SD) Mean (SD) Mean (SD)
Women
No. of subjects 34 20 6 6
Age (years) 63.2 (9.2) 63.6 (7.3) 66 (8.2) 61.7 (6.7)
BMI (kg/m2) 25 (5.0) 24.8 (6.2) 22.8 (4.6) 28.6 (7.8)
HbA1c (%) 9.13 (1.95) 9.99 (2.41) 11.12 (3.43) 10.17 (3.29)
Duration of T2DM (years) 10.8 (9.5) 9.3 (7.2) 8.0 (6.3) 12.5 (5.3)
BAP (U/L) 30.9 (10.0) 28.8 (8.8) 26.2 (7.0) 25.0 (4.3)
uNTX (nmol BCE/mmol Cr) 59.4 (71.7) 54.1 (25.4) 65.7 (37.8) 54.2 (36.3)
L-BMD (g/cm2) 0.901 (0.143) 0.832 (0.156) 0.791 (0.055) 0.903 (0.235)
T-score -0.99 (1.29) -1.61 (1.40) -1.97 (0.50) -0.96 (2.10)
Z-score 0.58 (1.01) 0.27 (1.04) 0.25 (0.39) 0.63 (1.55)
FN-BMD (g/cm2) 0.656 (0.120) 0.599 (0.106) 0.562 (0.088) 0.674 (0.101)
T-score -1.21 (1.08) -1.77 (0.96) -2.23 (0.62)* -1.21 (1.02)
Z-score 0.39 (1.08) -0.11 (1.00) -0.37 (0.60) 0.35 (0.87)
Vertebral strength index (kN) 4.36 (1.51) 4.06 (1.75) 3.68 (1.02) 4.29 (1.91)
Men
No. of subjects 53 39 12 12
Age (years) 64.3 (10.4) 67.5 (8.7) 71.8 (8.2)* 66.3 (9.8)
BMI (kg/m2) 23.9 (4.1) 24.4 (3.4) 24.8 (3.0) 23.7 (3.4)
HbA1c (%) 9.43 (2.27) 8.74 (1.96) 9.23 (2.75) 9.12 (2.43)
Duration of T2DM (years) 11.5 (9.4) 12.3 (9.5) 13.8 (10.5) 12.5 (8.6)
BAP (U/L) 26.3 (10.2) 28.4 (9.8) 30.3 (7.4) 29.4 (8.8)
uNTX (nmol BCE/mmol Cr) 32.9 (15.9) 30.8 (13.8) 31.5 (14.8) 33.7 (16.0)
L-BMD (g/cm2) 1.050 (0.212) 1.099 (0.220) 1.038 (0.216) 1.026 (0.162)
T-score 0.01 (1.78) 0.42 (1.85) -0.11 (1.83) -0.21 (1.40)
Z-score 0.55 (1.24) 0.86 (1.23) 0.57 (1.13) 0.40 (1.06)
FN-BMD (g/cm2) 0.771 (0.148) 0.796 (0.139) 0.716 (0.127) 0.789 (0.104)
T-score -0.72 (1.17) -0.54 (1.11) -1.21 (1.02) -0.63 (0.86)
Z-score 0.32 (1.38) 0.69 (1.26) 0.16 (1.29) 0.57 (0.99)
Vertebral strength index (kN) 6.13 (2.15) 5.87 (2.12) 5.03 (1.57) 5.60 (1.78)
Mann-WhitneyUtest *P<0.05,vs. No VFs group
The data are expressed as mean±S.D.
BMD, bone mineral density; VFs, vertebral fractures; BMI, body mass index; T2DM, type 2 diabetes mellitus; BAP, bone-specific alkaline phosphatase; uNTX, urinary levels of N-telopeptide; BCE, Bone Collagen Equivalents; L, lumbar; FN, femoral neck
between bone strength estimated by QCT-based nonlinear FEM using nondiabetic material properties and actual bone fragility in T2DM patients indirectly suggests that patients with T2DM have deteriorated bone material properties compared with nondiabetic subjects, which may underlie the bone fragility in T2DM.
Insufficient statistical power may be responsible for the failure to observe a relationship between VFs and the vertebral strength index. This study confirmed the significant negative
association between age and the vertebral strength index observed in a previous study [9],
which indicates that the analytical procedure of QCT-based nonlinear FEM was performed consistently. Based on data from a previous study on the relationship between VFs and the
ver-tebral strength index in nondiabetic participants [9], statistical power analysis was performed
using the same values: the difference in the mean values of the vertebral strength index between subjects with and without VFs was 1 kN, and the standard deviation of the vertebral strength index was 0.80. Because patients with diabetes have an increased risk of fracture compared with nondiabetic subjects, the difference in the mean values of the vertebral strength index in the T2DM patients is expected to be the same or greater than that in nondiabetic subjects. Thus, using the values for nondiabetic subjects may lead to an underestimation of the fracture risk in diabetic patients. When the ratios of the number of patients with and without VFs were assumed to be 1 to 8, as in this study, with 80% power at a two-tailed alpha level of 0.05, the required minimum numbers of subjects for one group were 6 to 11, which implies that the present study was statistically appropriate to obtain conclusive results. However, no association was detected between VFs and the vertebral strength index, which suggests that the application Table 5. Associations between the presence of vertebral fractures by various definitions and the ver-tebral strength index.
Women Men
OR (95% CI) OR (95% CI)
All Vertebral fractures
Crude 0.86 (0.57–1.30) 0.94 (0.77–1.15)
Model 1 0.83 (0.51–1.35) 0.99 (0.80–1.08)
Model 2 0.99 (0.57–1.72) 0.89 (0.68–1.16)
Model 3 1.01 (0.57–1.78) 0.89 (0.70–1.08)
Grade 2 or 3 vertebral fractures
Crude 0.65 (0.30–1.42) 0.75 (0.53–1.06)
Model 1 0.67 (0.28–1.61) 0.84 (0.58–1.20)
Model 2 1.01 (0.36–2.79) 0.79 (0.51–1.23)
Model 3 0.7 (0.20–2.45) 0.75 (0.47–1.21)
Multiple vertebral fractures
Crude 0.97 (0.55–1.73) 0.88 (0.64–1.20)
Model 1 0.87 (0.43–1.77) 0.9 (0.65–1.24)
Model 2 0.86 (0.41–1.84) 0.9 (0.60–1.37)
Model 3 1.04 (0.42–2.56) 0.89 (0.58–1.36)
Odds ratios for vertebral fractures were presented as per 1 kN increase in the vertebral strength index Model 1: Adjusted for age.
Model 2: Model 1 additionally adjusted for L-BMD.
Model 3: Model 2 additionally adjusted BMI, HbA1c, and duration of T2DM
OR, odds ratio; CI, confidence interval; T2DM, type 2 diabetes mellitus; L, lumbar; BMD, bone mineral density
of QCT-based nonlinear FEM to evaluate the bone strength of patients with T2DM without modifying the standard protocol presents technical problems.
This study had several limitations. First, it was not population-based nor were all of the par-ticipants enrolled from identical populations; thus, a selection bias could have occurred. Fur-thermore, the sample size was not sufficiently large to enable us to make definitive conclusions. Second, the patients enrolled in this study were treated at Shimane University Hospital, which is a tertiary care center, and thus, they may exhibit more severe cases of T2DM; therefore, our patients might not be representative of the average Japanese patient with T2DM. Finally, this study did not confirm the association between VFs and the vertebral strength index of nondia-betic subjects as well as the difference in the vertebral strength index between participants with and without diabetes because it was important to avoid unnecessary X-ray exposure to nondia-betic subjects.
In conclusion, the present study demonstrated that the presence of VFs in T2DM patients was not significantly associated with the vertebral strength index calculated by QCT-based nonlinear FEM based on an established standard protocol when the parameters derived from nondiabetic subjects were applied to the bone material properties of diabetic patients. This finding suggests that the bone material properties of T2DM individuals could be deteriorated compared to nondiabetic subjects. QCT-based nonlinear FEM can assess the integrated bone strength, which consists of not only bone mineral density but also bone geometry. Therefore, further studies will be necessary to determine the adequate indexes of bone material properties for patients with T2DM and thereby assess the precise bone strength by QCT-based nonlinear FEM.
Author Contributions
Conceived and designed the experiments: MY. Performed the experiments: NK. Analyzed the data: NK MY. Contributed reagents/materials/analysis tools: MY TS. Wrote the paper: NK MY TS.
References
1. Vestergaard P. Discrepancies in bone mineral density and fracture risk in patients with type 1 and type 2 diabetes—a meta-analysis. Osteoporos Int. 2007; 18(4):427–44. PMID:17068657.
2. Janghorbani M, Van Dam RM, Willett WC, Hu FB. Systematic review of type 1 and type 2 diabetes mel-litus and risk of fracture. American journal of epidemiology. 2007; 166(5):495–505. PMID:17575306. 3. Yamamoto M, Yamaguchi T, Yamauchi M, Kaji H, Sugimoto T. Diabetic patients have an increased risk
of vertebral fractures independent of BMD or diabetic complications. J Bone Miner Res. 2009; 24 (4):702–9. Epub 2008/12/04. doi:10.1359/jbmr.081207PMID:19049338.
4. Schwartz AV, Vittinghoff E, Bauer DC, Hillier TA, Strotmeyer ES, Ensrud KE, et al. Association of BMD and FRAX score with risk of fracture in older adults with type 2 diabetes. Jama. 2011; 305(21):2184– 92. Epub 2011/06/03. doi:10.1001/jama.2011.715PMID:21632482; PubMed Central PMCID: PMC3287389.
5. Anonymous. Osteoporosis prevention, diagnosis, and therapy. JAMA. 2001; 285(6):785–95. PMID:
11176917.
6. Buckley JM, Loo K, Motherway J. Comparison of quantitative computed tomography-based measures in predicting vertebral compressive strength. Bone. 2007; 40(3):767–74. Epub 2006/12/19. doi:10.
1016/j.bone.2006.10.025PMID:17174619; PubMed Central PMCID: PMC2014723.
7. Crawford RP, Cann CE, Keaveny TM. Finite element models predict in vitro vertebral body compres-sive strength better than quantitative computed tomography. Bone. 2003; 33(4):744–50. Epub 2003/ 10/14. PMID:14555280.
9. Imai K, Ohnishi I, Matsumoto T, Yamamoto S, Nakamura K. Assessment of vertebral fracture risk and therapeutic effects of alendronate in postmenopausal women using a quantitative computed tomogra-phy-based nonlinear finite element method. Osteoporos Int. 2009; 20(5):801–10. Epub 2008/09/19. doi:10.1007/s00198-008-0750-8PMID:18800178.
10. Wang X, Sanyal A, Cawthon PM, Palermo L, Jekir M, Christensen J, et al. Prediction of new clinical ver-tebral fractures in elderly men using finite element analysis of CT scans. J Bone Miner Res. 2012; 27 (4):808–16. Epub 2011/12/23. doi:10.1002/jbmr.1539PMID:22190331; PubMed Central PMCID: PMC3510751.
11. Genant HK, Wu CY, van Kuijk C, Nevitt MC. Vertebral fracture assessment using a semiquantitative technique. J Bone Miner Res. 1993; 8(9):1137–48. PMID:8237484.
12. Imai K, Ohnishi I, Bessho M, Nakamura K. Nonlinear finite element model predicts vertebral bone strength and fracture site. Spine (Phila Pa 1976). 2006; 31(16):1789–94. Epub 2006/07/18. doi:10.
1097/01.brs.0000225993.57349.dfPMID:16845352.
13. Keyak JH, Rossi SA, Jones KA, Skinner HB. Prediction of femoral fracture load using automated finite element modeling. Journal of biomechanics. 1998; 31(2):125–33. Epub 1998/05/21. PMID:9593205. 14. Silva MJ, Keaveny TM, Hayes WC. Computed tomography-based finite element analysis predicts
fail-ure loads and fractfail-ure patterns for vertebral sections. J Orthop Res. 1998; 16(3):300–8. Epub 1998/07/ 22. doi:10.1002/jor.1100160305PMID:9671924.
15. Dall'Ara E, Pahr D, Varga P, Kainberger F, Zysset P. QCT-based finite element models predict human vertebral strength in vitro significantly better than simulated DEXA. Osteoporos Int. 2012; 23(2):563– 72. Epub 2011/02/24. doi:10.1007/s00198-011-1568-3PMID:21344244.
16. Saito M, Fujii K, Mori Y, Marumo K. Role of collagen enzymatic and glycation induced cross-links as a determinant of bone quality in spontaneously diabetic WBN/Kob rats. Osteoporos Int. 2006; 17 (10):1514–23. Epub 2006/06/14. doi:10.1007/s00198-006-0155-5PMID:16770520.
17. Yamamoto M, Yamaguchi T, Yamauchi M, Yano S, Sugimoto T. Serum pentosidine levels are posi-tively associated with the presence of vertebral fractures in postmenopausal women with type 2 diabe-tes. J Clin Endocrinol Metab. 2008; 93(3):1013–9. Epub 2007/12/28. doi:10.1210/jc.2007-1270PMID:
18160470.