THE ENVIRONMENTAL PROBLEMS
OF THE BALTIC SEA BASIN
The Baltic Sea is a unique ecological system, an integral part of the global eco-logical system, which is in urgent need of protection from destructive anthropogenic impact stemming from the production and consumption of nuclear energy and artifi-cial radionuclides, agriculture, oil and oil product transportation, and sewage and solid waste treatment. The article outlines the main environmental problems of the Baltic Seas and the ways to solve them.
Key words: Baltic Sea, ecology, eu-trophication, artificial radionuclides (235U, 239Pu, 240Pu, 134Cs, 137Cs, 90Sr,
3
H), heavy metals (Cu, Cd, Hg, Pb), oil.
Up to the present time geochemistry of the Baltic Sea and hydrological processes proceeding in its waters are well enough investigated [1]. The unique geographical position of the Baltic Sea, shallow waters, low salinity of its waters, and pretty complicated water exchange with the Northern Sea are the primary factors playing the major role in formation of natural biodi-versity of the Baltic Sea and therefore causing its extremely low ability to autopurification on the first hand and high sensitivity to anthropogenous influence on the other, whereas the average time of full renovation of water composes approximately 30—50 years [2]. Such a big values make it diffi-cult to carry out the natural self-cleaning processes which are going on in its brackish sea water rendering essential influence on ecological situation in the region. For the last 50 years the ecological situation in the Baltic Sea has considerably worsened, and according to the environmental forecasts if the present rate of water pollution were kept as the same as today for fur-ther 10 years, the Baltic Sea water probably might never be used for do-mestic purposes, whereas its unique marine fauna risks to disappear for-ever [3].
That is why environmental problems in the Baltic region including Rus-sia, Sweden, Finland, Estonia, Latvia, Lithuania, Poland, Germany and Denmark, the environmental problems have a paramount social, economic and socio-political meaning. These problems are affected by various anthro-pogenous factors and industrial-economic spheres of human activity, such as manufacture and consumption of atom energy, the industry, agriculture, transport, fishery, military uses, wastes, processing of sewage waters [4]. There have been lots of big industrial cities lying on the Baltic coast in
Oleg Mosin
THE MAIN ENVIRONMENTAL PROBLEMS OF THE BALTIC SEA AND THE WAYS
which people suffer from the waste pollution covering sea water, soil and air. According to the World Health Organization (WHO) the principal cause for anxiety is made up with high percent of allergic and oncology diseases detected in this region [5].
All this results in complex pollution of the Baltic Sea waters, distrac-tion of its biodiversity, and degradadistrac-tion of natural environment. The basic part of water pollution make up industrial-household waste products and waste products of agriculture, oil and oil products, artificial radionuclides from nuclear plant engineering (polonium 210Po, uranium 235U and 238U, plutonium 239Pu and 240Pu, strontium 90Sr, caesium 134Cs and 137Cs) and heavy metals (copper (Cu), cadmium (Cd), mercury (Hg), lead (Pb)) [6]. Thus, about 50% of total of heavy metals Cu, Cd, Hg, Pb enter into the Baltic Sea waters with an atmospheric precipitation, the basic part — through dumping in water area or through a river drain household and in-dustrial wastes [7]. All these factors leads to essential pollution of the Bal-tic Sea waters, destruction of marine ecological system and severe degra-dation of natural environment. This in turn, harms a variety of other indus-tries, including fishing and tourism [8]. Species of marketable fish such as herring, salmon and cod living in the Baltic Sea are strongly affected by pollution from urban areas, industries, and agriculture fertilizers. As a re-sult the contents of caesium (Cs), strontium (Sr), as well as heavy metals of Zinc (Zn), cadmium (Cd), lead (Pb) and mercury (Hg) in the herring and cod caught in the Baltic Sea far in 5 times exceed threshold limit values [9], while in zooplankton — 3 times [10].
The constant serious sourse of ecological danger of the Baltic Sea how-ever are waste products of military production and chemical weapons. Today the Baltic Sea is an underwater arsenal of various kinds of military weapons and wastes of different epochs. After the second world war into the Baltic Sea it were dropped down approximately 3 million tons of the chemical weapons contained 14 poisonous warfare agent substances of which highly toxic substances as the sulfur mustard gas (1,5-dichloro-3-thiapentane) and phosgene COCl2 are well known [11]. According to the present estimates
there are more than 50 potential dangerous dumps of toxic substances and radioactive wastes of cold war epoch in the Baltic Sea and its coastal area [12]. By an average estimation at the bottom of the Baltic Sea there are 267 thousand tons of bombs, shells and mines which were flooded down to the Baltic Sea waters after the ending of the Second world war. There are more than 50 thousand tons of fighting poison gases inside of them [13]. Be-cause of insufficient ability of autopurification of the Baltic Sea waters, dan-gerous poisonous substances from adjacent dumps and wastes are gradually leaking into the Baltic Sea. Thus, acording to military estimates the speed of water corrosion of ammunition makes up approximately 15—80 years, and artillery shells — 20—140 years [14].
to the degradation of the Baltic Sea is the destruction of its natural wet-lands, particularly in the western parts of its catchment area. Important ag-ricultural areas are located in Russia, Estonia, Latvia, Lithuania and Po-land, with the latter accounting for about 40 percent of arable land in the entire catchment area of the Baltic Sea region [15]. As a result of intensive agriculture, the amounts of nitrogen-phosphoric nutrients dumped into the water of the Baltic Sea have increased seven times during the last 50 years, having severe ecological effects on the ecosystem and living organisms. The nutrient input from agriculture includes ammonia (NH3), nitrogen
(ni-trates (NO3)- and organic nitrogen), and phosphorus in composition with
phosphates (PO4)3-, manure storage and silage heaps. Present estimates are
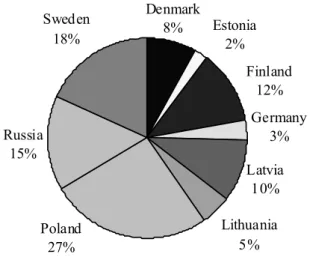
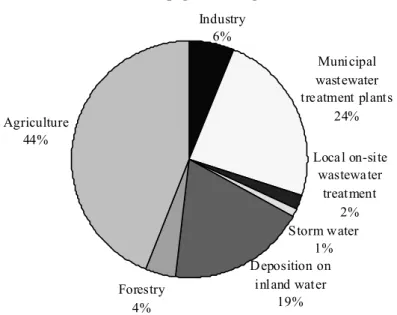
indicated that due to the result of fertilizers washout from arable lands and municipal sewage waters containing the waste products of agriculture and fishing annually into waters of the Baltic Sea enter 600 000 tons nitrogen and 25 000 tons phosphorus per year; while due to anthropogenous activity — 86000 tons of nitrogen and 2100 tons of phosphorus respectively (data for 2006) [16]. Somewhat over 50 percent of this amount comes from agri-cultural runoff from the areas bordering the eastern and southeastern Baltic coast (from St. Petersburg region to Schleswig-Holstein region). 40% of nitrogen supply comes directly from the atmosphere and through nitrogen-fixation, a natural process caused by some plankton algae, while only 10% of the phosphorus supply derives from the atmosphere [17]. Nitrogen and phosphorus discharges to the Baltic Sea and its distribution on various hu-man activities in 2006 are shown in Figure 1 and Figure 2 respectively. Thus on a share of Poland is 27% and 39% from the general emission of nitrogen and phosphorus, Russia — 15% and 11%, Sweden — 18% and 13%, Finland — 12 and 13%, Latvia — 10% and 10%, Lithuania — 5% and 5%, Germany — 3% and 2%, and Estonia — 2% and 2% of nitrogen and phosphorus (fig. 1). The greatest amounts of phosphorus and nitrogen come from the agriculture (delivers 44% of nitrogen and 45% of phospho-rus), municipal wastewater treatment plants (24% of nitrogen and 20% of phosphorus), and the industry (6% of nitrogen and 17% of phosphorus). The forestry gives 4% of nitrogen and 1% of phosphorus, storm waters — 1% of nitrogen and 5% of phosphorus whereas with internal inland waters it enters up 19% of nitrogen (fig. 2).
Estonia 2%
Finland 12%
Germany 3%
Latvia 10%
Lithuania 5% Russia
15%
Sweden 18%
Poland 27%
Denmark 8%
Nitrogen discharges to the Baltic Sea in 2006
Estonia 2%
Finland 13%
Germany 2%
Latvia 10%
Lithuania 5%
Poland 39% Russia
11%
Sweden 13%
Denmark 5%
Phosphorus discharges to the Baltic Sea in 2006
Fig. 1. Nitrogen (top diagram) and phosphorus (bottom diagram) discharges to the Baltic Sea in 2006, from both anthropogenic sources and natural
background loads (source: Helsinki Commission [16])
It is believed that the one third part of a bottom of the Baltic Sea suffers from serious lack of oxygen [19]. Shortage of oxygen, in its turn, limits growth and development of living organisms at the Sea bottom, which, even-tually, destroys food for zooplankton and fish [20]. As the result of this, bio-genic organic substances are not completely utilized and therefore may de-cay at deficiency of oxygen in water, allocating into the environment perni-cious for sea inhabitants hydrogen sulphide (H2S) [21]. Now the
concentra-tion of H2S in hydrosulphuric zones at the bottom of the largest hollows of
Municipal wastewater tre atment plants
24%
Forestry 4% Agriculture
44%
D eposition on inland water
19%
Storm w ater 1%
Loca l on-site wastewa ter
treatment 2% Industry
6%
Anthropogenic nitrogen, 2006
Industry 17%
Municipal wastewater
treatment plants
20%
Local on site wastewater
treatment 12% Forestry
1% Agriculture
45%
Storm water 5%
Anthropogenic phosphorus, 2006
Fig. 2. Nitrogen (top diagram) and phosphorus discharges (bottom diagram) to the Baltic Sea in 2006 from human activities
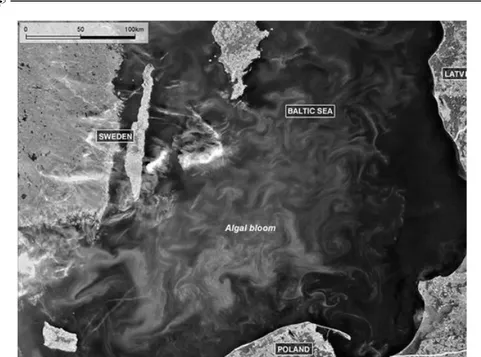
Fig.3. Blue-green algae blooms in the Baltic Sea as it is shown from airspace (according to the data of European Space Agency, 29 July 2005)
un-derwater gas lines in the world on which to Europe in 2025 it will be im-ported 80% of natural gas from the Southern Russian oil and gas deposit Yuzhno-Russkoye field located in Yamal-Nenets autonomous region. How-ever, the project, is seen as controversial for various reasons, including po-tential environmental damage to ecology of the Baltic Sea [25].
Other harmful organic substances detected in Baltic Sea waters are DDT, chlorinated terpenes, halogenated paraffins, polyaromatic hydrocarbons and chlorinated pesticides, such as chlordane and dieldrine [26]. These sub-stances are highly toxic and some are also bioaccumulating. The ban on the use of mercury compounds, in particular in the paper industry, and a drastic reduction of mercury discharges from the chlorine-alkali industry, have re-sulted in some decrease of mercury concentrations in fish, but many coastal water areas are still seriously contaminated.
The unfavourable ecological situation in the Baltic Sea area is also seri-ously aggravated by the presence and functioning of several powerful nu-clear reactor plants on the Baltic coast on territory of Russia, Sweden, Ger-many, Finland, Ukraine and Belarus. The production of electric power by nuclear power stations and capacity of nuclear reactors of the countries in the Baltic region in 1990—2010 are shown in Table 1 and Table 2 respec-tively. From these data it is shown, that on a share of Germany and Russia it is 30,3% and 13,1% from the general energy production in the Baltic region whereas capacities of working reactors will have been increased in 2010.
Table 1
The production of electric power by nuclear power stations of the countries in the Baltic region in 2000 [27]
Western Europe
Production, tWt-hour
% from general production
Eastern Europe
Production, tWt-hour
% from general production
Sweden 71,4 52,4 Lithonia 12,7 83,4
Germany 152,8 30,3 Ukraine 79,6 43,8
Finland 18,7 28,1 Russia 108,8 13,1
Table 2
Capacities of nuclear reactors of the countries in the Baltic region in 1990—2010, mWt (a source: the Bulletin on an atomic energy [28])
Country 2000 2005 2010
Belarus 0 0 900
Germany 21320 21320 20980
Lithonia 2500 1250 0
Russia 19840 24540 28190
Ukraine 12150 15040 16940
Finland 2540 2650 4150
Sweden 9440 8840 8840
According to the data of HELCOM, along the contiguous coastal line of the Baltic Sea there are placed 6 acting nuclear power plants: 3 Swedish power plants (Forsmark on the east coast of Uppland, Oskarsham at the Kalmar Strait, and Ringhals on Varo Peninsula, 2 Finish power plants (Loviisa on the Southern coast of Finland and Fennovoima Olkiluoto Nuclear Power Plant on the shore of the Gulf of Bothnia), and 1 Russian nuclear powerful plant in the Gulf of Finland — the Leningrad nuclear power plant [29]. In February 2010 Russia started the construction of Baltic nuclear power plant (also ref-ered to as Kaliningrad nuclear power plant) in 13 kilometers south-east of Neman, in Kaliningrad Oblast. The atomic power station will be consisted of two power units with general capacity of 2,3 GWt. It is planned, that after its construction the Kaliningrad area from energy deficiency region will turn in a big exporter of the electric power. Russia also has future disputable plans to rebuild Karelskaja powerful plant situated at Suojärvi in Karelia.
Normal authorized discharges from nuclear power plants can only be de-tected locally in very small amounts (Denmark, Estonia, Latvia, Norway, and Poland have no nuclear power plants). In areas of atomic power plant ar-rangement there are additionally situated storage facilities and depositories for radioactive elements. There are several wastes of spent radioactive nuclear fuel disposals and depositories on the territory of the Russian Federation, Sweden at Forsmark, in northeastern Estonia, in Latvia at the Daugava river, in Lithuania at the defunct in 2009 Ignalina nuclear power plant. Some local soil and water con-tamination in the region derived from uranium ore (235U and 238U) processing, plutonium 239Pu and 240Pu, strontium 90Sr, caesium 134 s and 137Cs, nuclear plant engineering as well as products of collateral disintegration of nuclear fuel, in-cluding tritium (3 ), which is formed as a fission product of nucleus of uranium
235U fission (on 1 GWt of capacities in a reactor it is formed 1,15 1011 Bq/day of
tritium, TLV for tritium 3H is 1,9·10—8 mg/m3) [30]. Tritium is also produced in heavy water-moderated reactors when a deuterium nuckleus captures a neu-tron. In water 2 tends to bind to hydroxyl-radicals (OH-) to form tritiated water (H3HO), and it can easily be ingested by drinking. Tritium can get into environ-ment with gaseous or liquid waste products as it is directly on nuclear power plants, and at the further processing the irradiated nuclear fuel as well. Accord-ing to the data on quantitative estimation of tritium input into atmosphere and hydrosphere with gaseous and liquid waste products of nuclear power plants, pressurized water reactors (PWR) generate into atmosphere 7,4—33, in hydro-sphere 33 GBq/MWt (electricity)/year of tritium; graphite moderated high pow-er channel-type reactors (RBMK) — 22 and 1,5 GBq/MWt (electricity)/year of tritium [31]. Higher levels of emissions of tritium are observed on nuclear power plants using heavy water reactors [32]. For example in Lithuania, tritium (3H) concentrations in groundwater in the region of the radioactive depository of the defunct Ignalina nuclear power plant are from 1000 to 10 000 times higher than the background values [33]. And practically the same situation is with deuterium (2H) in composition of fulfilled heavy water (2H2O) after nuclear plants. Today,
in-volving heavy water is altered substantially from ordinary water, as is the strength of deuterium bonds it forms, which affects cellular processes and me-tabolism [36]. That is why further production, distribution and using of heavy water in power nuclear engineering should be put under strictly international moniroring and controle.
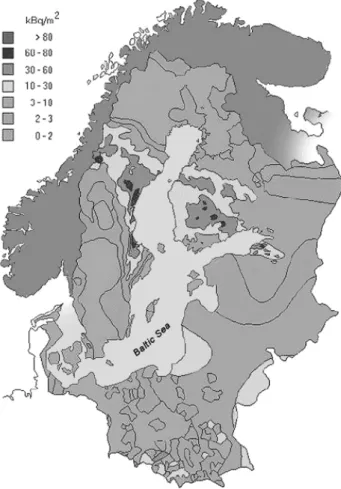
It should be noted, however, that the major source of radionuclide con-tamination of the Baltic Sea was the fallout after the catastrophe at the Cher-nobyl atomic power station in April, 1986, when the set of radioactive ele-ments and products of its disintegration of radioactive isotopes of strontium
90
Sr and caesium 134 s and 137Cs [37] was allocated into an atmosphere which concentration having been increased tens times above the norm (fig. 4). So, in Sweden the density of distribution of 137 s reached 60—80 kBq/m2, in Finland — 30—60 кBq/m2. There were found sites with 137 s contents up to 80—90 кBq/m2 in Greece, Romania, Switzerland, Austria and Germany with the average density of distribution of fallout in Europe being changed from 20 (Portugal) up to 90 кBq/m2 (Austria).
Fig. 4. The density of distribution of Chernobyl fallout after the failure at the Chernobyl atomic power station in April, 1986 (according to the data
The Gulf of Finland was among the most contaminated regions in the Bal-tic Sea. The dynamics of accumulation of isotopes of 90Sr, 134 s and 137Cs in waters of the Gulf of Finland for the period of 1970—2007 (fig. 5) was inves-tigated by experts from the Finnish Centre for Radiation and Nuclear Safety [38]. Thus, the contents of 137 s in the Baltic Sea were drastically increased in 1986 more than ten times with one of the most polluted area being the central part of gulf of Finland (fig. 5). There in June, 1986 the average level of con-tents of 137Cs was increased in 60 times in comparison with 1985, but by 1991 it was decreased half due to powerful drains of the Neva river and processes of sedimentation of radionuclides and their further washing out outside of the border of contaminated region [39]. The further measurements of radioactivity shown the stable tendency of reduction in concentration of radioactive cae-sium 137Cs in east part of Finland Gulf due to the inflow of relatively clean waters of the Neva river. Alongside with 90Sr, 134 s and 137Cs in southern re-gions of the Baltic Sea there were also detected concentrations of isotopes of iron 55Fe, 63Ni, polonium 210Po, uranium 235U and plutonium 239Pu and 240Pu which are bioaccumulated by marine species [40]. The last fact testifies to a wide spectrum of radioactive pollution in this region.
Fig. 5. The dynamics of distribution of isotopes of 90Sr, 134Cs and 137Cs in the waters of Gulf of Finland and Koporye Bay in period of 1970—2007
(according to the data of Finnish Centre for Radiation and Nuclear Safety [38])
be received due to influence artificial radionuclides, is estimated to be 2600 people-Sv. About 66% of this doze are caused by Chernobyl fallouts, 25% — global fallouts, 8% — influence of the European factories on pro-cessing of waste products of nuclear plants, and only 0,04% fall at a share of the nuclear objects placed in the Baltic Sea region. At the same time the col-lective doze caused by a natural radio-activity of seafoods, designed on the same period, is ten times higher — about 20 thousand people-Sv [41]. These alarming data require realization of special aims directed towards further improvement of ecological situation in the Baltic region.
The most significant stage for the protection of the Baltic Sea is the Bal-tic Sea joint comprehensive environmental program created in 1992 at par-ticipation of Russia and the countries of the Baltic region of the Helsinki Commission (The Helsinki Commission, HELCOM), which is directed to-wards the development and investment of complex international reforms, institutional strengthening and human resource development, supporting ap-plied research to build up the knowledge base needed to develop solutions, transfer technology, and broaden understanding of critical environmental problems and environmental research and education among the public [42].
Russia also carries out bilaterial cooperation both at international and in-tergovernmental levels. There have been operated more than 20 agreements, including agreements with Austria, Spain, Netherlands, Romania, Japan have been signed. Development of the international cooperation of Russia with countries of the Baltic region is directed on improvement of ecological condi-tions in the Baltic Sea basin and frontier regions of Finland, Republic Karelia and Russia, carrying out a joint teamwork in the international reserves and na-tional parks. Within the framework of the intergovernmental agreement it has been developed wide international cooperation of Russia with the Baltic coun-tries for protection of the sea environment, in particular to carry out the inter-national monitoring of radioactive pollution of the Baltic Sea.
Several joint measures furthermore have been taken by the Baltic coun-tries in order to reduce the use and entrance of hazardous substances into the Baltic Sea such as oil and oil products, cadmium (Cd) and mercury (Hg) [43]. It is also planned to reduce of nitrogen and phosphorus contents in brackish Baltic Sea water in 2020. The result of this is that in some polluted areas of the Baltic Sea in 2005 there was found a class of annelid marine worms known as polychaetes Marenzelleria neglecta, Monoporeia affinis Lindström, and Hediste diversicolor, which are capable to perform enzy-matic sulphide oxidation in the mitochondria at concentrations up to 50 mi-croM [44]. Their discovery in the Baltic Sea water has became a good news for ecologists because it means that the lifeless polluted Baltic Sea waters start to gradually come to life. Worms have migrated to the Baltic Sea from the Atlantic ocean, and there is a good news now that they also have been detected in the Finland gulf.
necessary amounts of food for fishes and other marine inhabitants. There is a good positive indicator allowing us to hope that the bad ecological situation in the Baltic Sea might be changed for the better in the near future.
References
1. Emelyanov, E.M. 1995.Baltic Sea: geology, geochemistry, paleoceanogra-phy, pollution. P.P. Shirshov Institute of Oceanology RAS, Atlantic Branch. Kalin-ingrad: Yantarny Skaz, p. 120.
2. Lass, H. U., Matthäus, W. 2008. General oceanography of the Baltic Sea. In: Feistel R., Nausch G., Wasmund N. (Ed.). State and evolution of the Baltic Sea 1952—2005. Hoboken, N.J.: John Wiley & Sons, Inc, pp. 5—44.
3. Ducrotoy, J. P, Elliott, M. 2008. The science and management of the North Sea and the Baltic Sea: Natural history, present threats and future challenges. Mar Pollut Bull. Vol. 57, pp. 8—21.
4. Pawlak, J. 1980. Land-based inputs of some major pollutants to the Baltic Sea. Ambio Special issue on the Baltic, pp. 163—167.
5. Herrmann, J. 1998. Levels of radioactivity. In: The Radiological Exposure of the Population of the European Community to Radioactivity in the Baltic Sea. Ma-ria-Balt Project, 2d S. P. Nielsen. Proceedings of a Seminar held at Hasseludden Conference Centre, Stockholm, 9—11 June 1998, pp. 77—129.
6. Brugmann, L. 1981. Heavy metals in the Baltic Sea. In The State of the Bal-tic, Ed. By G. Kullenberg, Mar. Pollut. Bull. Vol. 12 (6), pp. 214—218.
7. HELCOM (2004). Baltic Sea Environmental Proceedings. 2004. N 108. Heavy Metal Pollution to the Baltic Sea in 2004. Helsinki Commission. Baltic Ma-rine Environmental Protection Commission. №108, pp. 33.
8. Ojaveer, H., MacKenzie, B. R. 2007. Historical development of fisheries in northern Europe-Reconstructuring chronology of interaction between nature and man. Fish Res. Vol. 87, pp. 102—105.
9. Perttila, M., Tervo, V., Parmanne, R. 1982. Marine Pollution Bulletin, Vol. 13, Issue 11, pp. 391—393.
10.Brugmann, L., Hennings, U. 1994. Chemistry and Ecology, Vol. 9, Issue 2, pp. 87—103.
11. Donskov N. 2002. The Baltic Sea — the Sea of death. Novaja Gazeta.18 April 2002. №28.
12. Long-Lived Radionuclides in the Seabed of the Baltic Sea. Report of the Sediment Baseline Study of HELCOM MORS-PRO in 2000—2005. Baltic Sea En-vironment Proc.: Publ. HELCOM. 2006. N 110.
13. Sorokoletov, S. The Baltic Sea is in danger. Ecology and Life. 09.02.2009. 14. Kalinin, V. A. 2006. Chemical weapons and ecology of the Baltic Sea. Bulle-tin of Russian State University named after I. Kant. №6.
15. Schiewer, U. 2008. Ecology of Baltic Coastal Waters. Berlin. Heidelberg: Springer-Verlag, p.428.
16. HELCOM (2006). Proportion of sourses contributing to water bourne nitro-gen and phosphorus input into the Baltic Sea. №102. HELCOM, p. 56.
17. Environmental Protection Agency. 2006. Report 5815.
18. Bianchi, T.S., Westman, P., Andren T., Rolff C. and Elmgre R. 2000. Cyano-bacterial blooms in the Baltic Sea: natural or human induced? Limnol. Oceanogr. Vol. 45, pp. 716—726.
20. Flinkman, J., Aro, E., Vuorinen, I., Viitasalo, M. 1998. Changes in northern Baltic zooplankton and herring nutrition from 1980s to 1990s: top-down and bot-tom-up processes at work. Mar. Ecol. Prog. Ser. Vol. 165. pp. 127—136.
21. Bonsdorff, E., Blomqvist, E., Mattila J. and Norkko A. 1997. Estuar. Coastal Shelf Sci. Vol. 44, pp. 63—72.
22. Rheinheimer, G. 1998. Naturwissenschaften. Vol. 85(7), pp. 318—329. 23. WWF (1995). Special issue on oil in the Baltic Sea. World Wide Fund for Nature. Baltic Bull. 2—3.
24. Victorov, S. V., Korovin, L. K., Ustinov, B. P. 2006. State and Transport,
№6.
25. Ecological safety of “North Stream” project. Oil and Gas Eurasia, June 2009, №6.
26. Wuff, F., Rahn, L., Jonsson, P., Brydsten, L., Ahl, T., Granmo, A. 1993. A mass balance model of chlorinated organic matter for the Baltic Sea — a chal-lenge to ecotoxicology. Ambio. V. 22, pp. 27—31.
27. Kryshev, I. I., Ryazantsev, E. P. 2000. Ecological safety of nuclear energy complex of Russia. Moscow, p. 384.
28. Bulletin on atomic energy. Atominform. Moscow. May-June 2008, pp. 20—44. 29. Radioactivity of the Baltic Sea, 1999—2006. 2009. HELCOM Thematic As-sessment. Baltic Sea Environment Proc.: Publ. HELCOM. N 117.
30. Andreev, B. M.., Zelvensky, Y. D., Katalnikov, S. G. 1987. Heavy isotopes of hydrogen in atom technique. Moscow.
31. Wilson, P.D. 1996. The Nuclear Fuel Cycle. Oxford University Press, pp. 1—17. 32. Sinha, R.K.& Kakodkar A. 2003. INS News. Vol 16, p. 15.
33. Ignalina Nuclear Power Plant (6 June 2009).NNP preventive maintenance. Press release. Retrieved 31 December 2009.
34. Maloney, J. O. 1955. Production of Heavy Water. McGraw-Hill. New York. 35. Shatenshtain, A. I. 1957. Isotopic Analysis of Water. 2 Ed. Moscow. 36. Mosin, O. V., Skladnev, D. A., Shvets, V. I. 1999. Biosynthesis of 2 -labeled inosine by the bacterium Bacillus subtilis in heavy water medium. Bulletin of Rus-sian Academy of Sciences. Biology series. №4, pp. 403—413.
37. Agapov, A. M., Tishkov, V. P., Stepanov, A. B., Stovbur, V. I. 2008. The Safety of environmental. Radiation Monitoring, №2.
38. Finnish Centre for Radiation and Nuclear Safety. Evaluation of population doses in the vicinity of a nuclear power plant. 23 Jan. 1997 (in Finnish).
39. Stepanov, A. V., Tishkov, V. P., Panteleev, J. A., Gavrilov, V. N. 2009. Ra-dioactive pollution after failure on Chernobyl atom power station. Works of radium institute named after V. G. Hloponina. . XIV, pp. 154—162.
40. Skwarzec, B., Struminska, D. I., Boryto, A. 2006.Nukleonika, Vol. 51, pp. 45—51. 41. Radioactivity in the Baltic Sea 2000—2005. 2008. Baltic Sea Environment Proc.: Publ. HELCOM N 85.
42. The Baltic Sea Joint Comprehensive Environmental Action Programme. 1993. HELCOM. Helsinki. (Balt. Sea Environ. Proc. No. 48), pp. 2—1; 3—20.
43. HELCOM (2007). 2007. Baltic Sea Action Plan. Helsinki: HELCOM, p. 10. 44. Bastrop, R., Blank, M. 2005.Biological Invasions. Vol. 8. N. 5, pp. 1195— 1200.
About author
Dr Oleg Mosin, Research fellow, Moscow State Academy of Fine Chemical Technology.