TCD
9, 2201–2230, 2015Precipitation measurement intercomparison in the Qilian Mountains
R. Chen et al.
Title Page
Abstract Introduction
Conclusions References
Tables Figures
◭ ◮
◭ ◮
Back Close
Full Screen / Esc
Printer-friendly Version Interactive Discussion
Discussion
P
a
per
|
Discussion
P
a
per
|
Discussion
P
a
per
|
Discussion
P
a
per
|
The Cryosphere Discuss., 9, 2201–2230, 2015 www.the-cryosphere-discuss.net/9/2201/2015/ doi:10.5194/tcd-9-2201-2015
© Author(s) 2015. CC Attribution 3.0 License.
This discussion paper is/has been under review for the journal The Cryosphere (TC). Please refer to the corresponding final paper in TC if available.
Precipitation measurement
intercomparison in the Qilian Mountains,
Northeastern Tibetan Plateau
R. Chen, J. Liu, E. Kang, Y. Yang, C. Han, Z. Liu, Y. Song, W. Qing, and P. Zhu
Qilian Alpine Ecology and Hydrology Research Station, Key Laboratory of Inland River Ecohydrology, Cold and Arid Regions Environmental and Engineering Research Institute, Chinese Academy of Sciences, Lanzhou, 730000, China
Received: 7 March 2015 – Accepted: 16 March 2015 – Published: 31 March 2015
Correspondence to: R. Chen (crs2008@lzb.ac.cn)
TCD
9, 2201–2230, 2015Precipitation measurement intercomparison in the Qilian Mountains
R. Chen et al.
Title Page
Abstract Introduction
Conclusions References
Tables Figures
◭ ◮
◭ ◮
Back Close
Full Screen / Esc
Printer-friendly Version Interactive Discussion
Discussion
P
a
per
|
Discussion
P
a
per
|
Discussion
P
a
per
|
Discussion
P
a
per
|
Abstract
Systematic errors in gauge-measured precipitation are well-known but no reports have come from the Tibet Plateau. An intercomparison experiment was carried out from September 2010 to September 2014 in the Hulu watershed, northeastern Ti-bet Plateau. Precipitation gauges included a Chinese standard precipitation gauge 5
(CSPG), a CSPG with Alter shelter (Alter), a Pit type gauge with the CSPG (Pit) and a Double-Fence International Reference with Tretyakov shelter and CSPG (DFIR). The intercomparison experiments show that the Pit gauge caught 1 % more rainfall, 2 % more mixed precipitation, 4 % less snowfall and 0.8 % more precipitation (all types) than the DFIR from September 2012 to September 2014. The Pit caught 4 % more 10
rainfall, 21 % more snow and 16 % more mixed precipitation than the CSPG. The DFIR caught 3 % more rainfall, 27 % more snowfall, and 13 % more mixed precipitation than the CSPG, respectively. For rain and mixed precipitation, the catch ratios (CRs) for the gauges are ranked as follows: CRPit>CRDFIR>CRAlter>CRCSPG. For
snow-fall, the CRs are ranked as follows: CRDFIR>CRPit>CRAlter>CRCSPG. Catch ratio vs.
15
10 m wind speed indicates that with increasing wind speed from 0 to 4.5 m s−1, the
CRCSPG or CRAlter decreased slightly. For mixed precipitation, the ratios of DFIR/Alter
or DFIR/Pit vs. wind speed show that wind speed has no significant effect on catch ra-tio below 3.5 m s−1. For snowfall, the ratio of CSPG/DFIR or Alter/DFIR vs. wind speed
shows that catch ratio decreases with increasing wind speed. The calibration equations 20
TCD
9, 2201–2230, 2015Precipitation measurement intercomparison in the Qilian Mountains
R. Chen et al.
Title Page
Abstract Introduction
Conclusions References
Tables Figures
◭ ◮
◭ ◮
Back Close
Full Screen / Esc
Printer-friendly Version Interactive Discussion
Discussion
P
a
per
|
Discussion
P
a
per
|
Discussion
P
a
per
|
Discussion
P
a
per
|
1 Introduction
Accurate precipitation data are necessary for better understanding of the water cycle. It has been widely recognized that gauge-measured precipitation has systematic errors mainly caused by wetting, evaporation losses and wind-induced undercatch, and snow-fall observation errors are very large under high wind (Sugiura et al., 2003). It would 5
affect the available water evaluation in a large number of economic and environmental
applications (Tian et al., 2007; Ye et al., 2012).
Rodda (1967) compared the catch of an UK 5′′ manual gauge exposed normally
at the standard height of 30.5 m above ground, with a Koschmieder-type gauge ex-posed in a pit. The pit gauge caught 6 % more precipitation than the normally exex-posed 10
gauge. In the second WMO precipitation measurement intercomparison (Rain, 1972– 1976), the pit gauge with anti-splash grid was designated the reference standard for rain gauges (Goodison et al., 1998; Strangeways, 1998). In the third WMO precipi-tation measurement intercomparison (Snow, 1986–1993), the Double Fence Interna-tional Reference (DFIR) with a shielded Tretyakov gauge was designated the reference 15
standard snow gauges (Goodison et al., 1989, 1998; Sugiura et al., 2003). In the fourth
WMO precipitation measurement intercomparison (Rain Intensity, 2004–2008), diff
er-ent principles were tested to measure rainfall intensity and define a standardized cali-bration procedure (Lanza et al., 2005; Sevruk et al., 2009). Considering the automation of precipitation measurements, the WMO Commission for Instruments and Methods of 20
Observation (CIMO) organized the WMO Solid Precipitation Intercomparison Exper-iment (WMO-SPICE; Yang, 2014) to define and validate automatic field instruments as references for gauge intercomparison, and to assess automatic systems and the operational networks for precipitation observations. The WMO-SPICE project selected double fence gauges as the reference.
25
TCD
9, 2201–2230, 2015Precipitation measurement intercomparison in the Qilian Mountains
R. Chen et al.
Title Page
Abstract Introduction
Conclusions References
Tables Figures
◭ ◮
◭ ◮
Back Close
Full Screen / Esc
Printer-friendly Version Interactive Discussion
Discussion
P
a
per
|
Discussion
P
a
per
|
Discussion
P
a
per
|
Discussion
P
a
per
|
precipitation is concentrated in warm season on the Tibetan Plateau and is infrequent in winter, additional attention must be paid to systematic errors of gauge measured pre-cipitation. The DFIR has been operated as a reference at 25 stations in 13 countries around the world (Golubev, 1985), but deviations from the DFIR measurements vary by gauge type and precipitation type (Goodison et al., 1998). In China, the DFIR was 5
compared with the CSPG and the Hellmann gauge in valley site of Tianshan (43◦4′N,
87◦9′E, 3472 m) from 1987 to 1992, without wind data at the site (Yang et al., 1991;
Goodison et al., 1998). Consequently, the derived CSPG catch ratio equations were based on the 10 m height wind speed at open Daxigou Meteorological Station (43.06,
86.5◦E, 3540 m; Yang, 1988; Yang et al., 1991). Wind speeds at the Daxigou open
10
site and the Tianshan valley site are different, inducing uncertainty in the catch ratio equations established by Yang et al. (1991) for CSPG. As the Tibetan Plateau is an ecologically fragile region and the source of several large rivers in China and neigh-borhood countries, accurate precipitation data is urgently needed. Considering that no other intercomparison experiments have been conducted or reported from the Tibetan 15
Plateau and around regions (Chen et al., 2006), here it presents four-years gauge inter-comparison experiment in the Qilian mountains at northeastern Tibet Plateau, China, to establish calibration equations for the widely used CSPG and Alter gauges.
The CSPG is the standard manual precipitation observation gauge used by the China Meteorological Administration (CMA) at more than 700 stations since the 1950s. These 20
precipitation data sets have been used widely without calibration. The Alter shield is used by the CMA to enhance catch ratios of automatic gauges, so the CSPG with an Alter shied (Alter) was selected as another intercomparison gauge. The Pit and the DFIR were selected as the reference gauges for rainfall and snowfall, respectively. The intercomparison experiments tested and assessed existing bias correction procedures 25
TCD
9, 2201–2230, 2015Precipitation measurement intercomparison in the Qilian Mountains
R. Chen et al.
Title Page
Abstract Introduction
Conclusions References
Tables Figures
◭ ◮
◭ ◮
Back Close
Full Screen / Esc
Printer-friendly Version Interactive Discussion
Discussion
P
a
per
|
Discussion
P
a
per
|
Discussion
P
a
per
|
Discussion
P
a
per
|
The Pit and the DFIR catch ratios for snowfall and mixed precipitation are also com-pared. The CMA stations observe wind speeds at 10 m height, so the CSPG and Alter calibration equations are established with 10 m height wind speeds rather than gauge height wind speeds.
2 Data and methods
5
Precipitation intercomparison experiments (Fig. 1, Table 1) were conducted at a grass-land site in the Hulu watershed in the Qilian mountains, northeastern edge of Ti-bet Plateau, China (99◦52.9′, 38◦16.1′, 2980 m), where a meteorological
cryosphere-hydrology observation system (Chen et al., 2014) has been established since 2008. Annual precipitation is about 447 mm and concentrated in the warm season from May 10
to September. The annual temperature is approximately 0.4◦C, with a July mean of
4.2◦C and a January mean of
−4.1◦C.
Relevant variables such as air temperature (maximum, minimum and mean; Tmax,
Tmin and T0) have been observed manually at the site since June 2009. A tower is
used to measure wind speed (Lisa/Rita, SG GmbH;Ws) and air temperature (HMP45D,
15
Vaisala) at 1.5 and 2.5 m heights in association with relative humidity (HMP45D, Vaisala) and precipitation etc. (Chen et al., 2014). The specific meteorological con-ditions at the site are shown in Table 1.
The intercomparison experiments included a CSPG (orifice diameter=20 cm,
height=70 cm) and a CSPG with Alter shelter (Struzer, 1971). A Pit gauge (Sevruk and
20
Hamon, 1984) with CSPG (Pit) was installed in September 2010. In September 2012, a Double-Fence International Reference with a Tretyakov shelter and a CSPG (DFIR; Goodison et al., 1998) was installed as reference (Fig. 1, Table 2). In the cold son (October to April), snowfall dominated the precipitation events and in warm
sea-son (May to September), rainfall dominated. The precipitation amount (P) is measured
25
fun-TCD
9, 2201–2230, 2015Precipitation measurement intercomparison in the Qilian Mountains
R. Chen et al.
Title Page
Abstract Introduction
Conclusions References
Tables Figures
◭ ◮
◭ ◮
Back Close
Full Screen / Esc
Printer-friendly Version Interactive Discussion
Discussion
P
a
per
|
Discussion
P
a
per
|
Discussion
P
a
per
|
Discussion
P
a
per
|
nel and glass bottle are removed from the CSPG and precipitation is weighed under
a windproof box to avoid wind effects. In the warm seasonP is measured by volume.
To correct the gauge-measured precipitation, Sevruk and Hamon (1984) have given the general formula as:
Pc=K Pg+ ∆Pw+ ∆Pe+ ∆Pt=PDFIR+ ∆Pw+ ∆Pe+ ∆Pt (1)
5
where Pc is the corrected precipitation, K is the wind-induced coefficient and Pg is the gauge-measured precipitation.Pwis wetting loss,Peis evaporation loss,Pt is trace
precipitation andPDFIRis DFIR-measured precipitation. The precipitation gauges in this
work are CSPGs with the same Pg,Pw,Pe and Pt, thus PDFIR can be used instead of
K Pgin Eq. (1). For the CSPG,Pwis 0.23 mm for rainfall measurements, and 0.30 mm for
10
snow and 0.29 mm for mixed precipitation (Yang, 1988; Yang et al., 1991).The CSPG
design reduces Pe to a value less than other losses in the warm, rainy season (Ye
et al., 2004). In winter,Peis already small (0.10–0.20 mm day− 1
) according to results in Finland (Aaltonen et al., 1993) and Mongolia (Zhang et al., 2004). A precipitation event of less than 0.10 mm is beyond the resolution of the China recorder and is recorded as 15
a trace amount of precipitation (Pt). Ye et al. (2004) recommended assigning a value of
0.1 mm, regardless of the number of the trace observations per day.
Most important factor influencing precipitation measurement in high mountain con-ditions is wind, which is the focus of the present study. The WMO has given Eqs. (2)– (4) for gauge catch ratio (CR=1/K =Pg/DFIR, %) vs. daily wind speed (Ws, m s−
1
) 20
at gauge height, and daily maximum and minimum temperatures (Tmax, Tmin, ◦C) on
a daily time step for various precipitation types (Yang et al., 1995; Goodison et al., 1998). These equations can be used over a great range of environmental conditions (Goodison et al., 1998).
CRsnow=103.1−8.67Ws+0.3Tmax (2)
25
CRmix=96.99−4.46Ws+0.88Tmax+0.22Tmin (3)
TCD
9, 2201–2230, 2015Precipitation measurement intercomparison in the Qilian Mountains
R. Chen et al.
Title Page
Abstract Introduction
Conclusions References
Tables Figures
◭ ◮
◭ ◮
Back Close
Full Screen / Esc
Printer-friendly Version Interactive Discussion
Discussion
P
a
per
|
Discussion
P
a
per
|
Discussion
P
a
per
|
Discussion
P
a
per
|
where CRsnow(%), CRmix (%), and CRrain (%) are catch ratios for snow, mixed
precip-itation, and rain (%), respectively;Ws is wind speed at gauge height (m s− 1
);Tmaxand
Tmin are daily maximum and minimum air temperatures (◦C).
Yang et al. (1991) and Ye et al. (2007) have given Eqs. (5)–(7) for CSPG catch ratios vs. daily wind speedWs(m s−
1
) at 10 m height: 5
CRsnow=100 exp(−0.056Ws) (0< Ws<6.2) (5)
CRrain=100 exp(−0.04Ws) (0< Ws<7.3) (6)
CRmix=CRsnow−(CRsnow−CRrain)(T0+2)/4 (7)
whereT0is the daily mean air temperature.
In this field experiment, two aspects are focused. One is based on rainfall obser-10
vations comparisons among the CSPG, Alter and Pit gauges to establish calibration equations for the CSPG and the Alter with 10 m height wind speeds. Another purpose is based on snow and mixed precipitation observation comparisons among the CSPG, Alter, Pit, and DFIR, to establish calibration equations for snow and mixed precipitation with 10 m height wind speeds.
15
3 Results
From September 2010 to September 2014, total 578 observations were recorded at the intercomparison site for CSPG, Alter and Pit, respectively (Table 3). Snow happened 67 times, mixed precipitation only happened 32 times, and rain happened 479 times during this period. From September 2012 to September 2014, a subset of 253 observations 20
were recorded for the CSPG, Alter, Pit, and DFIR gauges (Table 3).
3.1 Precipitation gauge intercomparison for rainfall
The Pit was selected as the reference gauge, and 479 rainfall events recorded by
TCD
9, 2201–2230, 2015Precipitation measurement intercomparison in the Qilian Mountains
R. Chen et al.
Title Page
Abstract Introduction
Conclusions References
Tables Figures
◭ ◮
◭ ◮
Back Close
Full Screen / Esc
Printer-friendly Version Interactive Discussion
Discussion
P
a
per
|
Discussion
P
a
per
|
Discussion
P
a
per
|
Discussion
P
a
per
|
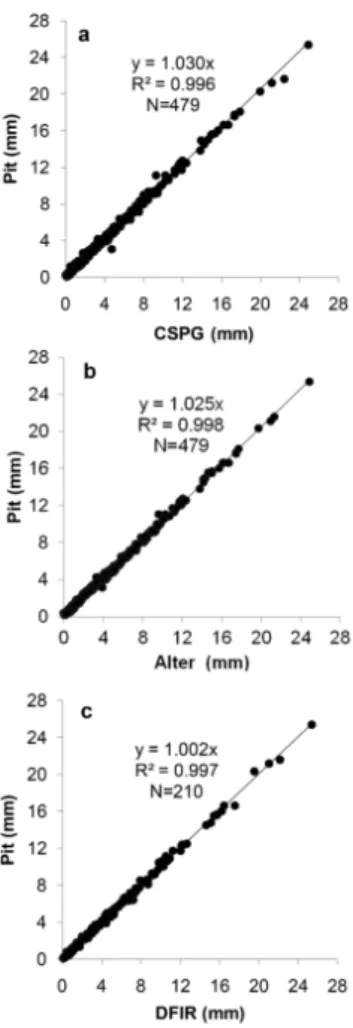
intercomparsion studies (Table 3). The Pit caught 4.7 % more rainfall than the CSPG, and 3.4 % more than the Alter.
For rainfall events from September 2012 to September 2014, the DFIR was selected as the reference gauge. The DFIR caught 3.4 % more rainfall than the CSPG, 2.5 % more than the Alter, and 1.0 % less than the Pit (Table 3). Comparative studies indicate 5
that the Pit gauge CR is superior to that of the DFIR or the other gauges (Fig. 2).
3.2 Precipitation gauge intercomparison for mixed precipitation
Table 3 lists the primary intercomparison results for the 4 different gauges. The DFIR caught 13.4 % more mixed precipitation than the CSPG, 5.4 % more than the Alter, and 2.4 % less than the Pit from September 2012 to September 2014 (Table 3). Selecting 10
the DFIR as the reference, Fig. 3 compares 17 mixed precipitation events among the DFIR and the other gauges (CSPG, Alter and Pit). Close liner relationships exist among the gauges. The Pit caught more mixed precipitation than the DFIR in two successive years, which means the Pit gauge could be used as reference gauge for mixed pre-cipitation at the Hulu watershed experiment site. Figure 4a and b compares 32 mixed 15
precipitation events between the Pit and the CSPG and the Pit and Alter, from which
it notes the mixed precipitation amount differences for the Pit and CSPG or the Pit
and the Alter range from 0.1 to 2 mm; no outliers and scatters appeared on the plots. Regression analysis reveals a close correlation between the Pit and the other gauges for mixed precipitation data. The linear relationship is statistically significant with 98 % 20
confidence. Thus the Pit gauge instead of the DFIR could be selected as the reference gauge of mixed precipitation to calculate CRs for the CSPG and the Alter.
3.3 Precipitation gauge intercomparison for snowfall
TCD
9, 2201–2230, 2015Precipitation measurement intercomparison in the Qilian Mountains
R. Chen et al.
Title Page
Abstract Introduction
Conclusions References
Tables Figures
◭ ◮
◭ ◮
Back Close
Full Screen / Esc
Printer-friendly Version Interactive Discussion
Discussion
P
a
per
|
Discussion
P
a
per
|
Discussion
P
a
per
|
Discussion
P
a
per
|
than the CSPG, 11.4 % more than the Alter, and 4.6 % more than the Pit. The difference of total snowfall between the DFIR and the Pit was only about 2.3 mm.
Selecting the DFIR as the reference, Fig. 5 compares 26 snow precipitation events among the DFIR and the other three gauges. Close linear relationships exist be-tween the DFIR and each of the other three gauges. From the Fig. 5c, it could find 5
the good liner correlation existed between the Pit and the DFIR, and the total
pre-cipitation difference was very small between these two gauges. Considering the fact
that only two years of DFIR observation data are available, while the Pit gauge has four consecutive years of observations data, the Pit gauge was selected as the refer-ence to calculate CRs for the CSPG and the Alter. From September 2010 to Septem-10
ber 2014, the Pit caught 24.2 % more snow than the CSPG and 7.8 % more than the Alter. Figure 6a and b compares 67 snow precipitation events for the Pit with the CSPG and the Alter, which showed close linear relationships. In four consecu-tive years, the CRPit (PCSPG/PPit) of the CSPG is 0.80 (Table 3), which is close to the
CRDFIR (PCSPG/PDFIR=0.79) of the CSPG in two year observation results (Table 3).
15
This means the Pit gauge could be used as the reference gauge for snow precipitation events at the experiment site.
3.4 Catch ratio vs. wind speed
Previous studies showed that wind speed during the precipitation period is the most sig-nificant variable affecting gauge catch efficiency (Metcalfe and Goodison, 1993; Yang 20
et al., 1995; Goodison et al., 1998). Here the relationships of rain, mixed precipitation, and snow catch ratios to wind speed during the precipitation periods are analyzed. To minimize ratio scatter of among different gauges, precipitation events greater than 3 mm are normally selected in the ratio vs. wind analysis (Yang et al., 1995, 2014). In the Hulu watershed, most snowfall events are less than 3 mm. For this reason, precip-25
itation greater than 1 mm was used in this study for catch ratio vs. wind studies.Ws at
TCD
9, 2201–2230, 2015Precipitation measurement intercomparison in the Qilian Mountains
R. Chen et al.
Title Page
Abstract Introduction
Conclusions References
Tables Figures
◭ ◮
◭ ◮
Back Close
Full Screen / Esc
Printer-friendly Version Interactive Discussion
Discussion
P
a
per
|
Discussion
P
a
per
|
Discussion
P
a
per
|
Discussion
P
a
per
|
according to the Monin–Obukhov theory and the gradient method (Bagnold,1941; Dyer and Bradley, 1982):
lnz0=
Ws2.5ln 1.5−Ws1.5ln 2.5
Ws2.5−Ws1.5
(8)
Ws=kWs1.5, k=
ln(10.0/z0)
ln(1.5/z0)
. (9)
3.4.1 Rainfall catch ratio vs. wind speed 5
Selecting the Pit gauge as the reference, Fig. 7 presents scatter plot of the CRs of CSPG/Pit and Alter/Pit vs. wind speed. The CRs vary from 0.8 to 1.1. With increasing wind speed, the CRs decreased slightly. The following two Eqs. (10) and (11) could be used to calibrate the rainfall data for the CSPG gauge or the Alter gauge.
CRCSPG=−0.01·Ws+0.989 (10)
10
CRAlter=−0.01·Ws+0.998 (11)
where CRCSPG is the CSPG catch ratio, CRAlteris the Alter catch ratio, Ws is the wind
speed at 10 m height.
3.4.2 Mixed precipitation catch ratio vs. wind speed
Figure 5c shows that a good liner relationship existed between the Pit and the DFIR 15
for mixed precipitation measurement. Figure 8a shows that the Pit/DFIR CR is approxi-mately 1, and wind speed has little effect on the Pit gauge for mixed precipitation. Thus the Pit gauge was selected as the reference to establish a regression equation between the CSPG/Pit CR and wind speed. Figure 8b and c shows that the CSPG/Pit CR and the Alter/Pit CR decreased with increasing wind speed. Equations (12) and (13) were 20
TCD
9, 2201–2230, 2015Precipitation measurement intercomparison in the Qilian Mountains
R. Chen et al.
Title Page
Abstract Introduction
Conclusions References
Tables Figures
◭ ◮
◭ ◮
Back Close
Full Screen / Esc
Printer-friendly Version Interactive Discussion
Discussion
P
a
per
|
Discussion
P
a
per
|
Discussion
P
a
per
|
Discussion
P
a
per
|
CRCSPG=−0.051·Ws+1 (12)
CRAlter=−0.030·Ws+1 (13)
where CRCSPG is the CSPG catch ratio, CRAlter is the Alter catch ratio, and Ws is the
wind speed at 10 m height.
3.4.3 Snowfall catch ratio vs. wind speed 5
Figure 9a presents the scatter plot of the CSPG/DFIR CR vs. wind speed. The CR decrease from 1.0 to 0.6 when wind speed increased from 0.5 to 4.5 m s−1. The scatter
plot of the CR of Alter/DFIR vs. wind speed shows that the CR decreased from 1.0
to 0.8 with increasing wind speed from 0.5 to 3 m s−1 (Fig. 9b). Wind speed has no
significant effect on Pit/DFIR CR, and the CR values are around 1.0. From Fig. 9c it
10
could be concluded that the Pit gauge can substitute as the reference gauge at the experiment site. Equations (14) and (15) could be used to calibrate the CSPG or Alter gauge snowfall data.
CRCSPG=−0.081·Ws+1 (14)
CRAlter=−0.016·Ws+0.957 (15)
15
where CRCSPG is the CSPG catch ratio, CRAlter is the Alter catch ratio, and Ws is the
wind speed at 10 m height.
4 Discussion
4.1 Comparison with other studies
Yang et al. (1991) carried out a precipitation intercomparison experiment in valley site of 20
TCD
9, 2201–2230, 2015Precipitation measurement intercomparison in the Qilian Mountains
R. Chen et al.
Title Page
Abstract Introduction
Conclusions References
Tables Figures
◭ ◮
◭ ◮
Back Close
Full Screen / Esc
Printer-friendly Version Interactive Discussion
Discussion
P
a
per
|
Discussion
P
a
per
|
Discussion
P
a
per
|
Discussion
P
a
per
|
precipitation were 1.222 and 1.160. In the Hulu watershed, the ratios of DFIR/CSPG for snowfall and mixed precipitation were 1.234 and 1.069, and the ratio of Pit/CSPG for snowfall and mixed precipitation is 1.199 and 1.078, respectively. Similar topographic features and shading induced lower wind speeds at both sites, which led to the similar catch ratios. For the Tianshan reference site, wind speed on rainfall or snowfall days 5
never exceeds 6 m s−1 and 88 % of the yearly total precipitation took place with wind
speeds below 3 m s−1. For the Hulu watershed site, wind speeds on precipitation days
never exceeded 4.5 m s−1, and over 80 % of the precipitation events happened when
wind speeds were below 3 m s−1.
As Ren and Li (2007) reported, among 30 comparison stations in China, the Pit 10
caught 3.2 % (1.1–7.9 %) more rainfall and 11.0 % (2.2–24.8 %) more snowfall than
the CSPG. Large wind-induced differences often appeared at the western
mountain-ous stations. In our study, the Pit gauge got 4.7 % more rainfall, 24.2 % more snowfall, and 11.6 % more mixed precipitation than the CSPG from September 2010 to Septem-ber 2014 (Table 3). The outcome presented in this study is similar with Ren and Li 15
(2007) presented.
4.2 Possibility of the Pit gauge as a reference for solid precipitation
The Pit gauge is the WMO reference standard for liquid precipitation measurements and the DFIR is the reference standard for solid precipitation measurements (Sevruk et al., 2009). In this study, the Pit gauge performed superior than the DFIR for rain-20
fall catch ratio and mixed precipitation catch ratios. For snowfall, the catch ratio for the Pit gauge is 0.96, close to the DFIR catch ratio. Thus the Pit gauge could serve as a reference for liquid and solid precipitation in the Hulu watershed. Considering the Pit gauge’s greater simplicity and practicality, it could be more convenient for re-searchers and observers to use the Pit gauge as the standard reference for snow and 25
mixed precipitation in other locations. Precipitation collected by the Pit gauge would
be most affected when blowing or drifting snow occurred, and induce a faulty
TCD
9, 2201–2230, 2015Precipitation measurement intercomparison in the Qilian Mountains
R. Chen et al.
Title Page
Abstract Introduction
Conclusions References
Tables Figures
◭ ◮
◭ ◮
Back Close
Full Screen / Esc
Printer-friendly Version Interactive Discussion
Discussion
P
a
per
|
Discussion
P
a
per
|
Discussion
P
a
per
|
Discussion
P
a
per
|
most of China maximum snow depths in the past 30 years have been less than 20 cm (Li, 1999), and average snow depths were less than 3 cm (Li et al., 2008; Che et al., 2008). Figure 10 shows annual snowfall amounts and annual snowfall proportion dis-tributions for 644 meteorological stations in China from 1960 to 1979, indicating that snowfall concentrated in the south-eastern Tibetan Plateau, northern Xinjiang province 5
and north-eastern China. Statistical analysis indicates that for more than 94 % of sta-tions, solid precipitation is less than 15 % of the annual precipitation amount. Scarcity of accumulated snow and little snowfall correlates to rare occurrence of blowing snow in most of China. The applicable regions for the Pit and the DFIR as reference gauges are shown in Fig. 11 based on CMA snowfall and snow depth data.
10
5 Conclusions
The precipitation intercomparsion experiment in the Hulu watershed indicates that the Pit gauge catches more rainfall, mixed precipitation and total precipitation than the DFIR. The catch ratios for rainfall and mixed precipitation can be ordered as follows: CRPit>CRDFIR>CRAlter>CRCSPG. While in the snowy season, it follows the rule that
15
better wind-shelter catch with more snow, and the catch ratios for snow can be ordered CRDFIR>CRPit>CRAlter>CRCSPG. The catch ratio of the Pit vs. DFIR reaches 1.01
for solid and liquid precipitation.
In rainfall dominated south and central part of China, the Pit gauge could be used as the reference gauge with highest catch ratio. In north-east China, northern Xin-20
TCD
9, 2201–2230, 2015Precipitation measurement intercomparison in the Qilian Mountains
R. Chen et al.
Title Page
Abstract Introduction
Conclusions References
Tables Figures
◭ ◮
◭ ◮
Back Close
Full Screen / Esc
Printer-friendly Version Interactive Discussion
Discussion
P
a
per
|
Discussion
P
a
per
|
Discussion
P
a
per
|
Discussion
P
a
per
|
The Supplement related to this article is available online at doi:10.5194/tcd-9-2201-2015-supplement.
Acknowledgements. This paper was mainly supported by the National Basic Research Pro-gram of China (2013CBA01806) and the National Natural Sciences Foundation of China (91025011, 41222001, 91225302 and 41401078).
5
References
Aaltonen, A., Elomaa, E., Tuominen, A., and Valkovuori, P.: Measurement of precipitation, in: Proceedings of the Symposium on Precipitation and Evaporation, edited by: Sevruk, B. and Lapin, M., Slovak Hydrometeorlogical Institute and Swiss Federal Institute of Technology, Bratislava, Slovakia, 42–46, 1993.
10
Bagnold, R. A.: The Physics of Blown Sand and Desertdunes, Methuen, New York, 85–95, 1941.
Che, T., Li, X., Jin, R., Armstrong, R., and Zhang, T.: Snow depth derived from passive mi-crowave remote-sensing data in China, Ann. Glaciol., 49, 145–154, 2008.
Chen, R., Kang, E., Ji, X., Yang, J., and Yang, Y.: Cold regions in China, Cold Reg. Sci. Technol.,
15
45, 95–102, doi:10.1016/j.coldregions.2006.03.001, 2006.
Chen, R., Song, Y., Kang, E., Han, C., Liu, J., Yang, Y., Qing, W., and Liu, Z.: A Cryosphere– Hydrology Observation System in a Small Alpine Watershed in the Qilian Mountains of China and Its Meteorological Gradient, Arct. Antarct. Alp. Res., 46, 505–523, doi:10.1657/1938-4246-46.2.505, 2014.
20
Dyer, A. J. and Bradley, E. F.: An alternative analysis of flux–gradient relationships at the 1976 ITCE, Bound.-Lay. Meteorol., 22, 3–19, doi:10.1007/BF00128053, 1982.
Golubev, V. S.: On the problem of actual precipitation measurements at the observations site, in: Proceeding of the International Workshop on theCorrection of Precipitation Measurements WMO/TD 104, World Meteorological Organization, Geneva, Switzerland, 61–64, 1985.
25
TCD
9, 2201–2230, 2015Precipitation measurement intercomparison in the Qilian Mountains
R. Chen et al.
Title Page
Abstract Introduction
Conclusions References
Tables Figures
◭ ◮
◭ ◮
Back Close
Full Screen / Esc
Printer-friendly Version Interactive Discussion
Discussion
P
a
per
|
Discussion
P
a
per
|
Discussion
P
a
per
|
Discussion
P
a
per
|
Goodison, B. E., Louie, B. P. Y. T., and Yang, D.: WMO solid precipitation measurement inter-comparison: Final report, Instrum. and Obs. Methods Rep. 67/Tech. Doc. 872, World Mete-orol. Organ., Geneva, Switzerland, 1998.
Lanza, L. G., Leroy, M., Alexandropoulos, C., Stagi, L., and Wauben, U.: WMO Laboratory Intercomparison of Rainfall Intensity Gauges – Final Report, IOM Report No. 84, WMO/TD
5
No. 1304, WMO, Geneva, Switzerland, 2005.
Li, P.:. Variation of snow water resources in northwestern China, 1951–1997, Sci. China Ser. D, 42, 73–79, 1999.
Li, X., Cheng, G., Jin, H., Kang, E., Che, T., Jin, R., Wu, L., Nan, Z., Wang, J., and Shen, Y.: Cryospheric change in China, Global Planet. Change, 62, 210–218,
10
doi:10.1016/j.gloplacha.2008.02.001, 2008.
Metcalfe, J. R. and Goodison, B. E.: Correction of Canadian Winter Precipitation Data, Preprints, in: Eighth Symp. on Meteorological Observations and Instrumentation, Anaheim, CA, Am. Meteorol. Soc., 338–343, 1993.
Ren, Z. and Li, M.: Errors and correction of precipitation measurements in China, Adv. Atmos.
15
Sci., 24, 449–458, doi:10.1007/s00376-007-0449-3, 2007.
Rodda, J. C.: The rainfall measurement problem, in: Proceedings of LAHS, Publication No. 78, General Assembly, Bern, 215–231, 1967.
Sevruk, B. and Hamon, W. R.: International Comparison of National Precipitation Gauges with a Reference Pit Gauge, Instruments and Observing Methods Rep. 17, 135, World
Meteo-20
rol. Org., Geneva, 1984.
Sevruk, B., Ondrás, M., and Chvíla, B.:. The WMO precipitation measurement intercompar-isons, Atmos. Res., 92, 376–380, doi:10.1016/j.atmosres.2009.01.016, 2009.
Strangeways, I. C.: CEN Standard for a Reference Raingauge Pit, Report of Working Group 5 to CEN/TC 318 – Hydrometry, British Standards Institution, London, UK, 1998.
25
Struzer, L. R.: Practicability analysis of rain gauge internationalcomparison test results (in Rus-sian), Trans. Voyeykov Main Geophys. Observ., 260, 77–94, 1971.
Sugiura, K., Yang, D., and Ohata, T.: Systematic error aspects of gauge-measured solid precipitation in the Arctic, Barrow, Alaska, Geophys. Res. Lett., 30, 1192, doi:10.1029/2002GL015547, 2003.
30
TCD
9, 2201–2230, 2015Precipitation measurement intercomparison in the Qilian Mountains
R. Chen et al.
Title Page
Abstract Introduction
Conclusions References
Tables Figures
◭ ◮
◭ ◮
Back Close
Full Screen / Esc
Printer-friendly Version Interactive Discussion
Discussion
P
a
per
|
Discussion
P
a
per
|
Discussion
P
a
per
|
Discussion
P
a
per
|
Yang, D.: Research on analysis and correction of systematicerrors in precipitation measurement in Urumqi River basin, Tianshan, PhD thesis, Lanzhou Institute of Glaciology and Geocryol-ogy, Chinese Academy of Sciences, Lanzhou, China, 169 pp., 1988.
Yang, D.: Double-Fence Intercomparison Reference (DFIR) vs. Bush Gauge for “true” snowfall measurement, J. Hydrol., 509, 94–100, doi:10.1016/j.jhydrol.2013.08.052, 2014.
5
Yang, D., Shi, Y., Kang, E., Zhang, Y., and Yang, X.: Results of solid precipitation measurement intercomparison in the Alpine area of Urumqi River basin, Chin. Sci. Bull., 36, 1105–1109, 1991.
Yang, D., Metcalfe, J. R., Goodison, B. E., and Mekis, E.: An evaluation of Double-Fence Intercomparison Reference (DFIR) gauge, in: Proceedings of Eastern Snow Conference,
10
50th Meeting, Quebec, City, 105–111, 1993.
Yang, D., Goodison, B. E., Metcalfe, J. R., Golubev, V. S., Elomaa, E., Gunther, T. H., Bates, R., Pangburn, T., Hanson, C. L., Emerson, D., Copaciu, V., and Milkovic, J.: Accuracy of Tretyakov precipitation gauge: results of WMO intercomparison, Hydrol. Process., 9, 877– 895, doi:10.1002/hyp.3360090805, 1995.
15
Ye, B., Yang, D., Ding, Y., Han, T., and Koike, T.: A bias-corrected precipitation climatology for China, J. Hydrometeorol., 5, 1147–1160, doi:10.1175/JHM-366.1, 2004.
Ye, B., Yang, D., Ding, Y., and Han, T.: A bias-corrected precipitation Climatology for China, Acta Geogr. Sin., 62, 3–13, 2007.
Ye, B., Yang, D., and Ma, L.: Effect of precipitation bias correction onwater budget
calcu-20
lation in Upper Yellow River, China, Environ. Res. Lett., 7, 025201, doi:10.1088/1748-9326/7/2/025201, 2012.
TCD
9, 2201–2230, 2015Precipitation measurement intercomparison in the Qilian Mountains
R. Chen et al.
Title Page
Abstract Introduction
Conclusions References
Tables Figures
◭ ◮
◭ ◮
Back Close
Full Screen / Esc
Printer-friendly Version Interactive Discussion
Discussion
P
a
per
|
Discussion
P
a
per
|
Discussion
P
a
per
|
Discussion
P
a
per
|
Table 1.Monthly climate values at the experimental site (2010–2012).
Element Jan Feb Mar Apr May Jun Jul Aug Sep Oct Nov Dec Yearly
P (mm) 3.5 2.5 11.0 8.8 67.7 69.6 87.1 111.6 57.7 24.0 2.7 1.0 447.2 T0(◦C)
−4.1 −2.6 −1.5 0.7 2.3 3.7 4.2 4.0 2.7 0.5 −1.9 −3.8 0.4 Tmax(◦C) −1.3 0.2 1.2 3.4 4.8 6.1 6.5 6.6 5.1 3.4 1.2 −0.6 3.0
Tmin(◦C)
−6.3 −4.9 −3.9 −1.7 0.2 1.6 2.3 1.9 0.6 −1.8 −4.2 −6.1 −1.9 Ws1.5(m s−1) 0.60 0.65 0.77 0.85 0.81 0.66 0.61 0.60 0.64 0.60 0.69 0.65 0.68
Ws2.5(m s−1) 0.60 0.67 0.81 0.92 0.88 0.72 0.68 0.67 0.72 0.66 0.73 0.67 0.73
TCD
9, 2201–2230, 2015Precipitation measurement intercomparison in the Qilian Mountains
R. Chen et al.
Title Page
Abstract Introduction
Conclusions References
Tables Figures
◭ ◮
◭ ◮
Back Close
Full Screen / Esc
Printer-friendly Version Interactive Discussion
Discussion
P
a
per
|
Discussion
P
a
per
|
Discussion
P
a
per
|
Discussion
P
a
per
|
Table 2.The precipitation measurement intercomparison experiment in Qilian mountains.
Gauge Abbreviation Size(ϕstand for orifice diameter and Start End Measure time
hfor observation height) date date
China standard CSPG ϕ=20 cm,h=70 cm Jun 2009 Sep 2014 20:00 and 08:00,
precipitation gauge LT
CSPG with Alter shelter Alter ϕ=20 cm,h=70 cm Jun 2009 Sep 2014 20:00 and 08:00,
(Struzer, 1971) LT
Pit gauge (Sevruk, 1984) Pit ϕ=20 cm,h=0 cm Sep 2010 Sep 2014 20:00 and 08:00,
with a CSPG LT
Double-Fence with CSPG DFIR ϕ=20 cm,h=3.0 m Sep 2012 Sep 2014 20:00 and 08:00,
TCD
9, 2201–2230, 2015Precipitation measurement intercomparison in the Qilian Mountains
R. Chen et al.
Title Page
Abstract Introduction
Conclusions References
Tables Figures
◭ ◮
◭ ◮
Back Close
Full Screen / Esc
Printer-friendly Version Interactive Discussion
Discussion
P
a
per
|
Discussion
P
a
per
|
Discussion
P
a
per
|
Discussion
P
a
per
|
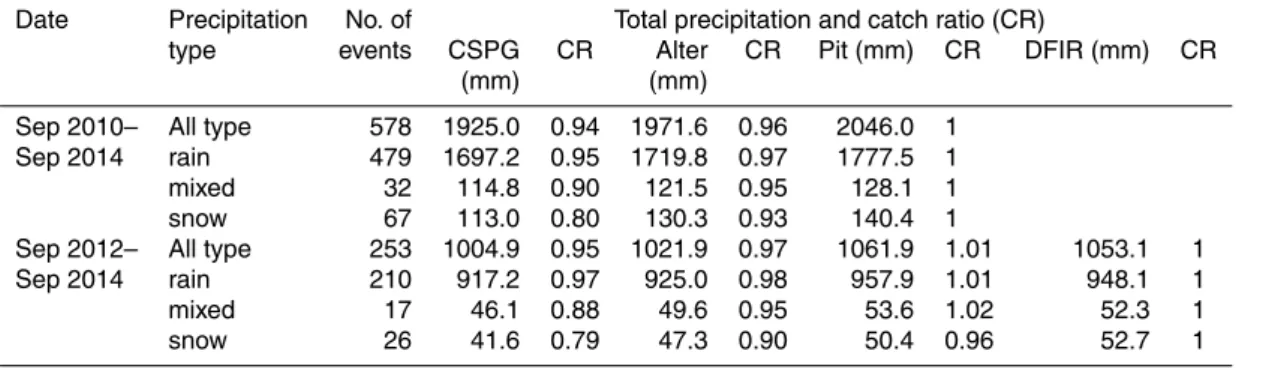
Table 3.Summary of daily observations at Hulu watershed intercomparison site, 2010–2014.
Date Precipitation No. of Total precipitation and catch ratio (CR)
type events CSPG CR Alter CR Pit (mm) CR DFIR (mm) CR
(mm) (mm)
Sep 2010– All type 578 1925.0 0.94 1971.6 0.96 2046.0 1
Sep 2014 rain 479 1697.2 0.95 1719.8 0.97 1777.5 1
mixed 32 114.8 0.90 121.5 0.95 128.1 1
snow 67 113.0 0.80 130.3 0.93 140.4 1
Sep 2012– All type 253 1004.9 0.95 1021.9 0.97 1061.9 1.01 1053.1 1
Sep 2014 rain 210 917.2 0.97 925.0 0.98 957.9 1.01 948.1 1
mixed 17 46.1 0.88 49.6 0.95 53.6 1.02 52.3 1
TCD
9, 2201–2230, 2015Precipitation measurement intercomparison in the Qilian Mountains
R. Chen et al.
Title Page
Abstract Introduction
Conclusions References
Tables Figures
◭ ◮
◭ ◮
Back Close
Full Screen / Esc
Printer-friendly Version Interactive Discussion
Discussion
P
a
per
|
Discussion
P
a
per
|
Discussion
P
a
per
|
Discussion
P
a
per
|
DFIR CSPG CSPG with Alter shelter Pit gauge with CSPG Pit gauge with a larger diameter bucket Tibet Plateau
① CSPG ② Alter
③ Pit ④ DFIR Hulu watershed
Qilian mountains
Figure 1. Precipitation gauge intercomparison experiment in the Qilian mountains, Tibetan Plateau.
TCD
9, 2201–2230, 2015Precipitation measurement intercomparison in the Qilian Mountains
R. Chen et al.
Title Page
Abstract Introduction
Conclusions References
Tables Figures
◭ ◮
◭ ◮
Back Close
Full Screen / Esc
Printer-friendly Version Interactive Discussion
Discussion
P
a
per
|
Discussion
P
a
per
|
Discussion
P
a
per
|
Discussion
P
a
per
|
y = 1.069x R² = 0.972 N=17
0 2 4 6 8 10 12
0 2 4 6 8 10 12
D
F
IR
(
m
m
)
CSPG (mm) a
y = 0.993x R² = 0.980 N=17
0 2 4 6 8 10 12
0 2 4 6 8 10 12
D
F
IR
(
m
m
)
Alter (mm) b
y = 0.988x R² = 0.969 N=17
0 2 4 6 8 10 12
0 2 4 6 8 10 12
D
F
IR
(
m
m
)
Pit (mm) c
Figure 3.Scatter plots of mixed precipitation for(a)the CSPG,(b)Alter and(c)the Pit vs. the DFIR from September 2012 to September 2014.
TCD
9, 2201–2230, 2015Precipitation measurement intercomparison in the Qilian Mountains
R. Chen et al.
Title Page
Abstract Introduction
Conclusions References
Tables Figures
◭ ◮
◭ ◮
Back Close
Full Screen / Esc
Printer-friendly Version Interactive Discussion
Discussion
P
a
per
|
Discussion
P
a
per
|
Discussion
P
a
per
|
Discussion
P
a
per
|
y = 1.019x R² = 0.980 N=32
0 2 4 6 8 10 12 14 16
0 2 4 6 8 10 12 14 16
P
it
(
m
m)
Alter (mm)
b
y = 1.078x R² = 0.973 N=32
0 2 4 6 8 10 12 14 16
0 2 4 6 8 10 12 14 16
P
it
(
m
m)
CSPG (mm)
a
Figure 4.Scatter plots of mixed precipitation for(a)the CSPG and(b)the Alter vs. the Pit from September 2010 to September 2014.
TCD
9, 2201–2230, 2015Precipitation measurement intercomparison in the Qilian Mountains
R. Chen et al.
Title Page
Abstract Introduction
Conclusions References
Tables Figures
◭ ◮
◭ ◮
Back Close
Full Screen / Esc
Printer-friendly Version Interactive Discussion
Discussion
P
a
per
|
Discussion
P
a
per
|
Discussion
P
a
per
|
Discussion
P
a
per
|
y = 1.234x R² = 0.98 N=26
0 2 4 6 8 10
0 2 4 6 8 10
D
F
IR
(
mm
)
CSPG (mm) a
y = 1.122x R² = 0.990 N=26
0 2 4 6 8 10
0 2 4 6 8 10
D
F
IR
(
m
m
)
Alter (mm) b
y = 1.032x R² = 0.993 N=26
0 2 4 6 8 10
0 2 4 6 8 10
D
F
IR
(
m
m
)
Pit (mm) c
Figure 5.Scatter plots of snowfall for(a)the CSPG,(b)the Alter and(c)the Pit vs. the DFIR from September 2012 to September 2014.
TCD
9, 2201–2230, 2015Precipitation measurement intercomparison in the Qilian Mountains
R. Chen et al.
Title Page
Abstract Introduction
Conclusions References
Tables Figures
◭ ◮
◭ ◮
Back Close
Full Screen / Esc
Printer-friendly Version Interactive Discussion
Discussion
P
a
per
|
Discussion
P
a
per
|
Discussion
P
a
per
|
Discussion
P
a
per
|
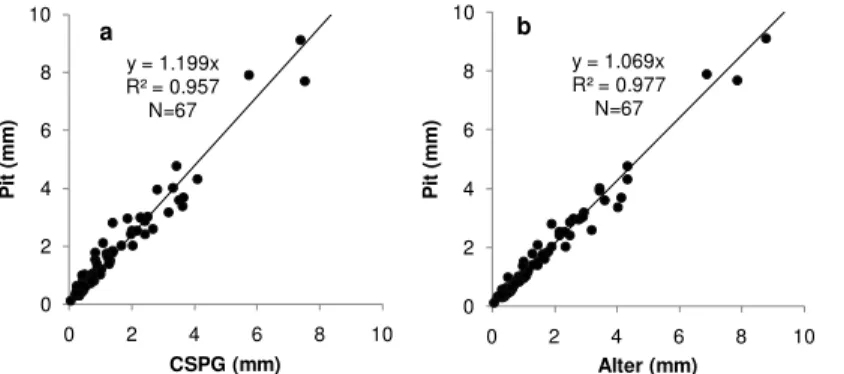
y = 1.199x R² = 0.957 N=67
0 2 4 6 8 10
0 2 4 6 8 10
P
it
(
m
m)
CSPG (mm)
a
y = 1.069x R² = 0.977 N=67
0 2 4 6 8 10
0 2 4 6 8 10
P
it
(
m
m)
Alter (mm)
b
Figure 6.Scatter plots of snowfall for(a)the CSPG, and(b)the Alter vs. the Pit from Septem-ber 2010 to SeptemSeptem-ber 2014.
TCD
9, 2201–2230, 2015Precipitation measurement intercomparison in the Qilian Mountains
R. Chen et al.
Title Page
Abstract Introduction
Conclusions References
Tables Figures
◭ ◮
◭ ◮
Back Close
Full Screen / Esc
Printer-friendly Version Interactive Discussion
Discussion
P
a
per
|
Discussion
P
a
per
|
Discussion
P
a
per
|
Discussion
P
a
per
|
y = -0.010x + 0.989 R² = 0.105
N=164
0.4 0.6 0.8 1 1.2
0 2 4 6 8
C
SPG
/Pi
t
Wind speed at 10m (m/s)
a
y = -0.010x + 0.998 R² = 0.115
N=164
0.4 0.6 0.8 1 1.2
0 2 4 6 8
A
lt
e
r/P
it
Wind speed at 10m (m/s)
b
Figure 7.CRs of(a)CSPG/Pit and(b)Alter/Pit vs. wind speed at 10 m for Pit rainfall>3 mm.
TCD
9, 2201–2230, 2015Precipitation measurement intercomparison in the Qilian Mountains
R. Chen et al.
Title Page
Abstract Introduction
Conclusions References
Tables Figures
◭ ◮
◭ ◮
Back Close
Full Screen / Esc
Printer-friendly Version Interactive Discussion
Discussion
P
a
per
|
Discussion
P
a
per
|
Discussion
P
a
per
|
Discussion
P
a
per
|
y = 0.000x + 1.03 R² = -0.01
N=15
0 0.2 0.4 0.6 0.8 1 1.2 1.4 1.6
0 2 4 6 8
P
it
/D
F
IR
Wind speed at 10m (m/s) a
y = -0.051x + 1 R² = 0.231
N=29
0 0.2 0.4 0.6 0.8 1 1.2
0 2 4 6 8
C
SPG
/Pi
t
Wind speed at 10m (m/s) b
y = -0.030x + 1 R² = 0.134
N=29
0 0.2 0.4 0.6 0.8 1 1.2 1.4
0 2 4 6 8
A
lt
e
r/P
it
Wind speed at 10m (m/s) c
Figure 8.CRs of (a)Pit/DFIR, (b)CSPG/Pit and (c) Alter/Pit vs. wind speed at 10 m for Pit mixed precipitation>1 mm.
TCD
9, 2201–2230, 2015Precipitation measurement intercomparison in the Qilian Mountains
R. Chen et al.
Title Page
Abstract Introduction
Conclusions References
Tables Figures
◭ ◮
◭ ◮
Back Close
Full Screen / Esc
Printer-friendly Version Interactive Discussion
Discussion
P
a
per
|
Discussion
P
a
per
|
Discussion
P
a
per
|
Discussion
P
a
per
|
y = -0.081x + 1 R² = 0.657
N=22
0.2 0.4 0.6 0.8 1 1.2
0 2 4 6
C
S
P
G
/D
F
IR
Wind speed at 10m (m/s) a
y = -0.016x + 0.957 R² = 0.056
N=22
0.2 0.4 0.6 0.8 1.0 1.2
0 2 4 6
A
lt
e
r/D
F
IR
Wind speed at 10m (m/s) b
y = -0.018x + 1.011 R² = 0.046
N=22
0.2 0.4 0.6 0.8 1.0 1.2
0 2 4 6
P
it
/D
F
IR
Wind speed at 10m (m/s) c
Figure 9.CRs of (a)CSPG/DFIR,(b)Alter/DFIR and(c)Pit/DFIR vs. wind speed at 10 m for DFIR snowfall>1 mm.
TCD
9, 2201–2230, 2015Precipitation measurement intercomparison in the Qilian Mountains
R. Chen et al.
Title Page
Abstract Introduction
Conclusions References
Tables Figures
◭ ◮
◭ ◮
Back Close
Full Screen / Esc
Printer-friendly Version Interactive Discussion
Discussion
P
a
per
|
Discussion
P
a
per
|
Discussion
P
a
per
|
Discussion
P
a
per
|
a
Annual snowfall(mm) Stations
Snowfall/Precipitation(%) Stations
b b a a
b
Figure 10. (a)Annual snowfall (mm) and(b)snowfall proportion (annual snowfall/annual pre-cipitation) in China.
TCD
9, 2201–2230, 2015Precipitation measurement intercomparison in the Qilian Mountains
R. Chen et al.
Title Page
Abstract Introduction
Conclusions References
Tables Figures
◭ ◮
◭ ◮
Back Close
Full Screen / Esc
Printer-friendly Version Interactive Discussion
Discussion
P
a
per
|
Discussion
P
a
per
|
Discussion
P
a
per
|
Discussion
P
a
per
|
Figure 11.Applicable regions for the Pit and the DFIR as reference gauges in China.