Atmos. Chem. Phys., 14, 11031–11063, 2014 www.atmos-chem-phys.net/14/11031/2014/ doi:10.5194/acp-14-11031-2014
© Author(s) 2014. CC Attribution 3.0 License.
A global model simulation of present and future nitrate aerosols and
their direct radiative forcing of climate
D. A. Hauglustaine1, Y. Balkanski1, and M. Schulz2
1Laboratoire des Sciences du Climat et de l’Environnement (LSCE), UMR8212, CEA-CNRS-UVSQ, Gif-sur-Yvette, France 2Norwegian Meteorological Institute, Blindern, Norway
Correspondence to:D. A. Hauglustaine ([email protected])
Received: 21 January 2014 – Published in Atmos. Chem. Phys. Discuss.: 14 March 2014 Revised: 21 August 2014 – Accepted: 5 September 2014 – Published: 21 October 2014
Abstract. The ammonia cycle and nitrate particle forma-tion are introduced into the LMDz-INCA (Laboratoire de Météorologie Dynamique, version 4 – INteraction with Chemistry and Aerosols, version 3) global model. An im-portant aspect of this new model is that both fine nitrate par-ticle formation in the accumulation mode and coarse nitrate forming on existing dust and sea-salt particles are consid-ered. The model simulates distributions of nitrates and re-lated species in agreement with previous studies and obser-vations. The calculated present-day total nitrate direct radia-tive forcing since the pre-industrial is−0.056 W m−2. This
forcing corresponds to 18 % of the sulfate forcing. Fine par-ticles largely dominate the nitrate forcing, representing close to 90 % of this value. The model has been used to investi-gate the future changes in nitrates and direct radiative forcing of climate based on snapshot simulations for the four repre-sentative concentration pathway (RCP) scenarios and for the 2030, 2050, and 2100 time horizons. Due to a decrease in fossil fuel emissions in the future, the concentration of most of the species involved in the nitrate–ammonium–sulfate sys-tem drop by 2100 except for ammonia, which originates from agricultural practices and for which emissions significantly increase in the future. Despite the decrease of nitrate surface levels in Europe and North America, the global burden of accumulation mode nitrates increases by up to a factor of 2.6 in 2100. This increase in ammonium nitrate in the future arises despite decreasing NOx emissions due to increased
availability of ammonia to form ammonium nitrate. The total aerosol direct forcing decreases from its present-day value of −0.234 W m−2 to a range of−0.070 to −0.130 W m−2
in 2100 based on the considered scenario. The direct forc-ing decreases for all aerosols except for nitrates, for which
the direct negative forcing increases to a range of −0.060 to−0.115 W m−2 in 2100. Including nitrates in the
radia-tive forcing calculations increases the total direct forcing of aerosols by a factor of 1.3 in 2000, by a factor of 1.7–2.6 in 2030, by 1.9–4.8 in 2050, and by 6.4–8.6 in 2100. These results show that the agricultural emissions of ammonia will play a key role in the future mitigation of climate change, with nitrates becoming the dominant contributor to the an-thropogenic aerosol optical depth during the second half of the 21st century and significantly increasing the calculated aerosol direct forcing. This significant increase in the influ-ence that nitrate exerts on climate in the future will at the same time affect regional air quality and nitrogen deposition to the ecosystem.
1 Introduction
The formation of ammonium nitrate particles in the atmo-sphere is a secondary process initiated by the oxidation of NO2 to nitric acid (HNO3)and by its further reaction with
ammonia (NH3). HNO3 can also be absorbed onto
exist-ing particulate matter to form coarse nitrate aerosols (Li and Shao, 2009). Nitrogen oxide emissions are mostly associ-ated with fossil fuel combustion (40 %), land use practices (15 %), and soil emissions (10 %) (Olivier et al., 1998). In contrast, global ammonia emissions into the atmosphere are dominated by agricultural practices (Bouwman et al., 1997). In western Europe and in the United States, as much as 90– 100 % of NH3 emissions result from animal and crop
acidic gases such as H2SO4to form ammonium (NH+4)
con-taining particles. Atmospheric nitrate particles have an ad-verse impact on health. In Europe, for instance, these parti-cles account today for about 10–20 % of the total dry aerosol mass (Putaud et al., 2004a; Schaap et al., 2004). These par-ticles also contribute to the deposition of nitrogen to the surface, with a cascade of adverse effects on terrestrial and aquatic ecosystems and possible consequences for the global carbon cycle (Gruber and Galloway, 2008). Moreover, nitrate particles have the potential to directly affect the earth’s radi-ation budget by reflecting solar radiradi-ation and climate through their effect on cloud formation and precipitation (Forster et al., 2007).
Several global models have been used to simulate the nitrate–ammonium–sulfate aerosol system and their impact on the present-day climate (e.g., van Dorland et al., 1997; Adams et al., 2001; Jacobson, 2001; Martin et al., 2004; Liao and Seinfeld, 2005; Myhre et al., 2006; Bauer et al., 2007; Bellouin et al., 2011; Xu and Penner, 2012). These earlier studies have reported direct radiative forcings rang-ing from −0.02 to −0.19 W m−2. The uncertainty on the
nitrate particle radiative forcing of climate remains high. Recently, Myhre et al. (2013) compiled the nitrate forc-ings calculated in the framework of AeroCom phase II by eight global models and derived a present-day direct radia-tive forcing for the most recent model versions ranging from
−0.03 to−0.17 W m−2and a mean of−0.10±0.04 W m−2.
For the Atmospheric Chemistry and Climate Model Inter-comparison Project (ACCMIP) historical simulations, Shin-dell et al. (2013) derived a direct forcing for nitrates rang-ing from −0.03 W m−2 to −0.41 W m−2, with a mean of −0.19±0.18 W m−2. Fewer studies have assessed the
fu-ture radiative forcing of nitrate particles. Adams et al. (2001), Liao and Seinfeld (2005), and Liao et al. (2009) investigated the future evolution of nitrates under the Special Report on Emissions Scenarios (SRES) A2 and derived a direct anthro-pogenic radiative forcing reaching −0.95 to−1.28 W m−2
in 2100. Bauer et al. (2007) also investigated the evolution of nitrates in 2030 with the Goddard Institute for Space Stud-ies (GISS) model following the SRES A1B emission sce-nario and calculated a steady increase in the nitrate nega-tive forcing from −0.5 W m−2 during the pre-industrial to −0.11 W m−2for the present and to−0.14 W m−2in 2030.
All these studies pointed out the steady increase of nitrate aerosols since industrialization and the associated direct ra-diative forcing of climate. They also suggest that the de-creased radiative forcing from sulfates particles in the fu-ture associated with reduced emissions of SO2could be
par-tially offset by the increased nitrate forcing since the for-mation of ammonium nitrates is favored at lower sulfate loadings. More recently Bellouin et al. (2011) included ni-trate aerosols in their future Coupled Model Intercomparison Project (CMIP) 5 simulations driven by the representative concentration pathway (RCP) scenarios and indicated that nitrates could become an important aerosol species in the
fu-ture, making the aerosol radiative forcing 2–4 times stronger by 2100 (in their study the nitrate forcing increases from
−0.2 W m−2in 2000 to−0.6,−0.4,−0.5 and−0.7 W m−2
by 2090 in scenarios RCP2.5, RCP4.5, RCP6.0 and RCP8.5, respectively).
In this paper, the atmospheric ammonia cycle and ni-trate particle formation are introduced into the LMDz-INCA global three-dimensional climate–chemistry model. Numer-ous detailed models have been developed in order to treat the partitioning of nitrate and ammonium between the gas phase and the aerosol phase assuming thermodynamical equilib-rium between phases (e.g., Pilinis and Seinfeld, 1987; Zhang et al., 2000; Metzger et al., 2002a; Metzger et al., 2006) or treating the dynamical mass transfer between each aerosol size bin explicitly (e.g., Pilinis et al., 2000; Jacobson, 1999; Sun and Wexler, 1998; Lauer et al., 2005). In order to apply these computationally expensive models at the global scale, several authors have chosen to apply parameterizations for the relationships between activity coefficients and relative humidity (Metzger et al., 2002a, b; Myhre et al., 2006; Bauer et al., 2007; Pringle et al., 2010) or to use a hybrid dynamic method (Feng and Penner, 2007; Xu and Penner, 2012). In this study, since the LMDz-INCA general circulation model is designed for long-term simulations, we also use a simpli-fied approach, and the phase equilibrium of the ammonium– sulfate–nitrate aerosol system is introduced for fine particles based on the simple thermodynamical formulation used ini-tially in regional acid deposition chemical transport models (Hov et al., 1988; Ackermann et al., 1995), in global chem-ical transport models (Tie et al., 2005) and more recently in an earth system model (Bellouin et al., 2011). In addition to this formation of fine nitrate particles in the accumula-tion mode, the role of nitric acid uptake on mineral dust and sea-salt particles to form coated coarse nitrate particles can also play an important role in the total nitrate and nitric acid budget in the atmosphere and hence on the radiative forcing (e.g., Liao and Seinfeld, 2005; Myhre et al., 2006; Bauer et al., 2007; Feng and Penner, 2007; Xu and Penner, 2012). The formation of coarse nitrate particles on dust and on sea-salt particles is introduced into LMDz-INCA, adopting a first-order irreversible removal. This method is computationally efficient and has often been used in global models (e.g., Den-tener and Crutzen, 1993; Bauer et al., 2004, 2007; Evans et al., 2005; Fairlie et al., 2010) despite the fact that limitations for this formulation exist (Feng and Penner, 2007). An eval-uation of the simulated aerosol distributions calculated with the LMDz-INCA model and of the optical depth and sur-face nitrate and sulfate depositions are performed. Based on the recent RCP CMIP5 emission scenarios, we then use the model to calculate the present-day and future anthropogenic direct radiative forcing of fine and coarse nitrate particles and to assess the relative contribution of nitrates to the aerosol optical depth and radiative forcing.
D. A. Hauglustaine et al.: A global model simulation of present and future nitrate aerosols 11033
ammonia and nitrate particles are described in Sect. 2. Section 3 presents the present-day global distributions of aerosols, the evaluation of the model results and the direct radiative forcing of aerosols. The results of the future simu-lations in terms of atmospheric composition, surface deposi-tion and direct radiative forcing of climate are presented in Sect. 4. Finally, Sect. 5 gives the summary and conclusions.
2 Model description
2.1 The LMDz-INCA model
We use the LMDz-INCA global chemistry–aerosol– climate model coupling online the LMDz (Laboratoire de Météorologie Dynamique, version 4) general circulation model (Hourdin et al., 2006) and the INCA (INteraction with Chemistry and Aerosols, version 3) model (Hauglustaine et al., 2004). The interaction between the atmosphere and land surface is ensured through the coupling of LMDz with the ORCHIDEE (ORganizing Carbon andHydrology In Dynamic Ecosystems, version 9) dynamical vegetation model (Krinner et al., 2005). In the present configuration, the model includes 19 hybrid vertical levels extending up to 4 hPa. This corresponds to a vertical resolution of about 300–500 m in the planetary boundary layer (first level at 70 m height) and to a resolution of about 2 km at the tropopause (with 7–9 levels located in the stratosphere). The horizontal resolution is 1.9◦ in latitude and 3.75◦ in longitude. The primitive equations in the general circulation model (GCM) are solved with a 3 min time step, large-scale transport of tracers is carried out every 15 min, and physical and chemical processes are calculated at a 30 min time interval. For a more detailed description and an extended evaluation of the GCM we refer to Hourdin et al. (2006). The large-scale advection of tracers is calculated based on a monotonic finite-volume second-order scheme (Van Leer, 1977; Hourdin and Armengaud 1999). Deep convection is parameterized according to the scheme of Emanuel (1991). The turbulent mixing in the planetary boundary layer is based on a local second-order closure formalism. The transport and mixing of tracers in the LMDz GCM have been investigated and evaluated against observations for both inert and radioactive tracers (e.g., Hourdin and Issartel, 2000; Hauglustaine et al., 2004; Rivier et al., 2005) and in the framework of inverse modeling studies (e.g., Bousquet et al., 2005; Pison et al., 2009; Bousquet et al., 2010). These studies concluded that the model at this vertical resolution is well suited for the transport of tracers and chemical species. However, it was also pointed out that the simulated interhemispheric exchange time is 1.1 years for fossil CO2 (Hauglustaine et al., 2004), in
the lowest part of the range (1.1–2.1 years) provided by the Atmospheric Tracer Transport Model Intercomparison Project (TransCom) intercomparison (Law et al., 1996). This
means that LMDz has some of the fastest interhemispheric mixing among the models of TransCom and hence efficient vertical mixing and transport of pollutants. INCA includes a state-of-the-art CH4/NOx/CO/NMHC/O3 tropospheric
photochemistry (Hauglustaine et al., 2004; Folberth et al., 2006). The tropospheric photochemistry and aerosols scheme used in this model version is described through a total of 123 tracers, including 22 tracers to represent aerosols. The model includes 234 homogeneous chemical reactions, 43 photolytic reactions, and 30 heterogeneous reactions. Please refer to Hauglustaine et al. (2004) and Folberth et al. (2006) for the list of reactions included in the chemical scheme. The gas-phase version of the model has been extensively compared to observations in the lower troposphere (e.g., Hauglustaine et al., 2004; Folberth et al., 2006; Fiore et al., 2009; Reidmiller et al., 2009) and in the upper troposphere (e.g., Brunner et al., 2003; Dufour et al., 2007). For aerosols, the INCA model simulates the distribution of aerosols with anthropogenic sources such as sulfates, black carbon, and particulate organic matter, as well as natural aerosols such as sea salt and dust. The aerosol model keeps track of both the number and the mass of aerosols using a modal approach to treat the size distribution, which is described by a superposition of five log-normal modes (Schulz et al., 1998; Schulz, 2007), each with fixed spread. To treat the optically relevant aerosol size diversity, particle modes exist for three ranges: submicronic (diameter < 1 µm) corresponding to the accumulation mode, micronic (diameter between 1 and 10 µm) corresponding to coarse particles, and super-micronic or super coarse particles (diameter > 10 µm). This treatment in modes is computationally much more efficient compared to a bin scheme (Schulz et al., 1998). Furthermore, to account for the diversity in chemical composition, hygroscopicity, and mixing state, we distinguish between soluble and insoluble modes. In both sub-micron and micron size, soluble and insoluble aerosols are treated separately. Sea salt, SO4,
and methane sulfonic acid (MSA) are treated as soluble components of the aerosol and dust is treated as insoluble, whereas black carbon (BC) and particulate organic matter (POM) appear both in the soluble and insoluble fractions. The ageing of primary insoluble carbonaceous particles transfers insoluble aerosol number and mass to soluble with a half-life of 1.1 days (Cooke and Wilson, 1996; Chung et al., 2002).
The uptake and loss of water from aerosol particles is gen-erally fast and depends on the chemical composition, size, and surface properties of the aerosol particle. Aerosol water is responsible for about 50 % of the global aerosol column load. This water uptake modifies the aerosol optical proper-ties. We use a formulation of the optical depth,τ, first imple-mented by Chin et al. (2002) to writeτ as a function of the aerosol dry burdenMd(kg m−2):
whereβ, the specific extinction (m2kg−1), is computed as
follows:
β=3QM/4ρreMd, (2)
whereQis the extinction coefficient (dimensionless) com-puted using Mie theory,M, is the aerosol burden per unit area (kg m−2),ρ is the particle density (kg m−3), andr
e, the
ef-fective radius (m). As relative humidity increases, this equa-tion has to be modified to account for the presence of water. The density is then recomputed as the mass-weighted sum of the dry density of the aerosol and the density of water. The refractive index, hence the extinction, is also changed to ac-count for water.
The optical properties and hygroscopic growth of sea salt were taken from Irshad et al. (2005). For sulfates, we fol-lowed the relationships published for ammonium sulfate by Martin et al. (2003). In the case of black carbon and or-ganic carbon, we took the same dependence of hygroscopic growth on relative humidity as Chin et al. (2002). The aerosol scheme is thoroughly explained in Schulz (2007) and Balka-nski (2011). Characteristic global aerosol properties of the INCA model have been described and compared in all Ae-roCom publications, as for instance recently in Myhre et al. (2013) and Koffi et al. (2012). We also refer to Szopa et al. (2012) for a simulation of the global aerosol components (excluding nitrates) and tropospheric ozone distributions and their associated radiative forcings between 1850 and 2100 following a recent historical emission data set (Lamarque et al., 2010) and under the representative concentration path-ways (RCP) (Lamarque et al., 2011) for the future with the same version of this model.
2.2 Ammonia and nitrate particles
The LMDz-INCA chemical scheme has been extended in or-der to include the ammonia cycle and the nitrate particle for-mation. The various NH3 emissions have been introduced
into the model as described in the next section. Ammonia undergoes several gas-phase reactions which have been in-troduced into the model chemical mechanism:
NH3+OH→NH2+H2, (R1)
NH3+O1D→NH2+OH, (R2)
NH2+NO2→N2O+H2O, (R3)
NH2+HO2→NH3+O2, (R4)
NH2+NO→N2+H2O, (R5)
NH2+O3→NH2O+O2, (R6)
NH2+O2→NO+H2O, (R7)
NH2O+O3→NH2+2O2, (R8)
NH2O+NO→NH2+NO2. (R9)
The rate constants for these reactions are taken from Sander et al. (2011).
The most abundant acids in the troposphere are sulfuric acid (H2SO4)and nitric acid (HNO3). Ammonia acts as the
main neutralizing agent for these two species. Therefore, for-mulating the respective aerosol particle formation scheme as a purely sulfate–nitrate–ammonia system seems to be a rea-sonable assumption for a global chemistry–aerosol–climate model. However, we also remove nitric acid through reaction with sea salt and dust, as described below. As a first step, ammonium sulfate is formed instantaneously and irreversibly from NH3and H2SO4, only limited by the availability of the
less abundant of the two species. The concentration of NH3
and SO4are depleted upon formation of ammonium sulfate
which takes priority over ammonium nitrate formation due to the low vapor pressure of sulfuric acid:
NH3+H2SO4→(NH4)HSO4, (R10a)
3NH3+2H2SO4→(NH4)3H(SO4)2, (R10b)
2NH3+H2SO4→(NH4)2SO4. (R10c)
As in Metzger et al. (2002), three domains are considered to characterize the neutralization state of the ammonium sulfate ion formed, depending on the relative ammonia and sulfate concentrations. The total nitrate (TN), total ammonia (TA),
and total sulfate (TS)concentrations are defined as
TN= [HNO3] + [NO−3], (3) TA= [NH3] + [NH+4], (4)
TS= [SO=4]. (5)
If TA> 2TS, ammonia rich condition (sulfate state Ŵ=
2.0), the reaction pathway is provided by the chemical Reac-tion (R10c); if TA< 2 TS, sulfate rich condition (sulfate state Ŵ=1.5), Reaction (R10b) is considered; and ifTA<TS,
sul-fate very rich condition (sulsul-fate stateŴ=1.0), the reaction occurs through Reaction (R10a).
In a second step, if all free ammonia is consumed by the sulfate forming reaction, no ammonium nitrate is formed. If free ammonia persists, it is used for the neutralization of ni-tric acid to ammonium nitrate aerosol following the equilib-rium reaction:
HNO3+NH3↔NH4NO3. (R11)
The equilibrium constant (Kp)of Reaction (R11) strongly
D. A. Hauglustaine et al.: A global model simulation of present and future nitrate aerosols 11035
Mozurkewich (1993), and the deliquescence relative humid-ity is calculated based on Seinfeld and Pandis (1998) (see Supplement for more details).
The equilibrium concentration of ammonium nitrate is then calculated based on Seinfeld and Pandis (1998). The free ammonia in the system is defined as the total ammo-nia minus the ammoammo-nia required to neutralize the available sulfate:
TA∗=TA−ŴTS. (6)
IfTNTA∗>Kp, the ammonium nitrate concentration is
cal-culated according to
[NH4NO3] =
1 2
TA∗+TN− q
TA∗+TN2−4 TNT∗A−Kp
.
(7) Elsewhere, ammonium nitrate dissociates and [NH4NO3]=0. The concentration of NH3 and HNO3
are depleted or replenished to account for ammonium nitrate formation or dissociation, respectively. The chemical formation of ammonium sulfate particles according to Reaction (R10) and of ammonium nitrate particles accord-ing to Reaction (R11) goes into the accumulation mode. The formation of nitrates through Reaction (R11) is also associated with a corresponding increase in the number of particles in the accumulation mode, reflecting the formation of new ammonium nitrate particles. This thermodynamic model has been run as a box model and the results carefully evaluated against the reference model ISORROPIA version 2.1 (Nenes et al., 1998). For this evaluation, the main parameters controlling the nitrate and ammonium aerosol concentrations have been varied over specified intervals and the calculated concentrations compared to ISORROPIA results. An excellent agreement between both model results has been achieved over the range of key parameters currently encountered in the global model version, with some larger variations (> 20 %) at temperatures higher than 295K (see Supplement for more details).
Gaseous HNO3can condense on both accumulation mode
and coarse particles. As in Myhre et al. (2006), numeri-cally, photochemistry and formation of accumulation mode aerosols are first solved because the smaller particles reach equilibrium faster than the larger ones. After the small parti-cles are in equilibrium, the concentration of gaseous HNO3
is updated for the condensation on coarse particles. We ac-count for the heterogeneous reaction of HNO3with dust and
sea-salt particles:
HNO3+NaCl→NaNO3+HCl, (R12)
2HNO3+CaCO3→Ca(NO3)2+H2CO3. (R13)
We use a standard first-order reactive uptake parameteri-zation to represent the uptake of HNO3on pre-existing dust
and sea-salt particles in the model and formation of coarse nitrate particles (Dentener and Crutzen, 1993; Bauer et al., 2004; Fairlie et al., 2010). The rate constantsk12andk13 of
Reactions (R12) and (R13), which describe the loss of HNO3
from the gas phase, are calculated from (Schwartz, 1986)
k12,13=
rf
Z
ri
4π r2N (r)
r
Dg + 4
υγ
−1
dr, (8)
where N is the number density of dust or sea-salt parti-cles of radius [r, r+dr], Dg is the calculated,
pressure-and temperature-dependent, molecular diffusion coefficient (cm2s−1), υ the calculated, temperature-dependent, mean
molecular speed (cm s−1), andγ the reactive uptake
coeffi-cient. Equation (8) is integrated fromri=0.01 torf=30 µm.
As mentioned by Feng et al. (2007), a major limitation of this first-order formulation is the lack of relative humidity de-pendence for the uptake. To partly overcome this limitation, for the reaction on dust particles, we use the RH-dependent uptake coefficient proposed by Fairlie et al. (2010). Based on this RH dependence,γ increases from 1×10⁻⁵for RH
lower than 10 % up to 1.05×10⁻³for RH larger than 80 %.
Another limitation mentioned by Feng et al. (2007) is the lack of dependence of the uptake coefficient on the aerosol chemical composition. As in Fairlie et al. (2010), we in-troduce a Ca2+ limitation for the uptake of HNO
3 on dust
through Reaction (R13). Based on dust source maps (Claquin et al., 1999), it is assumed than Ca2+ constitutes 5 % of the dust mass. Dust alkalinity is then consumed by the uptake of HNO3. Once the alkalinity is titrated by the formation of
nitrates, the uptake of HNO3through (R13) ceases. For
sea-salt particles, the same dependence is used for theγincrease with RH. The values are scaled to the accommodation coeffi-cients compiled by Sander et al. (2011) andγincreases from 1×10⁻³for RH lower than 10 % up to 1×10⁻¹for RH larger
than 80 %. No alkalinity limitation is considered for sea-salt particles.
These new gaseous species and particles introduced into the model to represent the ammonia cycle, the formation of ammonium sulfate, ammonium nitrate, and coarse nitrates on dust and sea salt are subject to the same transport and mixing processes as the other tracers in the model. The dry and wet deposition of NH3 is introduced as described by
Hauglus-taine et al. (2004), with a Henry’s law coefficient taken from Sander et al. (2011). Ammonium nitrate and ammonium sul-fate are subject to the same dry and wet deposition processes as sulfate particles already in the model, and coarse nitrates on dust and sea salt are deposited as the corresponding dust and sea-salt components, respectively.
intervals. Gosse et al. (1997) measured the refractive index of ammonium nitrate from 0.7 to 2.6 µm, whereas Jarzembski et al. (2003) covered the far visible to the infrared wavelengths from 2.0 to 20 µm. Values of specific extinction, asymme-try parameter and single scattering albedo were tabulated for eleven values of relative humidities: from 0 to 90 % in 10 % increments and finally for the 95 % value. For a given rela-tive humidity, we interpolate between the two closest values; if relative humidity exceeds 95 %, then we take for optical parameters the values deduced from the Mie theory at 95 % relative humidity.
2.3 Model setup
For the simulation of “present” (2000) and “pre-industrial” (1850) conditions, the anthropogenic emissions compiled by Lamarque et al. (2010) are added to the natural fluxes used in the INCA model. All natural emissions are kept at their present-day levels. For organic aerosols, the secondary or-ganic matter formed from biogenic emissions is equal to that provided by the AeroCom emission data set (Dentener et al., 2006a). The ORCHIDEE vegetation model has been used to calculate offline the biogenic surface fluxes of isoprene, terpenes, acetone, and methanol, as well as NO soil emis-sions as described by Lathière et al. (2006). NH3emissions
from natural soils and ocean are taken from Bouwman et al. (1997). Natural emissions of dust and sea salt are com-puted using the 10 m wind components from the European Centre for Medium-Range Weather Forecasts (ECMWF) re-analysis for 2006 and, consequently, have seasonal cycles but no interannual variability. For the future simulations (2030, 2050, 2100), the four representative concentration pathways (RCP) anthropogenic and biomass burning emissions pro-vided by Lamarque et al. (2011) are used. Methodological elements used to build these projections can be found in Lamarque et al. (2011). Natural emissions for both gaseous species and particles are kept to their present-day level as described above. Table 1 gives the list of simulations per-formed and the corresponding total and global emissions of key species discussed in this paper. In all RCP scenarios, fos-sil fuel-driven emissions, NOx, SO2, BC, and organic carbon
(OC), decrease in 2100 compared to 2000 emissions. It is, however, interesting to note that NH3emissions, driven by
agriculture, increase in all scenarios from 50 Tg N in 2000 to 54–79 Tg N in 2100 depending on the considered scenario. As will be discussed in the next sections, this feature will have major implications in terms of the nitrate future radia-tive forcing of climate.
In this study, meteorological data from the ECMWF re-analysis have been used. The relaxation of the GCM winds towards ECMWF meteorology is performed by applying at each time step a correction term to the GCMuandvwind components with a relaxation time of 2.5 h (Hourdin and Is-sartel, 2000; Hauglustaine et al., 2004). The ECMWF fields are provided every 6 h and interpolated onto the LMDz grid.
Table 1.Total (anthropogenic plus natural) and global emissions of
NOx and NH3 (Tg N yr−1), SO2 (Tg S yr−1), black carbon (BC) and organic carbon (OC) (Tg yr−1) for the various simulations per-formed in this study.
Scenario NOx NH3 SO2 BC OC
1850 10 21 10 3 22
2000 46 50 59 8 36
2030 RCP2.6 39 62 35 7 36
2050 RCP2.6 36 67 22 5 30
2100 RCP2.6 24 79 14 3 25
2030 RCP4.5 42 56 49 7 29
2050 RCP4.5 36 57 32 6 27
2100 RCP4.5 24 54 18 4 19
2030 RCP6.0 40 57 45 7 36
2050 RCP6.0 37 64 43 7 36
2100 RCP6.0 23 72 17 4 32
2030 RCP8.5 48 63 48 7 33
2050 RCP8.5 40 69 32 6 30
2100 RCP8.5 31 78 20 4 24
Sensitivity simulations
2100 RCP4.5-NOx 31 54 18 4 19
2100 RCP4.5-NH3 24 78 18 4 19
2100 RCP4.5-SO2 24 54 59 4 19
We focus this work on the distribution of nitrate particles, its evolution under future anthropogenic emissions, and its direct radiative forcing of climate. In order to isolate the im-pact of anthropogenic emission scenarios, all snapshot sim-ulations are performed under present-day climate conditions and run for a period of 2 years. Therefore, ECMWF meteoro-logical data for 2005–2006 are used. The results for the year 2005 are used as a spin-up. Results for 2006 conditions are presented in the next sections. The impact of climate change on particles and chemistry is therefore not included in the results. The role played by climate change and the impact of nitrate on the indirect aerosol radiative forcing of climate will be investigated in a forthcoming study.
3 Present-day distributions 3.1 Simulated aerosol distributions
In this section we present the distributions of gaseous species and aerosols involved in the formation of nitrate particles. Figure 1 shows the present-day annual mean surface con-centration of sulfates (SO=
4), ammonium (NH
+
4), and
to-tal (fine plus coarse) nitrates (NO−3)aerosols. Please note that all concentrations and burdens are expressed in the following sections in mass of the species (e.g., µg m−3
D. A. Hauglustaine et al.: A global model simulation of present and future nitrate aerosols 11037
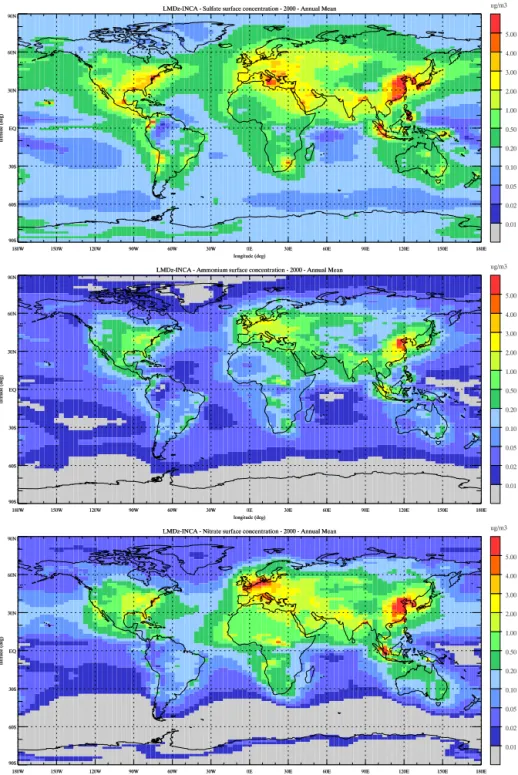
Figure 1.Annual mean surface concentration of (top) sulfate aerosols, (middle) ammonium aerosols, and (bottom) total nitrate aerosols
simulated for present-day conditions (µg m−3).
µg S m−3). Maximum sulfate concentrations are calculated
over regions of high SO2 emissions with marked maxima
reaching 4–5 µg m−3 over the eastern United States,
south-ern and eastsouth-ern Europe, and China. The concentration of monium (associated both with ammonium sulfate and am-monium nitrate) is localized over continental regions and reaches maxima of 1–2 µg m−3 over the central and
east-ern United States, 2–3 µg m−3 in northern Europe, and 4–
5 µg m−3 in northern China. These regions combine both
high concentrations of sulfates and nitric acid but also high agricultural emissions of NH3. The distribution of surface
northern Europe and China, with concentrations reaching 4– 5 µg m−3. The patterns of these surface distributions for the
three aerosol components are in general agreement with the recent global model results presented by Pringle et al. (2010) and Xu and Penner (2012) and with the nitrate distributions calculated by Myhre et al. (2006) and Bauer et al. (2007).
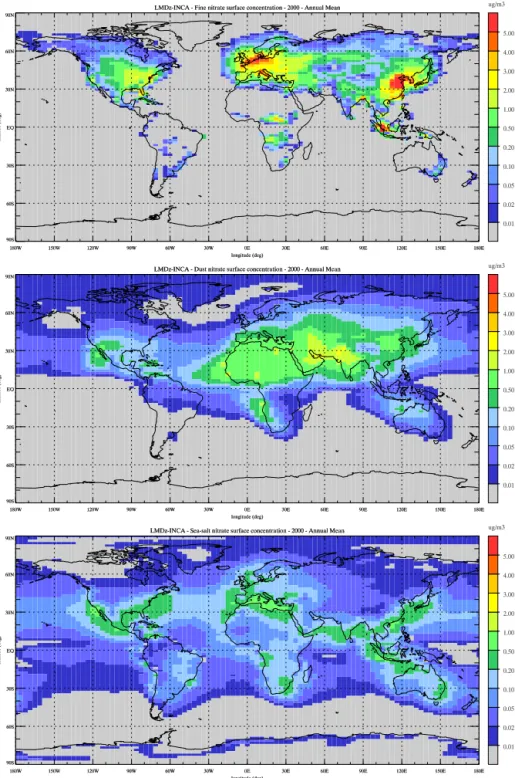
Figure 2 decomposes the total surface nitrate concentra-tion shown in Fig. 1 into its three components: accumulaconcentra-tion mode, coarse mode on dust particles and coarse mode on sea-salt particles. The conditions for fine-mode nitrate particle formation (expressed by Eq. 7) are met over the continents and maximum concentrations are calculated, as already seen in Fig. 1, over regions of high agricultural emissions of NH3
or high HNO3concentrations. Coarse nitrate on dust follow
the distribution of dust particles in the model (Bauer et al., 2004). High concentrations reaching more than 0.5 µg m−3,
and locally up to 1–3 µg m−3, are calculated over the Sahara
and the Arabian Peninsula and extend to the Mediterranean Sea and southern Europe; over the western United States and over China. In contrast, coarse nitrate on sea-salt reaches concentrations of 0.5–1 µg m−3in coastal areas where high
concentrations of sea salt and nitric acid are met. These two coarse nitrate components add up to a total of about 0.1– 0.2 µg m−3 over the ocean. Over the continents, fine-mode
nitrates significantly dominate over source regions. However, in coastal regions or in southern Europe all components mix, and coarse nitrates can contribute to 30–40 % to the total con-centration in these specific areas. The pattern of the calcu-lated distribution of coarse nitrates on dust and sea salt is in fairly good agreement with the results presented by Myhre et al. (2006), Bauer et al. (2007), and Xu and Penner (2012).
In order to evaluate the model results, we have compared the simulated and measured surface concentrations of SO=4, NH+4, and NO−3 from the EBAS database at the Norwegian Institute for Air Research (NILU). EBAS holds data from the European Monitoring and Evaluation Programme (EMEP) (emep.int), from the US National Atmospheric Deposi-tion Program/NaDeposi-tional Trend Network (NADP/NTN; http: //nadp.sws.uiuc.edu/NTN), from the US Interagency Moni-toring of Protected Visual Environments (IMPROVE; http:// vista.cira.colostate.edu/IMPROVE), from the Clean Air Sta-tus and Trends Network (CASTNET; http://java.epa.gov/ castnet), and the EANET, Data on the Acid Deposition in the East Asian Region (http://www.eanet.cc/). These com-parisons have been prepared using the AeroCom evaluation tools (Schulz et al., 2006). The aerosols measurements are mostly from the CASTNET/IMPROVE network over North America and from the EMEP network in Europe. This evalu-ation is performed for the year 2006 based on matching daily mean data, averaged to monthly means. Table 2 summarizes the comparison with the measurements (see Supplement for individual plots per region and per species). For SO=
4, the
normalized mean bias (difference between the arithmetic mean of the model minus the arithmetic mean of the
mea-surements relative to the mean meamea-surements) is+20 % for Europe and+21 % for North America. Worldwide, the nor-malized mean bias (NMB) is+20 %. For ammonium con-centrations, the evaluation shows that NH+4 is overestimated worldwide with a NMB of+50 %. Over Europe, the NMB is+62 % and, in contrast, NH+4 is slightly underestimated over North America with a NMB of −16 %. For nitrate concentrations, a worldwide overestimate is obtained with a NMB of+68 %. The comparison with the measurements are more contrasted over the two regions, with a smaller bias but smaller correlation over Europe (NMB= +64 %,R=0.43) than over North America (NMB= +115 %,R=0.54). For NO−3, the bias is mainly driven by an overestimate of ob-served concentrations in summer (NMB= +143 %, world-wide) compared to winter (NMB= +22 %). These compar-isons are fairly good considering the difficulty of repre-senting station measurements with a large-scale atmospheric model. The comparison made for a specific year (2006) us-ing an emission inventory representative of the year 2000 is also a source of bias, which we estimate to be on the order of 10–30 % for European and American sites (Schulz et al., 2013). These results are generally in line with the compar-isons obtained with more detailed aerosol models (Adams et al., 1999; Park et al., 2004; Pringle et al., 2010; Xu et al., 2012; Zhang et al., 2012; Heald et al., 2012) or with a model of the same complexity (Bellouin et al., 2011). In particular, these studies showed the difficulty of representing nitrates particles, which are currently overestimated by a factor of two at the surface, by the global models due to the coarse model resolution, the simplified aerosol chemistry, and the limitations associated with the representation of physics and transport in those models. In addition, it should be noted that a positive bias in simulated nitrate aerosol is suspected to be partly linked to negative sampling artifacts in measure-ments because evaporation of ammonium nitrate has been frequently reported to create occasional losses of up to 50 %, particularly in warm weather (see Supplement for more de-tails). Further work is needed to better characterize the indi-vidual nitrate measurement error to see where modeled ni-trate is consistent with measurements.
D. A. Hauglustaine et al.: A global model simulation of present and future nitrate aerosols 11039
Figure 2.Annual mean surface concentration of (top) fine-mode nitrate aerosols, (middle) mode nitrates on dust, and (bottom)
coarse-mode nitrates on sea-salt simulated for present-day conditions (µg m−3).
nitrate instability at higher temperatures superimposed on a variability associated with meteorological conditions and to transport of pollution episodes. The simulated concentrations of nitrates, their diurnal cycle, and day-to-day variability are generally in line with diurnally resolved monitoring data (see Supplement).
Figure 3 shows the column burden of SO=
4, NH
+
4, and
to-tal NO−3. The sulfates column reaches more than 3 mg m−2
over the continents in the Northern Hemisphere. In the east-ern US and northeast-ern and central Europe, the column reaches more than 5 mg m−2. The maximum column of more than 10 mg m−2is reached over China. These values are slightly
Table 2.Normalized mean bias (NMB, %) and correlation coefficient (R) of model results versus EBAS measurements for the year 2006 and for various regions and worldwide for surface concentrations of SO4, NH4, and NO3, wet deposition of SOx, NHx, and NOy, and simulated total aerosol optical depth at 550 nm compared to AERONET data.
Europe North Eastern Northern Worldwide America Asia Africa
Concentrations (µg S-N m−3)
SO4 NMBR 20 %0.58 21 %0.68 N.A. N.A. 20 %0.66 NH4 NMB 62 %R0.43 −0.7716 % N.A. N.A. 50 %0.51 NO3 NMBR 64 %0.43 115 %0.54 N.A. N.A. 68 %0.59
Wet deposition (µg S-N m−2yr−1)
SO4 NMB −27 % −20 % −80 % N.A. −59 %
R 0.47 0.70 0.60 0.31 NHx RNMB −0.334.5 % −0.4632 % −0.4260 % N.A. −0.2434 % NOy NMBR −0.4928 % 13 %0.73 −0.2454 % N.A. −0.1940 %
Total aerosol optical depth
AOD NMB 6 % −4.5 % −10 % −39 % −11 %
R 0.58 0.77 0.66 0.64 0.57
continents by Pringle et al. (2010) with a more complex aerosol microphysics and partitioning model. The global mean column burden for SO=
4 is 2.5 mg m
−2, in the
up-per range of the recent model intercomparison by Myhre et al. (2013), who reported a mean burden of 1.9±0.5 mg m−2.
The evaluation of the aerosol optical depth will be impor-tant for evaluating those results (see below). The column burden of NH+4 reaches 1–3 mg m−2 over source regions
in the Northern Hemisphere. Maximum values reaching 5– 10 mg m−2 are calculated over northern China. This
distri-bution is very close to the burden calculated by Pringle et al. (2010) but exhibits somewhat lower maximum values. The global mean burden for NH+4 is 0.54 mg m−2. The
to-tal (coarse plus fine) nitrate aerosol column shows a strong maximum of 5–10 mg m2 over northern and southern
Eu-rope, India, China, and Africa. A secondary maximum of 3–4 mg m−2 is also calculated over the central US. This
distribution is in agreement with the burden illustrated by Myhre et al. (2006) and Pringle et al. (2010). The global mean total nitrate burden is 1.56 mg m−2. Fine nitrate
par-ticles associated with anthropogenic emissions contribute, to a large extent, to the maximum calculated in the cen-tral US, northern Europe and over the Po Valley, in north-ern India and in China. Over Africa, Saudi Arabia, central Europe, and in northern China, nitrates on dust contribute more than 4–10 mg m−2to the nitrate column (see
Supple-ment). Over the Mediterranean and in southern Europe, the contribution of coarse nitrates on dust represents about 50 %
of the calculated total nitrate column, a proportion in agree-ment with the measureagree-ments by Putaud et al. (2004b). These results are in line with the fine and coarse particles plumes calculated by Fairlie et al. (2010) off the coast of China. The contribution of nitrates on sea salt is lower and gener-ally close to 0.5 mg m−2over the continents. It only reaches
1 mg m2in localized areas, in particular off the coast of the eastern US or over the Mediterranean where both pollu-tion and sea-salt particles are present. This is somewhat in contrast with Myhre et al. (2006), who calculated a larger and more localized contribution of sea salt to the total ni-trate column over northern Europe reaching more than 1– 1.5 mg m−2. The global mean burden of fine-mode nitrate is
0.44 mg m−2. Nitrates on dust and on sea salt contribute, re-spectively, 0.65 mg m−2and 0.48 mg m−2 to the coarse
ni-trate global burden. This corresponds to a relative contribu-tion of fine-mode nitrates of 28 % of the total nitrate burden in this model, to be compared to the 21 % calculated by Bauer et al. (2007) and to the 23 % calculated by Xu and Penner (2012).
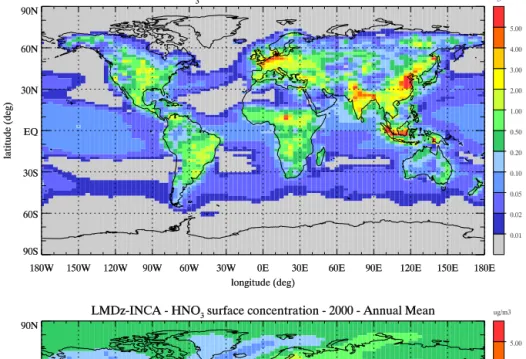
As discussed in Sect. 2, the formation of fine nitrate parti-cles depends on both the ammonia and nitric acid concentra-tions. Figure 4 shows the annual mean surface concentration of NH3and HNO3. The concentration of ammonia reaches
more than 1–2 µg m−3where agricultural emissions are high,
D. A. Hauglustaine et al.: A global model simulation of present and future nitrate aerosols 11041
Figure 3.Annual mean tropospheric column of (top) sulfate aerosols, (middle) ammonium aerosols, and (bottom) total nitrate aerosols
simulated for present-day conditions (mg m−2).
than 5 µg m−3. Biomass burning also contributes to higher
concentrations in Indonesia, Africa, and South America. This distribution is very much in line with the column density measured by the infrared atmospheric sounding interferom-eter (IASI) instrument (Clarisse et al., 2009) and a more de-tailed and quantitative evaluation of the NH3results with the
remote sensing data will be presented in forthcoming
stud-ies. Nitric acid shows high concentrations of 3–5 µg m−3in
regions of high anthropogenic NOxemissions. This is
partic-ularly the case over the eastern United States and to a lesser extent in California. In Europe, the concentration reaches 1– 2 µg m−3with a marked maximum over the Mediterranean
Figure 4.Annual mean surface concentration of (top) ammonia and (bottom) nitric acid simulated for present-day conditions (µg m−3).
al., 2004; Folberth et al., 2006), although in a model version without a particle formation loss term, which we estimate in budget calculations to be approximately one-third, see below. These distributions are in very good agreement with the re-sults shown for instance by Xu and Penner (2012). These cal-culated surface concentrations of nitrate precursors explain the distribution of fine nitrate particles illustrated in Fig. 1 and the region of formation where both NH3and HNO3
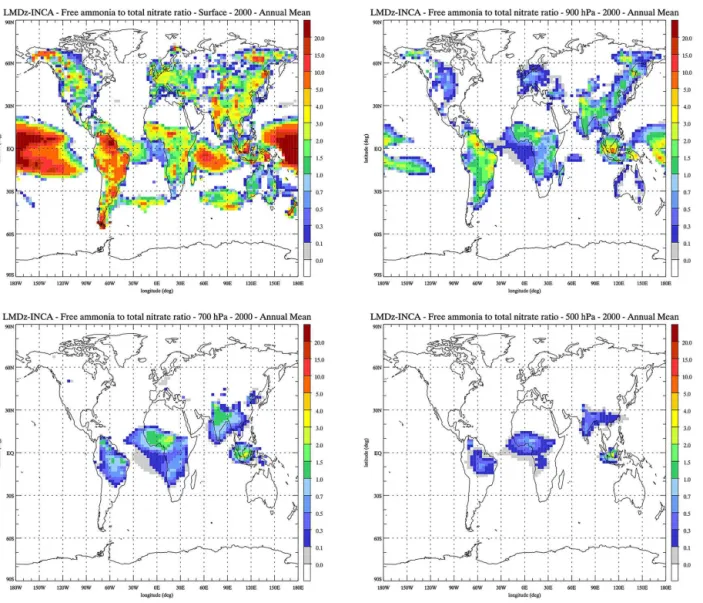
con-centrations are high. To enable comparison with Xu et Penner (2012), Fig. 5 shows the ratio of free ammoniaTA∗to total ni-trateTN (see Reaction 6 for the definition of TA∗). Regions
with a negative ratio represent the regions where no excess ammonia is present either due to very low ammonia con-centrations or high sulfates concon-centrations. In these regions, all the ammonia is used to neutralize the sulfates and form ammonium sulfate. At the surface, these regions are mostly encountered over the ocean or over the deserts and remote
continental areas. Due to the short lifetime of ammonia (less than 1 day), these regions expand as altitude increases. In the middle troposphere, only small fine nitrate formation re-gions persist in convective and biomass burning areas sub-ject to rapid upward transport of emissions. A ratio larger than 1 corresponds to regions where ammonia is abundant and hence the formation of nitrate is limited by the amount of nitric acid available. This condition is mostly met at the surface over regions with high ammonia concentrations, in northern Europe, the central US, India, China, and biomass burning regions. This is also the case over the ocean where natural oceanic NH3emissions are present in a low NOx
D. A. Hauglustaine et al.: A global model simulation of present and future nitrate aerosols 11043
Figure 5.Ratio of annual mean free ammonia to total nitrate, calculated for present-day conditions at the surface, 900, 700, and 500 hPa.
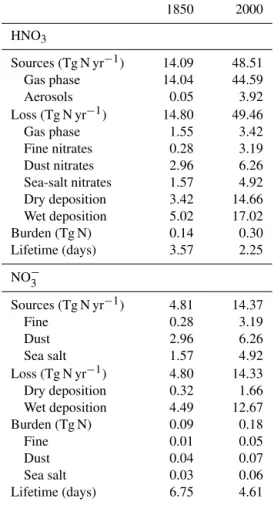
Table 3 gives the global budget of nitric acid and nitrate particles for both the present-day (2000) and pre-industrial (1850) conditions. A similar budget has been presented by Xu and Penner (2012), and we refer to their study for the sake of comparison with our results. It should be mentioned though that Xu and Penner (2012) used a simplified nitrogen chemistry with fixed monthly mean fields of OH and O3and
without considering the role of organics on gas-phase nitro-gen chemistry. For the present, we calculate a total source of HNO3of 48.5 Tg N yr−1mostly arising (44.6 Tg N yr−1)
from the gas-phase reaction of NO2with OH. The
heteroge-neous formation of HNO3 from the reaction of N2O5with
sulfate aerosols contributes only 3.9 Tg N yr−1 (or 8 %) of
total nitric acid formation. This is in contrast to Xu and Pen-ner (2012), who calculated a larger contribution of hetero-geneous chemistry of 42 %. The reason for this disagree-ment is unclear. The fact that a simplified nitrogen chem-istry that did not consider the role played by non-methane hydrocarbons was used in Xu and Penner (2012), as it was
also the case in Bauer et al. (2004), is a possible cause for this difference. It is also unclear which types of aerosols were considered in Xu and Penner (2012) for N2O5
hydrol-ysis. In our model, only the hydrolysis on sulfate aerosols is considered (loss on other types of aerosols or cloud par-ticles were not considered). Also, as pointed out by Evans and Jacob (2005), the impact of N2O5hydrolysis on global
chemistry is still uncertain and dependent on the accommo-dation coefficient used in the models. The accommoaccommo-dation coefficient varies among the various studies and could also explain this different in HNO3heterogenous formation. The
total loss of HNO3reaches 49.5 Tg N yr−1. The small
unbal-ance between source and loss arises from the stratospheric input of nitric acid into the considered domain for this bud-get (up to 200hPa). Dry and wet deposition contribute about equally (respectively, 14.7 and 17.0 Tg N yr−1) to the total
ni-tric acid deposition loss, representing more than 60 % of the total HNO3loss. The total loss through nitrate formation
Table 3.Tropospheric budget of nitric acid (HNO3)and nitrate par-ticles (NO−3)for the pre-industrial (1850) and present-day (2000) simulations. The budget terms for HNO3 are integrated up to 200 hPa.
1850 2000
HNO3
Sources (Tg N yr−1) 14.09 48.51
Gas phase 14.04 44.59
Aerosols 0.05 3.92
Loss (Tg N yr−1) 14.80 49.46
Gas phase 1.55 3.42
Fine nitrates 0.28 3.19
Dust nitrates 2.96 6.26
Sea-salt nitrates 1.57 4.92 Dry deposition 3.42 14.66 Wet deposition 5.02 17.02
Burden (Tg N) 0.14 0.30
Lifetime (days) 3.57 2.25
NO−3
Sources (Tg N yr−1) 4.81 14.37
Fine 0.28 3.19
Dust 2.96 6.26
Sea salt 1.57 4.92
Loss (Tg N yr−1) 4.80 14.33
Dry deposition 0.32 1.66
Wet deposition 4.49 12.67
Burden (Tg N) 0.09 0.18
Fine 0.01 0.05
Dust 0.04 0.07
Sea salt 0.03 0.06
Lifetime (days) 6.75 4.61
OH contribute 3.4 Tg N yr−1. These terms are in line with
Xu and Penner (2012) with a larger contribution of dry de-position in LMDz-INCA. The HNO3tropospheric burden is
0.3 Tg N, a value similar to Xu and Penner (2012), and the burden lifetime (burden divided by total loss rate) is 2.25 days in this model, to be compared to a burden lifetime of 2.59 days derived from their budget. Fine-mode ammonium nitrate formation constitutes 22 % of the total source of ni-trates (14.4 Tg N yr−1) and the rest is from the formation of
coarse nitrates on dust and sea salt. Most of the nitrate loss is caused by wet deposition (12.7 Tg N yr−1). We calculate a
total nitrate burden of 0.18 Tg N, with 28 % corresponding to the fine mode and the rest as coarse particles on dust and sea salt. The corresponding lifetime is 4.61 days. The burden of NO−3 in the troposphere has doubled since the pre-industrial, and its lifetime has decreased from a pre-industrial value of 6.75 days to its present-day value, reflecting the more effi-cient scavenging of accumulation-mode nitrate particles.
Table 4 summarizes the global budget of ammonia and ammonium. The only source of atmospheric NH3 is
sur-face emissions, totaling 50.5 Tg N yr−1for the present-day.
Table 4. Tropospheric budget of ammonia (NH3) and
ammo-nium particles (NH+4)for the pre-industrial (1850) and present-day (2000) simulations.
1850 2000
NH3
Sources: emissions (Tg N yr−1) 20.99 50.51
Loss (Tg N yr−1) 20.98 50.47
Gas phase 0.28 0.63
Ammonium formation 5.14 17.46
Dry deposition 9.67 21.33
Wet deposition 5.89 11.05
Burden (Tg N) 0.05 0.09
Lifetime (days) 0.81 0.63
NH+4
Sources: ammonia conversion (Tg N yr−1) 5.14 17.46
Loss (Tg N yr−1) 5.13 17.42
Dry deposition 0.32 2.50
Wet deposition 4.81 14.91
Burden (Tg N) 0.08 0.22
Lifetime (days) 5.39 4.52
The deposition of ammonia arises from dry (11.0 Tg N yr−1)
and wet deposition (21.3 Tg N yr−1). The formation of
ammonium sulfate and ammonium nitrate contributes 17.5 Tg N yr−1(35 %) to the total loss of NH
3. The gas-phase
chemistry oxidation of NH3contributes a negligible amount
to its loss. The loss of NH3through this oxidation pathway
is, however, a source of N2O for roughly a similar amount
of 0.6 Tg N yr−1. This number is similar to the estimate by
Dentener and Crutzen (1994), who estimated a source of 0.6 Tg N yr−1with an uncertainty range of 0.4–1.2 Tg N, and
it represents about 10 % of the anthropogenic source of N2O
as pointed out by these authors. This value is also in the range of 0–1.6 Tg N estimated by Lee et al. (1997). The burden of NH3 has increased from 0.05 Tg N in the pre-industrial
to 0.09 Tg N for the day. The corresponding present-day lifetime of ammonia in the atmosphere is 0.63 present-days. The only source of NH+4 is ammonium sulfate and ammonium ni-trate formation (17.5 Tg N yr−1). The loss arises mostly from
wet deposition (14.9 Tg N yr−1) and to a lesser extent from
surface dry deposition (2.5 Tg N yr−1). The burden of NH+
4
is 0.22 Tg N with a lifetime of 4.52 days in the atmosphere. 3.2 Surface deposition
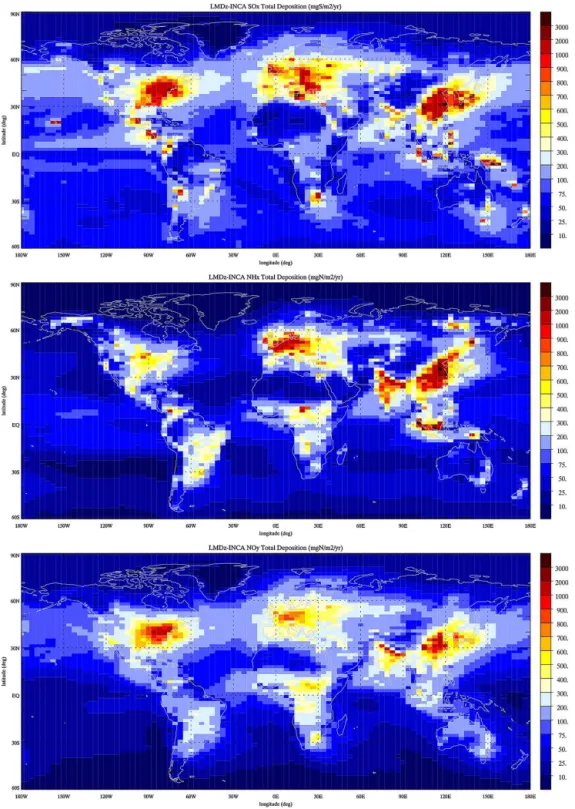
In Fig. 6 we present the total (dry plus wet) annual deposition of SOx (=SO2+SO=4), NHx (=NH3+NH+4), and NOy
(=NO+NO2+NO3+HNO2+HNO3+HNO4+2 N2O5 +PAN+organic nitrates+particulate NO−3). The three plots show similar patterns, with high deposition over North America, Europe, India, and China. The total SOx
D. A. Hauglustaine et al.: A global model simulation of present and future nitrate aerosols 11045
Figure 6.Annual mean SOx(mg S m−2yr−1), NHx, and NOy(mg N m−2yr−1) total surface deposition calculated for present-day
condi-tions.
75 % to this total. The maximum sulfur deposition reaches 5 g S m−2yr−1 in northern China. Over North America a
maximum deposition reaching 1–2 g S m−2yr−1 is
calcu-lated over the eastern United States. In western Europe, the deposition ranges from 500 mg S m−2yr−1in the south
to about 2 g S m−2yr−1 in the north, values reached over
the United Kingdom. A maximum deposition reaching 2 g S m−2yr−1 is calculated in central Europe. The global
NHx deposition is close to 50 Tg N yr−1, with wet and dry
and more than 5 g N m−2yr−1in China. Over North
Amer-ica, a maximum deposition reaching 800 mg N m−2yr−1
is calculated over the central United States. The total oxidized nitrogen deposition totals 50 Tg N yr−1, with wet deposition contributing 60 % to this term. Interestingly, total NHx and total NOy contribute the same amount to
the global nitrogen deposition to the surface ecosystems. The total NOydeposition shows a slightly different pattern
from the other deposition terms, with a maximum reaching 1.5 g N m−2yr−1 over the eastern United States, northern
India, and China. In Europe, the NOy deposition reaches
800–900 mg N m−2yr−1. These distributions are in good
agreement with the total deposition illustrated by Dentener et al. (2006b) and resulting from the ensemble mean of 23 atmospheric models and with the distributions illustrated by Lamarque et al. (2013) for the ACCMIP simulations.
Table 2 summarizes the comparison of the wet deposition of these three terms calculated by the model with the mea-surements from the EMEP network over Europe, from the NADP network over North America and from the EANET network over eastern Asia (see Supplement for individual plots). The sulfate deposition is slightly underestimated by the model with a normalized mean bias (NMB) of −27 % in Europe and −20 % in North America. In eastern Asia, a higher underestimation is obtained (NMB= −80 %). A sim-ilar disagreement in eastern Asia was also obtained by Den-tener et al. (2006b) and by Lamarque et al. (2013) and ten-tatively attributed to unaccounted sources of SO2from coal
burning in China. The wet deposition of NHxis well
repre-sented in Europe (NMB= −4.5 %) and to a lesser extent in North America (NMB= −32 %). We note however that the deposition term is again significantly underestimated in east-ern Asia (NMB= −60 %). The wet deposition of oxidized nitrogen from HNO3+NO−3 is relatively well represented in
Europe but underestimated by−28 %. Over North America, a better comparison is obtained (NMB= +13 %). Again, in eastern Asia, a significant underestimate of the wet deposi-tion is obtained (NMB= −54 %). Work is underway in order to better understand the reason for the significant underesti-mate of the deposition terms in eastern Asia and in particular in China based on new emission inventories generated for this region (Wang et al., 2012).
3.3 Aerosol optical properties and radiative forcings The aerosol optical depth and direct radiative forcings of the various aerosol components are calculated online by the gen-eral circulation model. The solar radiation code in the LMDz GCM consists of an improved version of the parameteriza-tions of Fouquart and Bonnel (1980). The shortwave spec-trum is divided into two intervals: 0.25–0.68 µm and 0.68– 4.00 µm. The model accounts for the diurnal cycle of solar radiation and allows fractional cloudiness to form in a grid box. The radiative fluxes are computed every 2 h, at the top of the atmosphere and at the surface, with and without the
presence of clouds. The clear-sky and all-sky direct radia-tive forcings of the various aerosol components are finally obtained by subtracting the 1850 radiative fluxes from the considered simulation. Since we focus this study on direct aerosol forcings, the cloudiness is not affected by the pres-ence of aerosols in this version of the model.
Figure 7 shows the calculated total aerosol optical depth at 550 nm and the optical depth associated with fine and coarse nitrate particles. The total aerosol optical depth (AOD) ex-hibits values of 0.15–0.25 over the eastern United States and Europe, associated mostly with pollution aerosols. Maxi-mum values reaching more than 0.5 and associated with dust aerosols are calculated over northern Africa, Saudi Arabia, and China. In China, both natural and pollution aerosols con-tribute to the high aerosol optical depth. Distributions very similar to these results have also been presented in other studies (e.g., Kinne et al., 2006; Bellouin et al., 2011; Xu and Penner, 2012; Shindell et al., 2013). The global mean and total AOD is 0.135, with accumulation-mode particles contributing 0.059 to AOD. As expected from the burden shown in Figure 3, nitrates exhibit higher optical depth over source regions: values of 0.02–0.03 over the central United States, maximum optical depth of 0.05 in northern Europe, and more than 0.1 in northern China. The contribution of ni-trates formed from biomass burning emissions is also vis-ible in South America, Africa, and Indonesia, with values reaching 0.1 in the later region. The nitrate optical depth is in good agreement with the results presented by Myhre et al. (2006) regarding both the general patterns of the distribu-tion and the calculated values. The global mean and total ni-trate optical depth is 0.0053. Fine nini-trate particles contribute 0.0048 to this total number. The evaluation of the calculated total AOD by comparing with the measurements from the Aerosol Robotic Network (AERONET) network (Holben et al., 2001, Kinne et al., 2006) is summarized in Table 2 (see Supplement for individual plots). Matching daily data from the model and AERONET were aggregated to monthly av-erages. Worldwide, the measured and modeled AOD show a relatively good correlation (R=0.57). The arithmetic mean for the measurements of 0.226 is, however, underestimated by the modeled values of 0.202 with a normalized mean bias (NMB) of−11 %. A good agreement with the AERONET measurements is obtained over North America. Over this re-gion, the model slightly underestimates the measurements (NMB= −4.5 %, R=0.77). Over Africa, higher AOD as-sociated with dust aerosols are calculated. A fairly good cor-relation is reached (R=0.66), also with a light underesti-mate by the model of−10 %. Over eastern Asia, the model underestimates the AOD (NMB= −39 %). Over Europe, a fairly good correlation between model and measurement is obtained (R=0.58). However, over this region, the model overestimates the measurements (NMB= +6 %).
D. A. Hauglustaine et al.: A global model simulation of present and future nitrate aerosols 11047
Figure 7.Annual mean total aerosol optical depth at 550 nm (top), and nitrate aerosol optical depth (bottom) simulated for present-day
conditions.
The total zonal mean nitrate aerosol column peaks in the northern hemisphere around 25–50◦, as shown already in Fig. 3. Coarse particles dominate the zonal mean nitrate bur-den and reach 2.5 mg m−2. These particles are also
respon-sible for a background column of 0.5–0.8 mg m−2in remote
areas, associated mainly with coarse nitrate particles on sea salt. Fine particles associated with pollution present a max-imum of about 1 mg m−2 at 40◦N and a secondary maxi-mum of about 0.5 mg m−2associated with biomass burning
emissions around the Equator. The zonal mean nitrate optical depth shows the opposite behavior since coarse particles con-tribute less efficiently to the Mie scattering. The total zonal mean nitrate optical depth reaches more than 0.012 around 40◦N. This optical depth is largely associated with fine par-ticles with coarse nitrates contributing a maximum optical depth of about 2×10⁻³.
Figure 9 gives the direct radiative forcings of aerosols since pre-industrial times calculated at the top of the atmo-sphere for all-sky conditions. The forcings are calculated as the difference between the present-day and pre-industrial
aerosol distributions. The global mean sulfate radiative forc-ing is−0.315 W m−2, a value in agreement with the recent
intercomparison of models provided in the framework of Ae-roCom by Myhre et al. (2013) indicating a mean forcing of
−0.32±0.11 W m−2 and with the most probable range of −0.18 to −0.44 W m−2 provided by Shindell et al. (2013).
The forcing shows values of −2 W m−2 over regions of
high sulfate load over the eastern United States, southern Europe, and eastern Asia. The global mean radiative forc-ing associated with black carbon (BC) particles includforc-ing the fossil fuel, biofuel, and biomass burning components is equal to 0.19 W m−2. Over the southeastern United states and the United Kingdom, the negative forcing indicates that BC emissions have decreased in these regions since the refer-ence year of 1850 already included emissions from biofuel and to a lesser extent, coal burning. The organic carbon (OC) forcing is−0.056 W m−2. The forcing is negative except in
Figure 8. Zonal and annual mean total (solid line), coarse-mode (dashed line), and fine-mode (dotted line) nitrate particles column (mg m−2)(a); corresponding total, coarse, and fine nitrate particles optical depth at 550 nm (×100)(b).
BC,−0.03±0.01 W m−2for OC, and a combined BC+OC
forcing from biomass burning of −0.00±0.05 W m−2. The
calculated forcings for BC and OC with this model are in agreement with this compilation and with Shindell et al. (2013). The calculated global mean forcing for nitrate particles is−0.056 W m−2. Fine nitrate particles contribute −0.049 W m−2to this forcing and anthropogenic coarse
ni-trate particulate matter only −0.006 W m−2. The total
ni-trate forcing reaches−2.6 W m−2over China, −1.0 W m−2
over northern Europe, and −0.5 W m−2 over the
cen-tral United States. The nitrate forcing also reaches more than −1.0 W m−2 over biomass burning regions. For this
forcing, Myhre et al. (2013) reported a global value of
−0.08±0.04 W m−2 and Shindell et al. (2013), a value of −0.19±0.18 W m−2. There is a significant spread in the
calculated nitrate forcings from the various models, rang-ing from a value of −0.02 W m−2 with the Oslo CTM2 to −0.12 W m−2with the GEOS-CHEM model (Myhre et al.,
2013), and even to−0.41 W m−2with the GISS model
(Shin-dell et al., 2013). The value calculated with this model is in the range provided by this previous work. Additional work is required to understand the reason for the spread in the vari-ous model estimates. In particular, the role played by coarse nitrate formation is important since it subtracts HNO3from
the gas phase, decreasing the formation of fine particles of
ammonium nitrates and hence reducing the total forcing of nitrates particles.
4 Future evolution of nitrate aerosols
In this section, we present the future evolution of nitrate aerosols under the various RCP scenarios for the years of 2030, 2050, and 2100. The associated direct radiative forc-ings are presented and the nitrate forcing compared to the forcing of the other particles in order to investigate their rel-ative contribution in the future. Snapshot simulations have been performed for these various cases as described in Sect. 2.3, and the global emissions for key species related to nitrate formation have been presented in Table 1. In order to better understand the contribution of NH3, NOx, and SO2
emissions to future nitrate levels, sensitivity simulations have been performed in the particular case of the RCP4.5 scenario for the year 2100.
4.1 Atmospheric composition
The four RCP scenarios have been simulated with the model but, as far as nitrate particles and their radiative forcing are concerned, and as visible from the total emissions presented in Table 1, two particular scenarios are interesting to com-pare. In all scenarios, SO2and BC emissions decrease from
their present-day value to their 2100 level. Despite signifi-cant differences in 2030 and 2050 (in particular in the case of SO2emissions), the level reached in 2100 in the four
emis-sion scenarios are often close to each other for these species. This is not the case for two important precursors of nitrate particles: ammonia and nitrogen oxides. For NH3and NOx,
RCP4.5 and RCP8.5 represent the extremes for emissions in 2100 and are expected to lead to very different nitrate lev-els in the future. This is particularly the case for NH3
emis-sions, which remain close to their present-day level (51 Tg N) in 2100 in the RCP4.5 scenario (54 Tg N), but increase by 50 % in 2100 in RCP8.5 (78 Tg N). For NOx, emissions
de-crease from 46 Tg N in the present-day to 24 Tg N in 2100 in RCP4.5 but decrease only to 31 Tg N in 2100 in RCP8.5.
As a consequence of these changes in emissions, the con-centration of NH3varies quite significantly in the future
be-tween these two extreme scenarios (see Supplement for ad-ditional figures on future changes of the key atmospheric constituents). For surface NH3 concentrations, in scenario
RCP8.5, a significant increase is calculated everywhere in 2030 and 2100 except in Indonesia, where biomass burning emissions are reduced. In the central United States, northern and central Europe, India, and China, NH3increases by up to
2 µg m−3in 2100 compared to the reference levels illustrated
D. A. Hauglustaine et al.: A global model simulation of present and future nitrate aerosols 11049
Figure 9.All-sky, top-of-the-atmosphere direct radiative forcing of sulfates, nitrates, organic carbon, and black carbon particles (W m−2)
calculated for present-day conditions.
a lesser decrease of 0.5–1 µg m−3is calculated in the central
US. Due to a reduction in NOxemissions, HNO3has already
significantly decreased in 2030 in North America and Eu-rope in both scenarios. In contrast, a strong increase is calcu-lated in India and in China reaching more than 2 µg m−3in
2030. In 2100, the HNO3reduction is almost consistent over
the continents with the exception of biomass burning regions in Africa and India in the case of RCP8.5. The concentra-tion of SO4=increases in India and Southeast Asia by more than 2 µg m−3in 2030. As expected from the sharp decrease
in SO2 emissions, at the end of the 21st century, a general
decrease of the surface concentration is calculated in 2100, reaching more than 2 µg m−3in North America, Europe, and
China.
As a result of these changes in nitrate precursor surface concentrations, nitrate particles are expected to undergo sig-nificant variations in the future. Figure 10 shows the evolu-tion of nitrate particles surface concentraevolu-tions for the various simulations performed and averaged over several regions of the world. As shown earlier (Fig. 1), present-day nitrate con-centrations are higher in Europe (1.4 µg m−3than in North
America (0.35 µg m−3). Due to the decrease in precursors,
the concentrations in these two regions decrease in all sce-narios during the 21st century. By 2100, the mean surface concentration in Europe is in the range of 0.14–0.43 µg m−3
and in the range of 0.03–0.15 µg m−3in North America. In
northern and southern Asia, the concentration increases sig-nificantly in 2030 and 2050 in scenarios RCP6.0 and RCP8.5, reaching 3.6 µg m−3. By 2100, the surface concentration is
in the range of 0.38–0.78 µg m−3 and 0.01–0.51 µg m−3 in
northern and southern Asia, respectively. In India, the surface nitrate concentration increases until 2050 in most scenarios, reaching 1.45 µg m−3on average. The concentration then
de-creases and is in the range of 0.27–0.65 µg m−3 in 2100.
The concentration of nitrates in other regions (Africa, South America, Australia) show little variation from their present-day value (not shown). The global nitrate concentration in-creases from 0.38 µg m−3for the present to 0.58 µg m−3in
2030 and decreases to 0.10–0.21 µg m−3in 2100.
Figure 11 shows the ratio of free ammonia (TA∗)to total nitrate (TN)for the year 2100 and scenario RCP8.5. There