www.atmos-chem-phys.net/15/9003/2015/ doi:10.5194/acp-15-9003-2015
© Author(s) 2015. CC Attribution 3.0 License.
An investigation of how radiation may cause accelerated rates of
tropical cyclogenesis and diurnal cycles of convective activity
M. E. Nicholls
University of Colorado, Department of Atmospheric and Oceanic Sciences, Cooperative Institute for Research in Environmental Sciences, Boulder, CO, USA
Correspondence to:M. E. Nicholls (melville.nicholls@colorado.edu)
Received: 17 August 2014 – Published in Atmos. Chem. Phys. Discuss.: 4 March 2015 Revised: 27 May 2015 – Accepted: 18 July 2015 – Published: 13 August 2015
Abstract. Recent cloud-resolving numerical modeling re-sults suggest that radiative forcing causes accelerated rates of tropical cyclogenesis and early intensification. Further-more, observational studies of tropical cyclones have found that oscillations of the cloud canopy areal extent often occur that are clearly related to the solar diurnal cycle. A theory is put forward to explain these findings. The primary mecha-nism that seems responsible can be considered a refinement of the mechanism proposed by Gray and Jacobson (1977) to explain diurnal variations of oceanic tropical deep cumulus convection. It is hypothesized that differential radiative cool-ing or heatcool-ing between a relatively cloud-free environment and a developing tropical disturbance generates circulations that can have very significant influences on convective activ-ity in the core of the system. It is further suggested that there are benefits to understanding this mechanism by viewing it in terms of the lateral propagation of thermally driven gravity wave circulations, also known as buoyancy bores. Numerical model experiments indicate that mean environmental radia-tive cooling outside the cloud system is playing an important role in causing a significant horizontal differential radiative forcing and accelerating the rate of tropical cyclogenesis. As an expansive stratiform cloud layer forms aloft within a de-veloping system the mean low-level radiative cooling is re-duced, while at mid levels small warming occurs. During the daytime there is not a very large differential radiative forcing between the environment and the cloud system, but at night-time when there is strong radiative clear-sky cooling of the environment it becomes significant. Thermally driven circu-lations develop, characterized by relatively weak subsidence in the environment but much stronger upward motion in the cloud system. This upward motion leads to a cooling
ten-dency and increased relative humidity. The increased relative humidity at night appears to be a major factor in enhanc-ing convective activity, thereby leadenhanc-ing in the mean to an increased rate of genesis. It is postulated that the increased upward motion and relative humidity that occur throughout a deep layer aid both in the triggering of convection and in providing a more favorable local environment at mid lev-els for maintenance of buoyancy in convective cells due to a reduction of the detrimental effects of dry air entrainment. Additionally, the day/night modulations of the environmen-tal radiative forcing appear to play a major role in the di-urnal cycles of convective activity in the cloud system. It is shown that the upward velocity tendencies in the system core produced by the radiative forcing are extremely weak when compared to those produced by latent heat release in convec-tive towers, but nevertheless over the course of a night they appear capable of significantly influencing convective activ-ity.
1 Introduction
rainfall. A recent study by Shu et al. (2013) has confirmed this supposition, showing that a significant diurnal variation of rainfall occurs in western North Pacific tropical cyclones. Recent numerical modeling studies also suggest that radi-ation may increase the rate of tropical cyclogenesis (Nicholls and Montgomery, 2013, hereafter NM13; Melhauser and Zhang, 2014). Studies previous to these, although limited by relatively coarse grid resolution and parameterization of moist convection, had already shown earlier intensifica-tion when a simple longwave cooling scheme was included (Sundqvist, 1970; Hack and Schubert, 1980). NM13 con-ducted idealized experiments of tropical cyclogenesis using the Regional Atmospheric Modeling System (RAMS) devel-oped at Colorado State University (Pielke et al., 1992; Cotton et al., 2003). The objective was to obtain a better understand-ing of two distinctly different pathways to tropical cyclogen-esis that occurred in the idealized numerical modeling stud-ies of Montgomery et al. (2006) and Nolan (2007). The lat-ter two investigations examined the transformation of a rel-atively weak initial vortex over a warm ocean surface into a tropical cyclone using grid resolutions marginally capable of resolving convective clouds. Interestingly, the results of the two studies were very different. Montgomery et al. (2006) conducted simulations with RAMS and found a pathway oc-curring similar to that in a case study of the formation of Hur-ricane Diana (1984) by Hendricks et al. (2004). Vortical hot towers (VHTs) were the preferred coherent structures. The aggregate diabatic heating of the VHTs provided an influx of low-level angular momentum, causing low-level cyclonic winds to increase. Eventually the low-level winds became stronger than those of the mid-level vortex used to initial-ize the model and remained stronger or comparable to the winds aloft until they reached tropical depression strength (considered by NM13 to be approximately 12 m s−1). Devel-opment was characterized by a gradual decrease in the radius of maximum winds. Vorticity gradually built in the center as the system-scale inflow produced increasing cyclonic vortic-ity and as small-scale cyclonic vorticvortic-ity anomalies were con-verged at low levels and underwent aggregation. In contrast the simulations by Nolan (2007) with the Weather Research and Forecasting (WRF) model showed a gradual strengthen-ing of the initial mid-level vortex followed by the sudden for-mation of a small surface concentrated vortex near the cen-ter of the larger-scale circulation, with a radius of maximum winds of only a few kilometers. This vortex became the fo-cus of a strengthening cyclonic circulation that grew in size to form a small tropical cyclone. These differing results were perplexing since the two pathways were distinctly different even though there were many similarities between the mod-els and the experimental designs.
Nicholls and Montgomery (2013), using a newer version of RAMS, were able to demonstrate for the first time devel-opment along both pathways, depending on initial conditions and the model physics employed. There were some caveats to the development along the second pathway. Instead of the
initial mid-level vortex simply strengthening, the surface cy-clonic winds typically increased to begin with, similarly to the first pathway. It was only when an extensive stratiform anvil had formed aloft that a second prominent mid-level vor-tex developed. NM13 ran a set of experiments to investigate the two pathways described by Montgomery et al. (2006) and Nolan (2007) in more detail, which were denoted pathway One and pathway Two, respectively. They concluded that the ice phase was crucial for the formation of a strong mid-level vortex and development along pathway Two. Environments conducive to forming large quantities of ice aloft appeared to be more favorable for development along pathway Two. Higher sea surface temperatures for instance appeared to pro-duce more intense and deeper convective cells, and more ice aloft, and therefore favored evolution along the second path-way.
NM13 included simulations both with and without radia-tion, and comparison of the genesis rate for otherwise identi-cal experiments reveals significant differences. Table 1 shows results for four pairs of experiments that are exactly the same except for whether radiation is included or not. The time that maximum azimuthally averaged tangential winds reach 12 m s−1is much quicker for the experiments with radiation included for each of the four pairs. The subsequent time to go from winds of 12 m s−1to tropical storm strength winds
of 17.4 m s−1is also considerably faster for all cases. On the
other hand, there is no systematic increase in the later in-tensification rate from tropical storm strength to hurricane strength (33 m s−1) when radiation is included. NM13 also
found a strong diurnal cycle of convective activity when ra-diation was included.
Potential influences of radiation on oceanic tropical mesoscale convective systems (MCSs) and tropical cyclones include enhancing surface precipitation, causing diurnal cy-cles, changing the rate of development and effecting struc-ture and motion. There are three main mechanisms that have been proposed for the role of radiation in these convective systems: (1) differential cooling between the weather system and its surrounding cloud-free region (Gray and Jacobson, 1977); (2) large-scale clear-sky environmental cooling (Dud-hia, 1989; Tao et al., 1996); (3) changing thermal stratifica-tion due to cloud top and cloud base radiative forcing (Web-ster and Stephens, 1980; Hobgood, 1986; Xu and Randall, 1995).
cool-Table 1.General statistics comparing four cases without and with radiation from NM13. Moist, dry refers to the core having an initial
moisture anomaly or not. All cases are for a weak initial vortex having a maximum tangential wind speed of 8 m s−1atz=4 km. Shown are
the time the maximum averaged tangential wind speeds at the surface reach 12 m s−1; the near-surface radius of maximum winds (RMW)
at this time; the pathway taken to genesis; the time at which the system becomes a tropical storm (TS); the RMW at this time; the time the system becomes a hurricane (H); and the RMW at this time.
Exp. Description T12(h) RMW12 Path TTS(h) RMWTS TH(h) RMWH
(km) (km) (km)
1 No radiation, moist, small,
weak, SST29
82 9 2 92 13 103 13
2 Radiation, moist, small, weak,
SST29
60 5 2 65 11 78 13
3 No radiation, dry, small, weak,
SST29
151 5 2 174 11 189 13
4 Radiation, dry, small, weak,
SST29
101 11 2 105 13 119 15
5 No radiation, moist, large,
weak, SST29
89 5 2 103 23 114 23
6 Radiation, moist, large, weak,
SST29
55 5 2 61 19 69 15
7 No radiation, moist, large,
weak, SST28
112 41 1 118 37 127 23
8 Radiation, moist, large, weak,
SST28
49 5 2 52 9 68 15
ing causes increased subsidence and low-level convergence into the cloud cluster at night, which enhances convection during the morning. During the daytime the solar heating of the environment offsets the longwave cooling to a large extent and environmental subsidence and low-level conver-gence into the cloud cluster are reduced, thereby producing a diurnal cycle of convective intensity. They emphasize that it is the larger low-level moisture convergence that occurs in the morning that is responsible for the higher morning precipitation rates. Several numerical modeling studies have investigated the potential of this differential radiation forc-ing mechanism to cause diurnal cycles of convective inten-sity in MCSs and conclude that it is probably of relatively minor importance (Dudhia, 1989; Miller and Frank, 1993; Xu and Randall, 1995; Tao et al., 1996). All of these stud-ies were in two dimensions; further details will be provided in the discussion of the other two mechanisms. There have not been many numerical modeling studies that have inves-tigated the importance of the horizontal differential heating mechanism in tropical cyclones. Craig (1996), utilizing an axisymmetric model with explicit convection, examined the effect of radiation for an initial vortex with maximum winds of 15 m s−1 at a radius of 75 km. Development was quite rapid with azimuthal winds reaching approximately 60 m s−1 by 45 h. There was little difference between simulations with and without radiation until 60 h. The longwave cooling was found to increase the maximum intensity by about 20 %. Results of sensitivity experiments suggested that differential cooling was the sole mechanism responsible for the enhanced deepening. It was noted that the lack of difference in the early
development could have been due to the cloud pattern not being established until 40–50 h, implying little contrast be-tween cloud and cloud-free regions. Also, it was pointed out that initialization with an initial vortex of 15 m s−1without
cloud is extreme, since in nature the cloud is likely to precede the establishment of a balanced vortex. On the other hand, it was noted that the cloud distribution early in the development of a tropical cyclone is likely to be highly variable. Results of the study were not considered conclusive and further work in this area was recommended.
destabi-lization was the main factor causing enhanced rainfall rates when radiation was included. Tao et al. (1996) used a two-dimensional non-hydrostatic cloud-resolving model to sim-ulate the development of both a tropical oceanic squall line and a mid-latitude continental squall line. Again, this study found that large-scale clear-sky radiative cooling played an important role. However, their experiments indicated that it was not so much destabilization that enhanced surface rafall in their simulations when longwave radiation was in-cluded, but increased relative humidity. They found that con-vective available potential energy (CAPE) was not signifi-cantly increased by large-scale clear-sky cooling. They em-phasize that increased relative humidity due to cooling allows condensation to occur more readily. Furthermore, it reduces evaporation and the negative impact of dry air entrainment. These are important additional insights into how large-scale clear-sky radiative cooling works in this context. Tao (1996) also found that solar heating reduced precipitation compared with runs with longwave forcing only, and suggested that this was likely to be playing a significant role in the diurnal pre-cipitation cycle found over most oceans.
Tao et al. (1996) calculated time- and domain-averaged longwave radiative profiles over the clear and cloudy regions for both squall lines that were simulated (Fig. 13 of their manuscript). For the tropical oceanic case below 11 km, the clear-sky longwave cooling was approximately 1.5 K day−1
larger than for the cloudy regions. This is substantial, and it will be shown in this paper that such a difference, when oper-ative for a 12-h period, should produce an unbalanced over-turning circulation with significant consequences for convec-tion. As a sensitivity experiment they eliminated differential cooling between cloudy and cloud-free regions by replac-ing the cloudy heatreplac-ing/coolreplac-ing profiles with cloud-free radia-tive cooling. They found that for both the tropical and mid-latitude cases surface rainfall was actually increased, which led them to conclude tentatively that differential cooling was not the mechanism responsible for enhancing the surface precipitation when longwave radiation was activated in the model. An additional sensitivity test was run in which long-wave cooling was allowed to act for 6 h prior to triggering convection, and then the simulation was run without any ra-diative processes. For the tropical oceanic case, which had a small saturation deficit, there was a significant increase in surface rainfall similar to that occurring for the simulation with full radiative interactions. These experiments led them to conclude that the increase in humidity due to large-scale radiative cooling was significantly more important than the
convergence/differential radiation mechanism1(Gray and Ja-cobson, 1977).
There are several important caveats to this large-scale cooling mechanism that are important for understanding its potential influence on tropical cyclones and their simulation. Typically model simulations are initialized without the ini-tial presence of cloudy air and it takes several hours, often 6–12 h, before deep convection develops. During this period, large-scale radiative cooling can occur, the amount of course being influenced by what time of day the model is initial-ized, which results in increased relative humidity and possi-bly changes in stability that can enhance convective activity. Once a thick stratiform anvil forms aloft, which is the re-sult of the merging of anvils from numerous deep convective cells, clear-sky cooling becomes confined to the surrounding relatively cloud-free environment. At this point there are two potentially important effects: the surrounding environment becomes more conducive to the development of widespread convection as cloud-free cooling continues in this region, and the low-level inflow of air into the system from the environ-ment becomes more humid, compared to a simulation with-out radiation. It has yet to be shown how important these effects might be during the early stage of a tropical cyclone’s lifetime. Moreover, the question of whether day–night mod-ulations of the radiative forcing in the surrounding environ-ment can by these processes cause the diurnal variations ob-served in tropical cyclones has yet to be ascertained.
Another caveat to the large-scale radiative cooling mecha-nism is that it can take place in between and above scattered cumulus and cumulus congestus. Also, large-scale radiative cooling above a low-level stratocumulus layer can lead to in-creases in humidity and stability changes aloft. In this situ-ation large-scale cooling would be a more appropriate term than clear-sky cooling for causing the increased potential for convective activity.
The third mechanism mentioned is based on the finding that large values of radiative heating during the day and cooling at night occur at the top of oceanic tropical cloud canopies, as well as large longwave radiative heating at cloud base (Webster and Stephens, 1980). The authors of this study concluded that there could be substantial destabilization of
1The distinction between this mechanism and the first, even
the cloud layer due to this radiative forcing, particularly at night. Xu and Randall (1994) refer to this mechanism as “di-rect radiation-convection interaction”, and results of their en-semble numerical model simulations led them to conclude that it plays a dominant role in diurnal cycles of deep con-vection over the tropical oceans. On the other hand, some of the studies that have focused on individual MCSs suggest this mechanism is not as important as large-scale clear-sky cooling in enhancing surface precipitation (Miller and Frank, 1992; Fu et al., 1995; Tao et al., 1996).
This third mechanism has also been by examined in re-gard to tropical cyclones by Hobgood (1986), who suggested that variations in thermal stratification aloft due to cloud top cooling at night and warming during the daytime might pos-sibly cause the observed diurnal oscillations of the areal ex-tent of cloud canopies. Numerical modeling results presented by Hobgood (1986) indicated that the diurnal cycle of net ra-diation at the cloud tops was the primary cause of the oscil-lations. Radiative cooling at night steepens the lapse rate and increases convection. During daylight hours, the absorption of solar radiation reduces the lapse rate, thus resulting in a minimum in convection. It was also suggested that this pro-cess might be augmented by differential cooling of cloudy and clear areas, as proposed by Gray and Jacobson (1977). While this early numerical model provided strong evidence of diurnal oscillations in convective activity in tropical cy-clones, it was very basic compared to today’s models and was unable to actually reproduce diurnal oscillations of the cirrus canopy.
A numerical modeling study of the effect of the diurnal radiation cycle on the pre-genesis environment of Hurricane Karl (2010) using the Advanced Research WRF has been re-ported recently by Melhauser and Zhang (2014). An obser-vational analysis by Davis and Ahijevych (2012) found an approximate diurnal cycle of convective fluctuations with a maximum in the mid to late morning and a minimum in the late evening leading up to genesis of Karl. The numerical modeling sensitivity tests showed a case where inclusion of both shortwave and longwave components of radiation led to genesis and intensification, whereas a simulation without radiation did not develop. Furthermore, it was found that a simulation with nighttime-only radiation had a fast genesis and intensification, whereas a daytime-only radiation case did not develop. Therefore, these results indicate an impor-tant role of radiation in increasing the genesis rate, in agree-ment with NM13, and also showed significant day–night dif-ferences of radiation on TC development. The effects of ra-diation in the Melhauser and Zhang (2014) study were an-alyzed in terms of the “local environment” by horizontally averaging each model level within a circle of radius 225 km from the vortex center and the “large scale environment” by averaging over an annulus from 300 to 450 km. The effects of radiation were then independently assessed in each region. Their presented results did not explicitly illustrate diurnal cycles of convective activity. The focus, rather, was on the
simulated early development. They noted that their results appeared consistent with the conclusions of previous stud-ies regarding destabilization due to large-scale environmental cooling, particularly at night, by Dudhia (1989), Miller and Frank (1993), and Tao et al. (1996). During the daytime they conclude that local and large-scale reduction of relative hu-midity and increased stability made the overall environment less conducive to deep moist convection. Their study appar-ently did not examine any potential role of horizontal differ-ential radiative forcing in producing diurnal oscillations of convective activity.
Another recent numerical modeling study by Bu et al. (2014) investigated the influence of cloud-radiative forc-ing on tropical cyclones. The primary model they used was Hurricane WRF. The initialization that they employed re-sulted in winds of tropical storm strength being reached by 24 h, so they did not focus on the early stages of develop-ment. The impact of cloud-radiative forcing was examined by comparing the development of a tropical cyclone hav-ing only clear-sky radiation with one havhav-ing both clear-sky and cloud radiation. The main impact of including cloud-radiative forcing at this stage was to significantly broaden the wind field. A similarity was noted between their results for the vertical profiles of diurnally averaged net radiative forcing for clear and disturbed (cloudy) regions and those presented by Gray and Jacobson (1977). Sensitivity tests showed that weak, primarily longwave, warming within the cloud anvil was the major factor responsible for modifying the structure when cloud-radiative forcing was included.
values considerably during the nighttime in the cloud system throughout a deep layer. Therefore, it is proposed here that this mechanism is likely to be playing a significant role in both increasing the genesis rate and causing diurnal cycles of convective activity.
This is a preliminary study, but makes a strong case for the mechanism proposed by Gray and Jacobson (1977) to explain diurnal cycles of precipitation rate in MCSs as being relevant for tropical cyclones in their early stages of develop-ment. Furthermore, it is beneficial to adopt a dynamical per-spective recognizing that modulations of the horizontal dif-ferential radiative heating generate thermally forced gravity waves, also known as buoyancy bores (Nicholls et al., 1991; Mapes, 1993). Early work that examined the transient linear response of a stratified atmosphere to prescribed heat sources as a simple model of moist convection noted that thermally generated gravity waves were playing a fundamental role in compensating subsidence (Lin and Smith, 1986; Raymond, 1986; Bretherton and Smolarkiewicz, 1989). Following these works Nicholls et al. (1991) derived simple analytical two-dimensional solutions to the linear hydrostatic Boussinesq equations for an atmosphere at rest with prescribed heat sources and sinks. For a case with an idealized rigid lid and a deep heat source, represented by a half-sine wave in the ver-tical, the thermally generated buoyancy circulation was char-acterized by upward motion in the heated region with outflow aloft and inflow at low levels. The outflow and inflow ex-panded rapidly on either side of the heat source. The leading edges of these expanding circulations were deep fast moving wave-like pulses of subsidence. So, the subsidence compen-sating the central upward motion did not occur continually over broad regions on either side of the heat source, but had a distinct horizontally propagating character. The propagating subsidence regions caused adiabatic warming, adjusting the environmental potential temperature towards the perturbed values at the heated center for this two-dimensional frame-work with a rigid lid. Response to a thermal forcing profile more typical of an MCS having a stratiform region was also examined for a rigid lid. In this case a deep fast propagating circulation like the one previously discussed was superim-posed on a slower propagating circulation characterized by a mid-level inflow and upper- and lower-level outflows. This second slower moving mode had a cool potential tempera-ture anomaly at low levels and a warm potential temperatempera-ture anomaly aloft. The leading pulses of vertical motion had up-ward motion at low levels and downup-ward motion aloft. The speed of the modes is given by
c=
N H
nπ , (1)
whereNis the Brunt–Väisälä frequency,Hthe height of the rigid lid andnthe vertical mode of the heating profile. This profile has the form sin(nπ z / H), wherezis height.
The two-dimensional solution for a semi-infinite region, without a troposphere–stratosphere interface, shows
consid-erable differences of the low-level fields in some respects (Pandya et al., 1993). In particular, the magnitude of the sub-sidence is substantially reduced, and it occurs over a much broader region. Moreover, the axis of the peak vertical veloc-ity in the low-level subsidence region is no longer vertically aligned, but strongly tilted. Nevertheless, adiabatic warming behind the broader wave front still gradually approaches the values at the heated center. Another factor to consider is that in the real atmosphere there is increased stability above the tropopause, which partially reflects waves and to some extent increases the similarity to the rigid lid solution. An early two-dimensional numerical simulation of a squall line showed a structure qualitatively similar to the first mode during the early stage of development (Nicholls, 1987). The deep con-vective heating extending to the top of the troposphere pro-duced a deep overturning circulation with surface mesolows growing laterally away from the center of the convection at a rapid pace. For the first deep convective mode that extends throughout the depth of the tropical troposphere,H is ap-proximately 15 km and takingN=0.01 s−1gives a horizon-tal propagation speed of 48 m s−1. For the second mode the speed is 24 m s−1. So, the first mode is very fast moving and while the second mode is considerably slower its speed is still quite fast compared to typical atmospheric motions.
Mapes (1993) postulated that higher-order modes of the heating profile in an MCS may cause upward displacements at low levels in the nearby atmosphere, thus favoring the de-velopment of additional convection nearby. He also empha-sized that the wave-like disturbances are not ordinary grav-ity waves, and, pointing out their similargrav-ity to tidal bores in water, referred to them as buoyancy bores. There has been a considerable amount of research since these earlier stud-ies that has examined their role in convective systems (e.g., Pandya and Durran, 1996; McAnelly at al., 1997; Pandya et al., 2000; Nicholls and Pielke, 2000; Shige and Satomura, 2001; Lane and Reeder, 2001; Haertel and Johnson, 2001; Fovell, 2002; Liu and Moncrieff, 2004; Fovell et al., 2006; Tulich and Mapes, 2008; Bryan and Parker, 2010; Lane and Zhang, 2011; Adams-Selin and Johnson, 2013). Inclusion of planetary rotation confines the compensating subsidence and adiabatic warming caused by deep convection to a fi-nite distance, measured by the Rossby radius of deforma-tion (Bretherton, 1987, 1988; Liu and Moncrieff, 2004). Ad-justment towards geostrophic balance when a spectrum of inertial-gravity wave modes is generated by a heat source has been investigated in a two-dimensional framework by Liu and Moncrieff (2004).
in the idealized numerical experiments that are discussed in this study and it is useful to consider their properties in order to obtain a more complete understanding of the circulations generated by radiative forcing.
Recently Dunkerton et al. (2009) developed the “marsu-pial paradigm” that provides a theoretical framework for un-derstanding tropical cyclogenesis from easterly waves. The Kelvin cat’s eye within the critical layer, or “wave pouch”, was identified as a favorable environment for tropical cyclo-genesis. The theory is supported by both observations of a developing Pacific easterly wave (Montgomery et al., 2010; Raymond and Lopez Carrillo, 2011) and cloud-resolving nu-merical simulations (Zhang et al., 2011; Montgomery et al., 2010, 2012; Wang et al., 2010, 2012). A numerical model in-vestigation of the thermodynamic aspects near the center of the wave pouch found that it was characterized by a high sat-uration fraction (Wang, 2012). It was hypothesized that up-drafts were more vigorous in this region because of reduced dry air entrainment, and that this was favorable for tropical cyclogenesis. This present study makes a similar argument for the effect of enhanced relative humidity in the tropical disturbance due to radiative forcing. Support for the hypoth-esis is provided by recent cloud model experiments that indi-cate that for non-supercell environments a major effect of dry air aloft is to reduce the intensity of convection, including to-tal condensation and rainfall (James and Markowski, 2009; Kilroy and Smith, 2013).
The approach that will be used in this study will be to start off by examining the response of an initially motionless at-mosphere to a prescribed cooling rate, with a magnitude typ-ical of radiative forcing, applied in the large-scale environ-ment surrounding a non-forced core, which represents the re-gion occupied by a cloud cluster. For these simulations radia-tion, microphysics and surface flux schemes are de-activated. Now it is obviously a considerable idealization to set radia-tive forcing to zero in the region representing the cloud clus-ter. We will show later in a full physics simulation of a sys-tem that evolves into a tropical cyclone, that the radiation scheme produces in the cloud cluster reduced longwave cool-ing at low levels, slight warmcool-ing at mid levels, and very large magnitude forcing at cloud top and in the outer region of the sloping stratiform cloud base. Nevertheless, this simplified framework does give insight into the circulations expected to be induced by horizontal differential radiative forcing at low and mid levels between a cloud cluster and its environment. It is also worth noting that Gray and Jacobson (1977) presented estimated day and night radiative forcing rates in the clear sky and in the disturbance, which for the disturbance were very small beneath 400 mb (Fig. 13 of their manuscript). A set of sensitivity experiments using this idealized approach is conducted, and then numerical experiments become progres-sively more complex, culminating in an examination of the influence of radiation in cloud-resolving full physics simula-tions of tropical cyclognesis. These latter full physics exper-iments do not explicitly show the mechanisms causing
radi-ation to influence tropical cyclogenesis, but drawing on the results of the idealized simulations, some strong inferences can be made. The combined results of these numerical model experiments suggest that increased relative humidity caused by large-scale environmental radiative cooling in situ does play a significant role in accelerating the rate of tropical cy-clogenesis, as other studies have similarly demonstrated its importance for increasing the intensity of MCSs. However, there is probably a more important role played by the cir-culations induced by horizontal differential radiative forcing, both in accelerating the rate of genesis and in causing diurnal cycles of convective activity. The larger magnitude forcing aloft appears to have less important impacts on these two as-pects, but this study does not focus on upper-level forcing, so its potential importance for tropical cyclones is left for future research.
An outline of the remaining paper is as follows: in Sect. 2 the numerical model is described. In Sect. 3 the designs of the numerical experiments are discussed as well as the particular motivations for them. Results are presented in Sect. 4 and conclusions in Sect. 5.
2 Numerical model
RAMS is a nonhydrostatic numerical modeling system comprising time-dependent equations for velocity, non-dimensional pressure perturbation, ice–liquid water poten-tial temperature (Tripoli and Cotton, 1981), total water mix-ing ratio and cloud microphysics. The microphysics scheme has categories for cloud droplets, rain, pristine ice crys-tals, snow, aggregates, graupel and hail (Walko et al., 1995). There have been several improvements to the model physics incorporated since the NM13 study. A two-moment micro-physical scheme is now used for all hydrometeor species (Meyers et al., 1997). Additionally, an improved scheme for cloud-droplet riming that uses a binned approach is em-ployed (Saleeby and Cotton, 2008). Another change is that the surface parameterization of heat, vapor and momen-tum fluxes utilizes recent results of the Coupled Boundary Layer Air-Sea Transfer Experiment (CBLAST) presented by Bell (2012).
The radiation scheme used in this study is two-stream, and treats the interaction of three solar and five infrared bands with the model gases and cloud hydrometeors (Harrington, 1997; Harrington et al., 1999). This parameterization solves the radiative transfer equations for the three gaseous con-stituents, H2O, O3and CO2, and for the optical effects of the
Table 2.Experiments with prescribed thermal forcing.
Experiment Description
1 Maximum cooling aloft: environmental cooling forr >200 km,z <16 km, with maximum
am-plitude at 8 km.
2 Maximum cooling aloft and at low levels: environmental cooling forr >200 km,z <16 km,
with maximum
amplitude at 8 km, and a secondary maximum at the surface.
3 Uniform cooling: uniform environmental cooling forr >200 km, andz <10 km.
4 Small annulus: uniform cooling betweenr=200 and 400 km, andz <10 km.
5 Large annulus: uniform cooling betweenr=200 and 1000 km, andz <10 km.
6 Wide unforced region: uniform environmental cooling forr >600 km, andz <10 km.
7 Diurnal forcing: idealized diurnal oscillation of uniform environmental forcing forr >200 km,
andz <10 km.
8 Core forcing: uniform warming betweenz=5 and 10 km, uniform cooling below 5 km, for
r <200 km.
9 Weak vortex: uniform environmental cooling forr >200 km,z <10 km, and a vortex with
surface winds of 12 m s−1.
10 Strong vortex: uniform environmental cooling forr >200 km,z <10 km, and a vortex with
surface winds of 30 m s−1.
hydrometeor size spectra, this enables radiation to respond to variations in droplet size spectra.
A standard first-order subgrid-scale turbulence scheme de-veloped by Smagorinsky (1963) is used with modifications by Lilly (1962) and Hill (1974) that enhance diffusion in un-stable conditions and reduces diffusion in un-stable conditions. RAMS utilizes the two-way interactive multiple nested grid scheme developed by Clark and Farley (1984). The radia-tion boundary condiradia-tion described by Klemp and Wilhelm-son (1978) is used at the lateral boundary of the coarse grid. A Rayleigh friction layer is included at upper levels.
3 Description of experiments
The experiments conducted in this study can be classified into three categories. First are idealized experiments with-out radiation, cloud microphysics or surface fluxes. A list of the ten main experiments in this category is given in Ta-ble 2. Cooling or heating rates that represent idealized radia-tive forcing are prescribed. For many of the experiments a constant cooling is prescribed at the initial time in an envi-ronment that surrounds a core region, approximately the size of a cloud cluster, which is absent of any forcing. It is shown that thermally generated gravity waves, or buoyancy bores, propagate quickly into the core and induce upward motion, resulting in significant changes in the core temperature and relative humidity. Experiments are conducted for various ver-tical profiles of the cooling. Additional sensitivity tests exam-ine the response for cooling in annular regions of two differ-ent breadths surrounding the core. This is to see how large the cloud-free environment needs to be in order to generate significant sustained upward motion in the core. The sensi-tivity to the width of the core is also examined by
increas-ing it from 200 to 600 km. This has relevance for contrastincreas-ing how the response may be different for a small tropical cy-clone versus a large one. Then a simple idealized representa-tion of diurnal environmental forcing is used to examine how the core responds to changes in the environmental forcing. This is followed by an experiment to examine the response to forcing within the core, which has a warming region above a cooling region. The reason for this experiment, as previously remarked upon, is that the full physics simulation with radi-ation included shows a warming at mid levels and a cooling at low levels in the core. Also included at this stage are sim-ulations with two vortices of different strengths to examine how the presence of a vortex influences the induced upward motion in the core. It was found that using a sharp transi-tion between the forced and unforced regions leads to some noise in the fields. To avoid this a linear ramp 50 km wide is used. For instance, for a typical setup that might be des-ignated “unforced for radius less than 200 km”, the region 175 km is actually unforced and linearly changes to the fully forced value at a radius of 225 km. The designation of “un-forced for radius less than 200 km” is used for brevity.
Table 3.Radiative transfer scheme activated with a mid-level vortex and a moistened core.
Experiment Description
11 Radiative transfer scheme activated in the whole domain, with a weak mid-level vortex and
a moistened core.
12 Radiative scheme activated in the environment forr >200 km, with a weak mid-level vortex
and a moistened core.
Table 4.Experiments with full physics.
Experiment Description
13 Radiation in the whole domain.
14 No radiation.
15 Radiation only in the environment,r >200 km.
16 Radiation only in the core,r <200 km.
17 Prescribed uniform environmental cooling, forr >200 km,z <10 km.
18 Radiation only in a large core,r <400 km.
19 Radiation only in the environment outside a large unforced region,r >500 km.
20 No radiative forcing below 1.5 km.
21 No radiative forcing aloft above 8 km.
22 Prescribed horizontally homogeneous cooling throughout the domain, uniform below 10 km.
23 Radiative cooling only.
24 Radiative warming only.
but gives an idea of what circulations and resultant effects caused by radiative forcing outside the core region might be expected to occur in the lower and middle levels of the tropo-sphere when a cloud canopy forms. The simulation begins in the mid-morning and longwave cooling is negated to a large degree by shortwave heating throughout the day. During the nighttime it will be shown that a substantial increase in core humidity occurs for Experiment 12.
The third category is the full physics simulations that in-clude both microphysics and surface fluxes. The main fo-cus of these experiments is to provide further supporting ev-idence that the differential radiative forcing mechanism is playing a primary role, once a thick cloud canopy forms that is opaque in the infrared. A list of the twelve experiments is given in Table 4. The first five experiments are treated as a group. The first simulation, Experiment 13, with radiation in-cluded everywhere in the domain is examined in some detail. It is shown how a small tropical cyclone develops quickly along pathway Two (NM13). The following sensitivity tests are carried out: (1) radiation is turned off everywhere. This experiment demonstrates the difference in the rate of gene-sis caused by radiative forcing; (2) radiation is turned off in the core (radius less than 200 km). This experiment is con-ducted to show that it is likely that mean environmental ra-diative cooling is having a significant effect on the rate of genesis. Prior to the canopy shield extending beyond a ra-dius of 200 km the radiative forcing can be expected to be similar to Experiment 12, and it can be seen whether the duced upward motion in the core and enhanced humidity
in-fluences the intensity of convection; (3) radiation is turned off in the environment but included in the core. Again, this is to reinforce the conclusion that environmental radiative cool-ing is important, since the result for this case will be seen to be a slow genesis rate. Together Experiments 15 and 16 will make a strong case for differential forcing being important and the direct cloud-radiative interactions aloft as being rela-tively unimportant in influencing the rate of development of the system; (4) radiation is turned off and a constant uniform cooling is applied outside the core, below a height of 10 km. This is the same cooling function as used in Experiment 3. The objective is to demonstrate that the changes in the core due to this constant applied differential thermal forcing have a major impact on the genesis rate. The development of the low-level wind speed is compared for the five cases to see which develop into tropical cyclones the quickest. Also, the time evolution of the total mass of hydrometeors is compared to see which cases develop significant oscillations of convec-tive activity. The following seven experiments shown in Ta-ble 4 were conducted in order to clarify some issues brought up by results of the previous experiments. The reasoning be-hind these experiments and relation to some of the idealized experiments will be explained in the results section.
For the majority of the first category of experiments, only one grid is used. The horizontal grid increment is 12 km, with (x,y,z) dimensions of 170×170×48. The vertical grid
in-crement is 60 m and gradually stretched with height to the top of the domain atz=22.3 km. The depth of the upper
the grid were increased in size for the large annulus experi-ment to 400 grid points. For the vortex simulations a better horizontal resolution was necessary to resolve adequately the vortex and a nested grid was added with a horizontal grid in-crement of 3 km and (x,y,z) dimensions of 202×202×48.
The second category of experiments also includes a nested grid with the same horizontal grid increments and horizontal dimensions as for the previous vortex experiments. The num-ber of vertical grid points is increased to 56 to be consistent with the full physics simulations. In this case the vertical grid increment is gradually stretched from 60 m but not allowed to exceed 700 m, which occurs at approximately a height of 9 km, and is thereafter held constant to the top of the domain atz=22.9 km. The better resolution aloft was deemed
nec-essary for the full physics simulations, because the canopy top is near the tropopause and plays a radiatively active role. For the full physics simulations of the third category, three grids are used with horizontal grid increments of 24, 6, and 2 km, and (x, y, z) dimensions of 150×150×56,
150×150×56, and 203×203×56, respectively. Each grid
is centered within the next coarsest grid.
The temperature and moisture profiles used to initialize the model are the mean Atlantic hurricane season sounding of Jordan (1958) which is slightly moister at low levels than used by NM13. The details of the procedure used for the ini-tial vortex are discussed by Montgomery et al. (2006). For the full physics simulations the initial mid-level vortex is simi-lar to that shown in Fig. 1 of NM13, with maximum winds of 8 m s−1 at a radiusr
=75 km and a height of z=4 km.
The core of the vortex is moistened to 85 % of saturation with respect to water below 8 km. The model is configured for an f-plane at latitude of 15◦. The center of the domain for these simulations is at a longitude of−40◦. The shortwave
radiation computation accounts for the longitudinal varia-tion of the solar zenith angle. All simulavaria-tions are begun at 1200 GMT. The sea surface temperature for the full physics simulations is set to a constant value of 29◦C.
4 Results
4.1 Idealized experiments with prescribed forcing In the first experiment a cooling rate is specified for a radius greater than 200 km from the center of the domain, and has maximum amplitude at a height of 8 km. The cooling extends from the surface where the cooling rate is−1.2×10⁻⁵K s−1
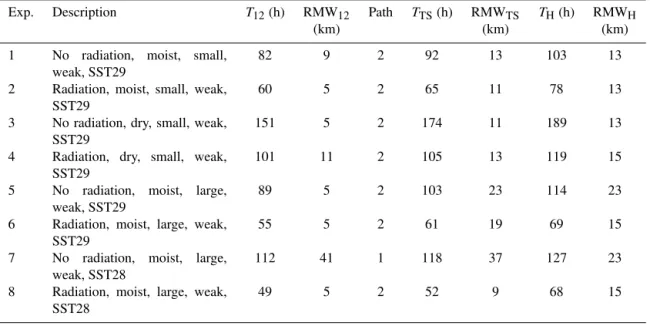
up to a height of 16 km. The maximum amplitude of the cooling at 8 km is −2.8×10⁻⁵K s−1. Figure 1 shows x/z
vertical sections through the center of the domain of po-tential temperature perturbation, pressure perturbation, x -component of velocity u, and vertical velocity at 50 min. The cooling has begun to produce a decrease in the temperature of the environment. A laterally propagating wave-like circula-tion has formed at the boundary between the cooled and
non-(a) Potential temperature perturbation
(d) x-component of velocity (u) (c) Vertical velocity
(b) Pressure perturbation
Figure 1.Vertical sections for Experiment 1: the maximum cooling
aloft case, att=50 min.(a)Potential temperature perturbation (K),
(b)pressure perturbation (mb),(c)vertical velocity (m s−1), and(d)
x-component of velocity,u(m s−1).
cooled regions. A region of upward motion is propagating towards the center, whereas a region of downward motion is propagating into the environment. The circulation has a sim-ilarity to the two-dimensional solutions obtained by Nicholls et al. (1991), but clearly the three-dimensional geometry of this simulation has some important implications. For in-stance, the ring of upward motion near the center is stronger in magnitude than the ring of downward motion in the envi-ronment. The circulation is associated with a high-pressure perturbation at the surface and a low-pressure perturbation aloft that is propagating towards the center. The uplift is caus-ing the air to cool adiabatically, creatcaus-ing a bulge of cold air in the core at mid-tropospheric levels where the upward motion is strongest. The upward motion has a maximum of approxi-mately 6 mm s−1and the horizontal motions, while
consider-ably larger with a magnitude of approximately 0.1 m s−1, are
(a) Potential temperature perturbation (b) Vertical velocity
(c) Relative humidity (d) Vapor perturbation
(e) x-component of velocity (u) (f) y-component of velocity (v)
Figure 2.Vertical sections for Experiment 1: the maximum cooling
aloft case, at t=12 h.(a)Potential temperature perturbation (K),
(b) vertical velocity (m s−1),(c)relative humidity,(d) vapor
per-turbation (g kg−1),(e)x-component of velocity,u(m s−1), and(f)
y-component of velocity,v(m s−1).
significant changes result in the core. Figure 2d, showing the vapor mixing ratio anomaly, indicates that the vertical motion has produced the largest change in the lowest 2 km of approx-imately 0.7 g kg−1where the vertical gradient of moisture in
the Jordan sounding is largest (not shown). There is a small increase in the low-level relative humidity near the surface in the environment, which must be due to the cooling since there is no increase in the environmental vapor mixing ratio. Figure 2e shows that by far the strongest horizontal motions occur near the surface at a radius of 200 km. The surface in-flow at 12 h is fairly substantial, with a magnitude of approx-imately 0.8 m s−1, which is considerably stronger than the horizontal motions that occurred at 50 min associated with the inward propagating wave-like feature shown in Fig. 1. Due to the Coriolis force there has been a small but signif-icant increase in the cyclonic winds at the same location of approximately 1 m s−1(Fig. 2f).
This simulation was also run in two dimensions to see whether there was a significant three-dimensional aspect to the relatively strong updraft in the unforced core.
Interest-(a) Potential temperature perturbation (b) Vertical velocity
(c) Relative humidity (d) Relative humidity perturbation
Figure 3.Vertical sections for Experiment 2: the maximum cooling
aloft and weaker maximum at low-level case, att=12 h.(a)
Poten-tial temperature perturbation (K),(b)vertical velocity (m s−1),(c)
relative humidity, and(d)relative humidity perturbation.
ingly, the results were qualitatively similar in many aspects. The updraft was about 20 % weaker at 12 h, but it still re-sulted in significant changes to relative humidity and poten-tial temperature in the core. A major difference was that the deep pulses of subsidence propagating towards the bound-aries were much more evident since they did not decrease in amplitude so quickly. The leading edges of the pulses reached the open boundaries at approximately 4.5 h and then propagated through them. The distance the pulses travelled to the lateral boundaries from where they formed at 200 km from the center was about 800 km. This gives a propagation speed of about 49 m s−1. The pulses were about 14 km deep, so the speed seems in reasonable agreement with the speed of the first mode estimated from Eq. (1), discussed in the in-troduction, to be about 48 m s−1for a 15 km deep wave.
Figure 3 shows results for the second experiment at 12 h that has the same environmental cooling as the first except there is enhanced cooling near the surface. This case pro-duces increased low-level upward motion in the core that in-creases the low-level relative humidity, with the largest per-turbation occurring just below 2 km (Fig. 3d). Also, the in-creased environmental cooling near the surface produces a notable increase in the low-level relative humidity in the en-vironment.
re-sulted in significant changes to the relative humidity, lapse rates and surface cyclonic circulation in the unforced core of the system. In addition to the changes caused by the induced circulations there was a notable increase in low-level rela-tive humidity in the environment caused by the environmen-tal cooling in Experiment 2, which could also influence the development of convection. The latter is the second mecha-nism of radiative influence on cloud clusters discussed in the introduction.
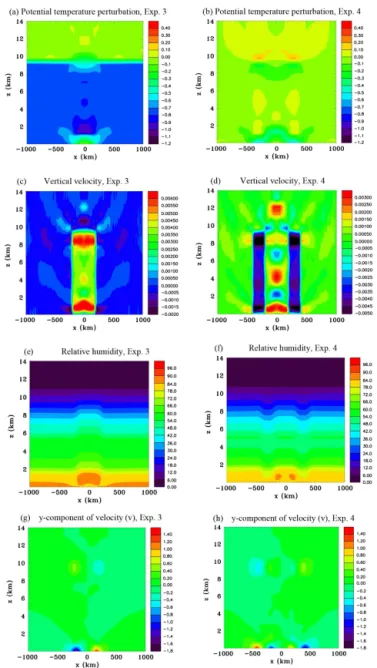
Experiment 3 examines the response to an environmental cooling that is uniform beneath 10 km with a value of−1.5 K
day−1. In Fig. 4 this case is compared at 12 h with
Experi-ment 4, which has the same uniform cooling rate prescribed beneath 10 km in an annulus between 200 and 400 km from the center. Although the air in the annulus became colder dur-ing the first hour, this did not persist, and by 12 h it can be seen that there are only weak temperature changes in the an-nulus. There is a weak cooling at the surface, but much of the air in the annulus is actually very slightly warmer. The case with cooling throughout the environment is similar to the first two experiments, but is more uniform in the verti-cal, except at low levels in the unforced core. There is weak downward motion of a few mm s−1in the cooled annulus and this results in a significant decrease in relative humidity. This is due to downward advection of drier air, which is evident since the small potential temperature change in the annulus is not enough to significantly influence the humidity except near the surface. The decrease in potential temperature next to the surface is due to the applied cooling, which is not off-set much by adiabatic warming since the subsidence there is small. This results in an increase in humidity in a very thin layer adjacent to the surface. In the core the upward motions are considerably less at 12 h for the annulus case and there are regions of downward motion atz=2 and 7 km. There is an increase in surface cyclonic flow, but it is not as large as for the case with cooling throughout the environment. There is also anticyclonic flow at the surface at a radius of 400 km. Experiment 5 has a much larger annulus that extends to a radius of 1000 km. Figure 5 shows results at 5 h. At this stage the air is colder in the cooled annulus, but a very deep region of subsidence is evident travelling from the edge of the outer annulus boundary inwards towards the center that is tending to warm adiabatically the air in the annulus, counteracting the diabatic cooling below 10 km, as well as warming the air above 10 km. At the same time a region of upward motion that is weaker in magnitude can be seen propagating into the environment. At the inner annulus boundary a ring of up-ward motion propagated into the core and caused a strong sustained upward motion as seen in Fig. 5b, similarly to the other cases. A ring of downward motion also propagated out-wards from the inner annulus boundary and is superimposed with the inward propagating downward motion. It is smaller in magnitude, however, so the inward propagating downward motion is more evident. It is clear that this inward propagat-ing downward motion is gopropagat-ing to significantly influence the
Figure 4.Vertical sections comparing Experiment 3: the uniform
cooling case with Experiment 4, the small annulus case, att=12 h.
(a)and(b)potential temperature perturbation (K),(c)and(d)
ver-tical velocity (m s−1),(e)and(f)relative humidity, and(g)and(h)
y-component of velocity,v(m s−1), for Experiments 3 and 4,
re-spectively.
vertical velocities in the center when reaching it. This situ-ation also occurred for the 200 km annulus previously dis-cussed, but is more easily seen for this larger annulus case. At this time there has been a significant increase in relative humidity in the center and a small decrease in the annulus.
(a) Potential temperature perturbation (b) Vertical velocity
(c) Relative humidity
Figure 5.Vertical sections for Experiment 5: the large annulus case,
att=5 h.(a)Potential temperature perturbation (K),(b) vertical
velocity (m s−1), and(c)relative humidity.
significant upward motion as it did at 5 h except close to the surface. There has been a significant increase in the relative humidity in the core, but not as large as for the case shown in Fig. 4e with the cooling throughout the environment. There is some increase in relative humidity at low levels in the an-nulus, where apparently the downward motion is too weak to counteract the increase due to cooling. The anticyclonic sur-face winds are considerably stronger at the outer boundary of the annulus than at the inner boundary.
The annulus experiments show that the response in the core becomes more significant as the size of the region that is cooled is increased as might be expected. They also show that the response can be quite complicated and that there can be significant drying within the cooled region due to subsidence. This case is extremely idealized and would not occur in na-ture, but is relevant to a full physics simulation of tropical cyclogenesis that will be discussed later. It further illustrates the fast propagation of these thermally generated circulations that travel in a wave-like manner and how the magnitude of the vertical velocity is increased or diminished depending on whether the direction of propagation is towards the center or away from it, respectively.
In light of the results of the annulus experiments two other simulations were run without an annulus, which will be briefly mentioned. It would appear that it is important to have a very large surrounding cloud-free environment for the region representing the cloud cluster to be significantly in-fluenced by circulations induced by environmental cooling. A simulation was run similarly to Experiment 3, but with a much reduced domain size with a width of only 600 km. Additionally, a second simulation was conducted for this
re-duced grid size with the open boundary conditions replaced by cyclic boundary conditions. In spite of the reduced size of the domain, results for the first simulation were quite simi-lar to Experiment 3, showing significant modification of the core due to induced upward motion. The open boundary con-ditions allowed the outward propagating pulse of downward motion to propagate without reflection when it reached the boundary and persistent low-level inflow and upper-level out-flow at the boundary were established. The strong horizontal pressure gradients responsible for accelerating the inflow at low levels and outflow at high levels were for the most part still represented in the smaller domain simulation. So, it was not necessary to have a large domain size to simulate sus-tained upward motion in the core when radiative boundary conditions were used. One might say, however, that in the real atmosphere, if horizontal gradients in radiative forcing in the far environment surrounding a cloud cluster were to oc-cur at some point in time, possibly due to clouds, they would generate circulations that would propagate towards the clus-ter, and depending on their strength and duration, could even-tually have some influence on it. The effect of environmental cooling at night is therefore going to be more effective when there is a large region of clear sky surrounding the cloud cluster. The second simulation showed a significant differ-ence with Experiment 3 since the pulse of outward propagat-ing downward motion propagated back into the domain be-cause of the cyclic boundary conditions. This resulted in less modification of the unforced core’s relative humidity and po-tential temperature. This latter experiment could be consid-ered to qualitatively mimic what might happen when there are nearby cloud clusters, which would apparently reduce the sustained upward motion in the core produced by nighttime clear-sky radiative cooling.
Experiment 6 examines the sensitivity to increasing the size of the unforced core region to a radius of 600 km for a uniform cooling below 10 km in the environment. Figure 7 shows that for this case the colder air at 12 h is less horizon-tally homogeneous than for a radius of 200 km (Fig. 4a). A minimum occurs at middle levels in the core. There is still a fairly significant increase in relative humidity in the core, al-though this is noticeably a maximum near its periphery. This result suggests that the center of a large tropical cyclone will be less impacted by the differential radiative forcing mecha-nism than a small one.
(a) Potential temperature perturbation
(c) Relative humidity (d) y-component of velocity (v) (b) Vertical velocity
Figure 6.Vertical sections for Experiment 5: the large annulus case,
att=12 h.(a)Potential temperature perturbation (K),(b)vertical
velocity (m s−1),(c)relative humidity, and(d)y-component of
ve-locity,v(m s−1).
which is a maximum at noon. The simulation was run for 72 h. Figure 8b compares the potential temperature change at a height of 5 km in the environment with the change in the core at the same height. The first 12 h is identical to Experi-ment 3 (Fig. 4) that was compared to the annulus experiExperi-ment. The temperature decreases first in the environment, but 2 h later it has decreased by as much in the center of the core. Later in the simulation the core temperature anomaly is ac-tually slightly larger in magnitude than in the environment, although the reason for this behavior is unclear. The core temperature at this level is closely matching what happens in the environment with little time lag. During the nighttime there is a steady decrease in temperature and then a leveling off in the daytime.
Figure 9a–h shows vertical sections at various times for the idealized diurnal cycle simulation. Figure 9a shows the ver-tical velocity at 18 h, when the environmental cooling rate is zero, representing the middle of the day. The upward motion that existed at 12 h (Fig. 4c) has been replaced by very weak downward motion through most of the core below 10 km. Figure 9b shows the vertical velocity at 30 h in the middle of the night. Significant upward motion now extends below 10 km through the core except near the surface. Figure 9c shows the vertical velocity at 72 h, which is at the end of the third day. There is downward motion near the surface in the core and a weak shallow outflow at the surface (Fig. 9g). The temperature of the air in the core is similar to that in the en-vironment except at low levels (Fig. 9d). There has been a significant increase in the relative humidity both in the envi-ronment and in the core. In the envienvi-ronment it is due to the diabatic cooling, whereas in the core it is due to the forced
(a) Potential temperature perturbation (b) Vertical velocity
(c) Relative humidity
Figure 7.Vertical sections for Experiment 6: the wide unforced
re-gion case, att=12 h.(a)Potential temperature perturbation (K),
(b)vertical velocity (m s−1), and(c)relative humidity.
upward motion, which was strong in the three nighttime peri-ods. The core relative humidity is larger than in the environ-ment except at the surface. Similarly to Experienviron-ment 2 the per-turbation of relative humidity from the initial state is largest just below 2 km. Although the flow at 72 h is slightly diver-gent at the surface, there was mean low-level convergence during the simulation, which resulted in a notable increase in the cyclonic flow of approximately 3 m s−1(Fig. 9f).
Results of this diurnal experiment suggest that if a cloud canopy forms aloft that reduces longwave cooling beneath it, then the environmental radiative forcing will induce a tem-perature tendency at mid levels in the core that will be similar to what occurs in the environment with only a small time lag. The temperature tendencies will follow the day/night modu-lations of the environment and except near the surface would also have the same vertical profile. The small time lag ap-pears to be a consequence of the fast propagation speed of the thermally forced gravity wave modes. The temperature ten-dencies would presumably be superimposed on those occur-ring in the cloud system caused by latent heating or cooling, although this has not been demonstrated here. The induced mean upward motion tendency would increase the humidity in the core, most likely favoring the development of convec-tion.
(a) Environmental diurnal forcing
(b) Potential temperature change
Figure 8.Time series for Experiment 7: the idealized diurnal
forc-ing case.(a)Environmental forcing forr >200 km,z <10 km, and
(b)potential temperature change in the environment atr=660 km
andz=5 km, and at the center of the unforced region atz=5 km.
only activated for a radius less than 200 km from the center, which results in a similar scenario. There has been no at-tempt to match the magnitude and spatial distribution of the heating aloft and cooling below with the full physics sim-ulations. Instead, a uniform heating rate of 1.5 K day−1 is specified between 5 and 10 km and a uniform cooling rate of −1.5 K day−1between the surface and 5 km, for a more
straightforward comparison with some of the previous sim-ulations. Figure 10a–f compares fields at 1 and 12 h. Fig-ure 10a shows that at 1 h there is air that is slightly warmer above air that is slightly colder, as might be expected from the spatial distribution of the heating/cooling function. The magnitude of heating/cooling matches what is expected from the applied forcing∼ 0.06 K h−1. Figure 10b shows,
how-ever, that at 12 h this pattern has changed considerably. The only notable warm and cold regions at 12 h are at the vertical boundaries of the heating/cooling regions, although they are still very small in magnitude. Figure 10c shows that signif-icant vertical motions originate at the lateral boundaries of the heating/cooling regions and propagate both towards the center and into the environment. This behavior is because the heating/cooling functions are horizontally homogeneous
Figure 9.Vertical sections for Experiment 7: the idealized diurnal
forcing case.(a)Vertical velocity att=18 h (m s−1),(b)vertical
velocity att=30 h (m s−1),(c)vertical velocity att=72 h (m s−1),
(d)potential temperature perturbation att=72 h (K),(e)relative
humidity at t=72 h, (f) y-component of velocity, v at t=72 h
(m s−1),(g)x-component of velocity, u att
=72 h (m s−1), and
(h)relative humidity perturbation att=72 h.
(c) Vertical velocity at 1 h
(e) Relative humidity at 1 h
(d) Vertical velocity at 12 h
(f) Relative humidity at 12 h (a) Potential temperature perturbation at 1 h (b) Potential temperature perturbation at 12 h
Figure 10.Vertical sections for Experiment 8: the forced core case
att=1 and 12 h.(a)and(b)potential temperature perturbation (K),
(c)and(d)vertical velocity (m s−1), and(e)and(f)relative
humid-ity, att=1 and 12 h, respectively.
upward motion in the heated region and downward motion in the cooling region, although there are considerable inho-mogeneities. This has led to a notable increase in relative humidity in the heating region and a decrease in the cooling region. One aspect that this experiment illustrates is that care has to be taken when inferring changes in static stability that might arise from radiative heating profiles that vary in the vertical, because in this case, where the forcing has limited horizontal extent, these changes become negligible in a short time.
Experiment 9 considers the response when there is a rel-atively weak vortex present. The radial distribution of uni-form coolingz <10 km is the same as in Experiment 3. The vortex has a depth of 12 km and is strongest at the surface, with a wind speed of 12 m s−1 at a radius of 75 km. Fig-ure 11a shows the initial relative humidity, which is slightly perturbed in the vortex because of the temperature and pres-sure anomalies associated with it, while Fig. 11b–e show vertical sections at 12 h of they-component of velocity, po-tential temperature perturbation, vertical velocity and rela-tive humidity, respecrela-tively. At 12 h there has been only a slight weakening of the vortex strength. The temperature has
(a) Initial relative humidity
(e) Relative humidity at 12 h
(b) y-component of velocity (v) at 12 h
(c) Potential temperature perturbation at 12 h (d) Vertical velocity at 12 h
Figure 11.Vertical sections for Experiment 9: the weak vortex case.
(a)Relative humidity att=0 h,(b)y-component of velocity,vat
t=12 h (m s−1),(c)potential temperature perturbation att=12 h
(K),(d)vertical velocity att=12 h (m s−1), and(e)relative
humid-ity att=12 h.
cooled significantly in the environment and throughout most of the vortex except near the surface central region where the vertical velocity is weak. The vertical velocity peaks just out-side the radius of maximum winds, which leads to the most significant increase in relative humidity at this location. This result shows that the vortex is having a considerable influ-ence on the induced motion in the unforced core.
Experiment 10 is similar to the previous experiment except that the vortex strength is increased to 30 m s−1. Figure 12
shows a more pronounced minimum in vertical velocity at the center of the vortex. Just outside the radius of maximum winds there is still a significant increase in the relative hu-midity. This result suggests that environmental radiative forc-ing at lower and middle levels could still have a significant influence on the convection within a strong tropical cyclone, but that it is more likely to impact the outer region of the system.
(a) Relative humidity at 0 h (b) y-component of velocity (v) at 12 h
(c) Potential temperature perturbation at 12 h (d) Vertical velocity at 12 h
(e) Relative humidity at 12 h
Figure 12. Vertical sections for Experiment 10, the strong vortex
case.(a)Relative humidity at t=0 h,(b) y-component of
veloc-ity,vatt=12 h (m s−1),(c)potential temperature perturbation at
t=12 h (K),(d)vertical velocity att=12 h (m s−1), and(e)
rela-tive humidity att=12 h.
equation (Wirth and Dunkerton, 2006, 2009; Pendergrass and Willoughby, 2009; Vigh and Schubert, 2009). These analy-ses lead to consideration of the “transverse circulation equa-tion” first derived by Eliassen (1951). A similar analysis that includes representation of environmental radiative forcing could potentially provide a fuller interpretation of the results found for the vortex experiments shown in this study. The ne-glect of the time derivative of radial velocity in the radial mo-mentum equation means that the thermally generated pulses of vertical motion that eventually propagate into the far en-vironment would not be simulated; nevertheless the induced sustained upward motion in the vortex should qualitatively be the same. This could lend insight into the reason for the radial variation of vertical velocity induced in the vortex. A reasonable speculation is that it is a consequence of the iner-tial stability of the vortex.
(a) Initial y-component of velocity (v) (b) Initial relative humidity
Figure 13. Vertical sections for Experiment 11: the radiation
scheme activated in the whole domain with a mid-level vortex case.
(a)y-component of velocity,v(m s−1), and(b)relative humidity,
att=0 h.
4.2 Idealized experiments with radiation scheme included
Experiment 11 proceeds to examine the response to the Har-rington radiation scheme, instead of specified forcing, for the same initial vortex that will be used for the full physics sim-ulations. There are no clouds or cloud-radiative feedbacks. Figure 13 shows vertical sections of the initialy-component of velocity and relative humidity. The core of the vortex has been moistened to 85 % of saturation similarly to many of the experiments in NM13, which encourages the development of a tropical cyclone in the full physics simulations. A dif-ference with the previous simulations is that instead of the vapor mixing ratio abruptly being set to zero above 11 km there is a more gradual decrease with height. The infrared cooling between 7 and 9 km is quite sensitive to the exis-tence of small amounts of water vapor aloft. A more gradual reduction with height decreases the infrared cooling rate in this layer (Norman Wood, personal communication), which without this modification is quite large.
Figure 14 shows the radiative flux convergence and ver-tical velocity at 4 h into the simulation, which is during the middle of the day. At this time the solar heating is stronger than the infrared cooling in the upper troposphere and be-tween 1 and 6 km. The strongest cooling occurs at the top of the moistened core and the strongest heating between 5 and 6 km, producing downward and upward motion, respectively. An east–west asymmetry can be seen in the radiative forcing due to longitudinal variation of the solar radiation.
Figure 15 shows fields at 10 h during the early nighttime. A layer of strong cooling of approximately−3 K day−1