GID
5, 19–37, 2015Global trends of drought severity
index
P. I. Orvos et al.
Title Page
Abstract Introduction
Conclusions References
Tables Figures
◭ ◮
◭ ◮
Back Close
Full Screen / Esc
Printer-friendly Version Interactive Discussion
Discussion
P
a
per
|
Discussion
P
a
per
|
Discussion
P
a
per
|
Discussion
P
a
per
|
Geosci. Instrum. Method. Data Syst. Discuss., 5, 19–37, 2015 www.geosci-instrum-method-data-syst-discuss.net/5/19/2015/ doi:10.5194/gid-5-19-2015
© Author(s) 2015. CC Attribution 3.0 License.
This discussion paper is/has been under review for the journal Geoscientific Instrumentation, Methods and Data Systems (GI). Please refer to the corresponding final paper in GI if available.
Global trend analysis of the MODIS
drought severity index
P. I. Orvos1,2, V. Homonnai2, A. Várai3, Z. Bozóki4, and I. M. Jánosi2,3
1
Department of Optics and Quantum Electronics, University of Szeged, Szeged, Hungary 2
Regional Research Center, Eötvös Loránd University, Székesfehérvár, Hungary 3
Department of Physics of Complex Systems, Eötvös Loránd University, Budapest, Hungary 4
MTA-SZTE Research Group on Photoacoustic Spectroscopy, University of Szeged, Szeged, Hungary
Received: 25 September 2014 – Accepted: 5 January 2015 – Published: 21 January 2015
Correspondence to: I. M. Jánosi ([email protected])
GID
5, 19–37, 2015Global trends of drought severity
index
P. I. Orvos et al.
Title Page
Abstract Introduction
Conclusions References
Tables Figures
◭ ◮
◭ ◮
Back Close
Full Screen / Esc
Printer-friendly Version Interactive Discussion
Discussion
P
a
per
|
Discussion
P
a
per
|
Discussion
P
a
per
|
Discussion
P
a
per
|
Abstract
Recently, Mu et al. (2013) have compiled an open access data base of a remotely sensed global drought severity index (DSI) based on MODIS satellite measurements covering a continuous period of 12 years. The highest spatial resolution is 0.05◦
×0.05◦
in the geographic band between 60◦S and 80◦N latitudes (more than 4.9 million
lo-5
cations over land). Here we present a global trend analysis of these satellite based DSI time series in order to identify geographic areas where either positive or negative trends are statistically significant. Since a DSI value conveys local characterisation at a given site, we argue that usual field significance tests cannot provide more informa-tion about the observainforma-tions than the presented analysis. We are fully aware of the fact
10
that 12 years are too short for establishing any link to global climate change, however a series of severe droughts or inland inundation on a scale of a decade might have devastating consequences for affected human communities.
1 Introduction
Severe droughts or floods are pernicious events for both ecosystems and human
so-15
ciety. There are several indices used widely for drought assessment integrating large amounts of data (precipitation, snow-pack, stream-flow, etc.). Probably the best known is the Palmer drought severity index (PDSI) (Palmer, 1968; Alley, 1984) determined by monthly water supply (precipitation), water outputs (evaporation and runoff), and pre-ceding soil water status. New variants of the original approach have been emerged in
20
order to overcome some limitations of the Palmer model (Alley, 1984; Keyantas and Dracup, 2002), such as the self-calibrating PDSI by Wells et al. (2004) or PDSI incor-porating improved formulations for potential evapotranspiration (Heim, 2002). Remote sensing data from the Moderate Resolution Imaging Spectroradiometer (MODIS) com-bined with NCEP reanalysis meteorological records and statistical procedures together
25
GID
5, 19–37, 2015Global trends of drought severity
index
P. I. Orvos et al.
Title Page
Abstract Introduction
Conclusions References
Tables Figures
◭ ◮
◭ ◮
Back Close
Full Screen / Esc
Printer-friendly Version Interactive Discussion
Discussion
P
a
per
|
Discussion
P
a
per
|
Discussion
P
a
per
|
Discussion
P
a
per
|
2014) at 4 km spatial and 1 month temporal resolutions. Nevertheless the development and improvement of drought indices are incomplete tasks, and numerous challenges remain for the future (Vicente-Serrano et al., 2011).
In order to better exploit the strengths of continuous satellite observations, Mu et al. (2013) have recently developed a remotely sensed global drought severity index (DSI),
5
and compiled an open access data base spanning 12 years between 2000 and 2011 at a temporal resolution of 8 days. The highest spatial resolution is around 5 km (0.05◦×0.05◦) with an almost global coverage. Permanently unvegetated locations such
as deserts, high mountains, lakes, or large cities cannot provide input for DSI data, because the computation algorithm incorporates the normalised difference vegetation
10
index (MOD13 NDVI product), besides the evapotransiraton and potential evapotran-spiration ratio data (MOD16 ET/PET product), for details see Mu et al. (2013).
To our best knowledge, the most comprehensive and longest PDSI trend analysis has been provided by Dai et al. (2004). A monthly PDSI data set from 1870 to 2002 has been derived using historical precipitation and temperature data for global land
ar-15
eas on a grid of 2.5◦×2.5◦. An empirical orthogonal function (EOF) analysis resulted in
a linear trend in the twentieth century, with drying over northern and southern Africa, the Middle East, Mongolia, and eastern Australia, and moistening over the United States, Argentina, and parts of Eurasia (Dai et al., 2004). A follow-up study by Dai (2011) com-pared the original and three other variants of PDSI records, but the main conclusion
20
remained the same: warming in the second half of the last century is responsible for much of the drying trend over several land areas. Increased heating itself from global climate change may not cause droughts but it is expected that when droughts occur they are likely to set in quicker and be more intense (Trenberth et al., 2014). However, similarly to the open questions on an optimal definition of a drought index, debates
25
on the trends are also not entirely closed (Sheffield et al., 2012; Damberg and Agha Kouchak, 2013; Spinoni et al., 2013).
GID
5, 19–37, 2015Global trends of drought severity
index
P. I. Orvos et al.
Title Page
Abstract Introduction
Conclusions References
Tables Figures
◭ ◮
◭ ◮
Back Close
Full Screen / Esc
Printer-friendly Version Interactive Discussion
Discussion
P
a
per
|
Discussion
P
a
per
|
Discussion
P
a
per
|
Discussion
P
a
per
|
linear trends by data shuffling (see Sect. 2). Our main result is that 17 % of the land area exhibit significant trends of both signs (drying or wetting), and most of such locations are joined to large, geographically correlated areas. We emphasise that the usual field significance tests (Benjamini and Hochberg, 1995; Douglas et al., 2000; Ventura et al., 2004; Wilks, 2006; Renard et al., 2008) cannot give more reliable estimates, because
5
a DSI value as defined provide a fully local characterisation, and the same numerical value can be related to very different local circumstances. The relatively short period of 12 years hinders to link the trends to global climate change, we rather think that the observations might reveal a slow (decadal) mode of natural climate variability. Corre-lations with other atmospheric and oceanic variables are found at various (statistically
10
insignificant) levels, therefore at the moment we cannot prove any causal relationship or propose a solid explanation of the observations.
2 Data and methods
DSI records at 4 914 440 geographic locations are evaluated in order to identify linear trends. Each individual record consists of 552 points covering 12 years from 1
Jan-15
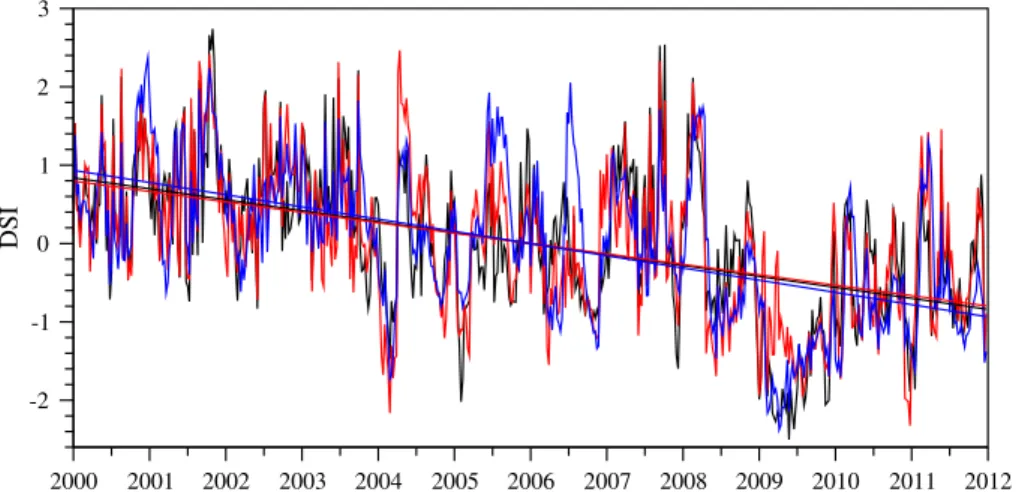
uary 2000 to 31 December 2011. The basic time-step is 8 days, apart from the neces-sary cuts at the end of each year. Example time series and linear trends are shown in Fig. 1 for three nearby locations (at the same latitude) in Argentina, where significant negative trends are identified (see below).
Statistical significance of slopes is verified by the standard permutation test (Manly,
20
2007). Since most of the DSI signals exhibit marked persistence on time scales of weeks or even months (see Fig. 1), the basic unit of data shuffling was one whole cal-endar year. We cut a given record into 12 pieces, and built a test set from randomly shuffled and glued years. The mean slope and standard deviationσ were determined,
and we accepted a fitted slope of a measured record to be significant when its
dis-25
tance from zero was larger than 2σ of its own test set. Figure 2 illustrates that a test
GID
5, 19–37, 2015Global trends of drought severity
index
P. I. Orvos et al.
Title Page
Abstract Introduction
Conclusions References
Tables Figures
◭ ◮
◭ ◮
Back Close
Full Screen / Esc
Printer-friendly Version Interactive Discussion
Discussion
P
a
per
|
Discussion
P
a
per
|
Discussion
P
a
per
|
Discussion
P
a
per
|
samples, however for the sake of minimising errors we fixed the test set size of 1000 samples. Obviously the larger the sample size the closer the histogram of obtained slopes to a pure Gaussian (not shown here), however the mean and variance do not show detectable sensitivity to the size of the test sets (Fig. 2).
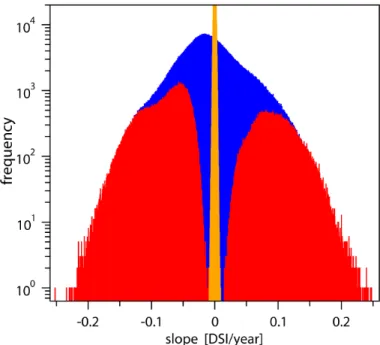
The histogram of all fitted slopes is shown in Fig. 3 (blue bars), note the
logarith-5
mic vertical scale. The shape is clearly not Gaussian with a mean value of−0.00875
and standard deviation of 0.04971 DSI year−1. Statistically significant local slopes are obtained for 852 373 data points (17.34 %) at 2σ level, the numbers for 2.5σ and 3σ
limits are 269 900 (5.49 %) and 16 321 (0.33 %), respectively. Negative (drying) trends have a mean slope of−0.05466±0.04535, while significant positive slopes are around
10
0.02892±0.04685 DSI year−1. Obviously, spatial correlations bias these numerical
val-ues (Benjamini and Hochberg, 1995; Douglas et al., 2000; Ventura et al., 2004; Wilks, 2006; Renard et al., 2008), however we will demonstrate that a proper interpretation of DSI should be based on local information.
3 Results and discussion
15
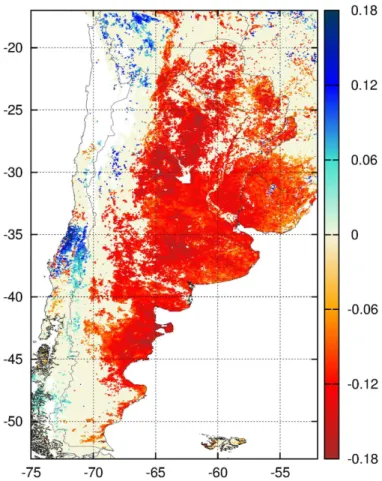
The main result of the present analysis is illustrated in Fig. 4. Note that reddish and blueish colouration indicate sites of significant DSI trends, and the zero level is not white (the latter is used to identify missing locations). There are several geographically connected areas exhibiting “drying” (South America, Middle Asia or Sub-Equatorial Africa) or “wetting” (Middle and North Africa, Indian Peninsula or Eastern Spain)
ten-20
dencies.
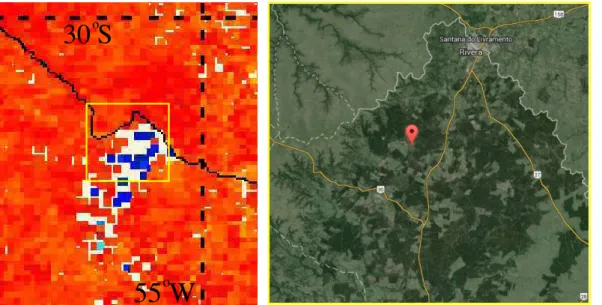
In order to demonstrate the power of high resolution mapping, we illustrate zooms in South America (Figs. 5 and 6) and India (Fig. 7). In both cases, we show examples where significant trends at isolated locations have a plausible explanation, and they are not observational error. In Fig. 6, an area at the border of Uruguay and Brazil is
25
GID
5, 19–37, 2015Global trends of drought severity
index
P. I. Orvos et al.
Title Page
Abstract Introduction
Conclusions References
Tables Figures
◭ ◮
◭ ◮
Back Close
Full Screen / Esc
Printer-friendly Version Interactive Discussion
Discussion
P
a
per
|
Discussion
P
a
per
|
Discussion
P
a
per
|
Discussion
P
a
per
|
yellow circle in Fig. 7 (see also the Inset) identifies the pixels around the Indira Sagar Reservoir, which is constructed as the key project of a large multipurpose river basin development on the river Narmada. Full scale energy production has been started in 2005, just in the middle of the observed period. Most probably the gradual filling up of the reservoir resulted in a decreasing vegetated area, thus the DSI signal reflects
5
a decreasing trend in spite of the fact that the same area stores a huge amount of water. We think that these observations provide a clear example of the complexity behind a proper interpretation of DSI data and DSI trends.
We emphasise that the remotely sensed DSI is a standardised variable (Mu et al., 2013), thus values and trends provide local information: the same numerical value can
10
be connected to very different local circumstances. The examples shown in Figs. 6 and 7 illustrate that there is no easy interpretation of the observed trends, especially on such large geographic areas as identified in Figs. 5 and 7 covering several local climatic regions and river basins.
The question naturally arises, which factors can be related with the observations. As
15
for South America, Saurral et al. (2013) identified a pattern of enhanced rainfall activity over the South Atlantic Convergence Zone in summer when sea ice cover is above av-erage over the Weddell Sea area, while winter SIC anomalies exhibit negative and sig-nificant correlations with rainfall over much of South America. Grimm et al. (2000) found that the strengthening of the South Pacific high near central Chile in winter–spring
20
and the decrease of water vapour advection from the Atlantic into eastern Argentina and Uruguay in summer are climatic features related to precipitation. Barreiro et al. (2014) concluded that rainfall over subtropical South America has a strong relationship with SST anomalies on interdecadal time scales. Barrucand et al. (2014) studied spa-tially extended precipitation-deficit conditions (droughts) and found that warm and cold
25
dry months are related with specific mid-level circulation patterns (geopotential height anomalies at the level of 500 hPa).
GID
5, 19–37, 2015Global trends of drought severity
index
P. I. Orvos et al.
Title Page
Abstract Introduction
Conclusions References
Tables Figures
◭ ◮
◭ ◮
Back Close
Full Screen / Esc
Printer-friendly Version Interactive Discussion
Discussion
P
a
per
|
Discussion
P
a
per
|
Discussion
P
a
per
|
Discussion
P
a
per
|
alternatively for three consecutive decades. Singh and Sontakke (2002) reported on an increase in extreme rainfall events over northwest India during the summer mon-soon and a decline of the number of rainy days along east coastal stations in the past decades, resulting in a westward shift in rainfall activities. Similarly, Murumkar and Arya (2014) demonstrated by means of wavelet analysis that prominent annual rainfall
5
periods exist ranging from 2 to 8 years at all the studied stations after 1960s. Large scale spatial and temporal correlations between the trends of rainfall and temperature are found by Subash and Sikka (2013), without a direct relationship between increas-ing rainfall and increasincreas-ing maximum temperature of monthly or seasonal patterns over meteorological subdivisions of India. As for the particular area, even glaciers can be
10
listed as candidate explanatory factors, since they influence runoffinto lowland rivers, and recharge river-fed aquifers (Bolch et al., 2012). In order to illustrate the difficulties of interpreting DSI trends, Panda and Kumar (2014) also found increasing trends of extreme rainfall indices based on the percentile and absolute values, simultaneously with a significantly increased length of dry spells over northern and central regions of
15
India, suggesting a serious threat to the Indian agriculture.
The relatively short period of 12 years is not enough to connect the results with global climate change. Probably the interpretation of DSI values requires several explanatory variables, since the index itself is a complex quantity. Figure 8 illustrates example time series of standard atmospheric parameters (daily mean temperature, precipitation and
20
relative humidity) for two weather stations in Eastern Spain (Tortosa and Zaragosa) seemingly embedded in a rather large wetting region (data from Klein Tank et al., 2002). There is no sign of any trends in the time series during the study period, even when we check the previous decades (not plotted here).
We think that the observed significant DSI trends over extended geographic areas
25
GID
5, 19–37, 2015Global trends of drought severity
index
P. I. Orvos et al.
Title Page
Abstract Introduction
Conclusions References
Tables Figures
◭ ◮
◭ ◮
Back Close
Full Screen / Esc
Printer-friendly Version Interactive Discussion
Discussion
P
a
per
|
Discussion
P
a
per
|
Discussion
P
a
per
|
Discussion
P
a
per
|
4 Conclusions
We can summarise our findings in three points:
– The remotely sensed DSI records compiled by Mu et al. (2013) exhibit significant local trends in several geographic areas.
– Since the interpretation of DSI values and trends depend on several local factors
5
demonstrated in Figs. 6–8, standard field significance tests cannot provide more reliable results than the presented local trend survey.
– While the numerical values of the standardised drought severity index can be re-lated to very different local circumstances, a continent-wide tendency might be re-lated to either a slow mode of natural climate variability or global climate change.
10
The observational time of 12 years is certainly not long enough to conclude, how-ever there is clear call of a proper explanation of the observed trends.
Work is in progress to find an explanation of the observed trends. Candidate indices are the Northern Annular Mode/North Atlantic Oscillation, Southern Annular Mode, El Niño – Southern Oscillation, sea surface temperature (SST) anomalies, sea ice cover
15
(SIC), Atlantic Multidecadal Variability, etc. However, we intentionally avoid any over-interpretation, or vague explanation based on some cross-correlation coefficients.
Acknowledgements. This work was partially supported by the European Union and the Euro-pean Social Fund through projects FuturICT.hu (grant no. TAMOP-4.2.2.C-11/1/KONV-2012-0013), StratoClim-603557-FP7-ENV.2013.6.1-2, and by the Hungarian Science Foundation 20
GID
5, 19–37, 2015Global trends of drought severity
index
P. I. Orvos et al.
Title Page
Abstract Introduction
Conclusions References
Tables Figures
◭ ◮
◭ ◮
Back Close
Full Screen / Esc
Printer-friendly Version Interactive Discussion
Discussion
P
a
per
|
Discussion
P
a
per
|
Discussion
P
a
per
|
Discussion
P
a
per
|
References
Alley, W. M.: The Palmer drought severity index: limitations and assumptions, J. Clim. Appl. Meteorol., 23, 1100–1109, 1984. 20
Barreiro, M., Díaz, N., and Renom, M.: Role of the global oceans and land–atmosphere inter-action on summertime interdecadal variability over northern Argentina, Clim. Dynam., 42, 5
1733–1753, 2014. 24
Barrucand, M., Vargas, W., and Bettolli, M. L.: Warm and cold dry months and associated circulation in the humid and semi-humid Argentine region, Meteorol. Atmos. Phys., 123, 143– 154, 2014. 24
Benjamini, Y. and Hochberg, Y.: Controlling the false discovery rate – a practical and powerful 10
approach to multiple testing, J. Roy. Stat. Soc. Ser. B, 57, 289–300, 1995. 22, 23
Bolch, T., Kulkarni, A., Kääb, A., Huggel, C., Paul, F., Cogley, J. G., Frey, H., Kargel, J. S., Fujita, K., Scheel, M., Bajracharya, S., and Stoffel, M.: The state and fate of Himalayan glaciers, Science, 336, 310–314, 2012. 25
Dai, A.: Characteristics and trends in various forms of the Palmer Drought Severity Index during 15
1900–2008, J. Geophys. Res. 116, D12115, doi:10.1029/2010JD015541, 2011. 21
Dai, A., Trenberth, K. E., and Qian, T.: A global dataset of Palmer drought severity index for 1870–2002: relationship with soil moisture and effects of surface warming, J. Hydrometeorol., 5, 1117–1130, 2004. 21
Damberg, L. and Agha Kouchak, A.: Global trends and patterns of drought from space, Theor. 20
Appl. Climatol., 117, 441–448, doi:10.1007/s00704-013-1019-5, 2014. 21
Douglas, E. M., Vogel, R. M., and Kroll, C. M.: Trends in floods and low flows in the United States: impact of spatial correlation, J. Hydrol., 240, 90–105, 2000. 22, 23
Grimm, A. M., Barros, V. R., and Doyle, M. E.: Climate variability in southern South America associated with El Niño and La Niña events, J. Climate, 13, 35–58, 2000. 24
25
Hansen, J., Ruedy, R., Sato, M., and Lo, K.: Global surface temperature change, Rev. Geophys., 48, RG4004, doi:10.1029/2010RG000345, 2010.
Heim Jr., R. R.: A review of twentieth-century drought indices used in the United States, B. Am. Meteorol. Soc., 83, 1149–1165, 2002. 20
Keyantash, J. and Dracup, J. A.: The quantification of drought: an evaluation of drought indices, 30
GID
5, 19–37, 2015Global trends of drought severity
index
P. I. Orvos et al.
Title Page
Abstract Introduction
Conclusions References
Tables Figures
◭ ◮
◭ ◮
Back Close
Full Screen / Esc
Printer-friendly Version Interactive Discussion
Discussion
P
a
per
|
Discussion
P
a
per
|
Discussion
P
a
per
|
Discussion
P
a
per
|
Klein Tank, A. M. G., Wijngaard, J. B., Können, G. P., Böhm, R., Demarée, G., Gocheva, A., Mileta, M., Pashiardis, S., Hejkrlik, L., Kern-Hansen, C., Heino, R., Bessemoulin, P., Müller-Westermeier, G., Tzanakou, M., Szalai, S., Pálsdóttir, T., Fitzgerald, D., Rubin, S., Capaldo, M., Maugeri, M., Leitass, A., Bukantis, A., Aberfeld, R., van Engelen, A. F. V., Forland, E., Mietus, M., Coelho, F., Mares, C., Razuvaev, V., Nieplova, E., Cegnar, T., Antonio López, J., 5
Dahlström, B., Moberg, A., Kirchhofer, W., Ceylan, A., Pachaliuk, O., Alexander, L. V., and Petrovic, P.: Daily dataset of 20th-century surface air temperature and precipitation series for the European Climate Assessment, Int. J. Climatol., 22, 1441–1453, 2002. 25, 37
Kothyari, U. C. and Singh, V. P.: Rainfall and temperature trends in India, Hydrol. Process., 10, 357–372, 1996. 24
10
Manly, B. F. J.: Randomization, Bootstrap and Monte Carlo Methods in Biology, 3rd Edn., Chap-man and Hall/CRC, Boca Raton, 2007. 22
Mu, Q., Zhao, M., Kimball, J. S., McDowell, N. G., and Running, S. W.: A remotely sensed global terrestrial drought severity index, B. Am. Meteorol. Soc., 94, 83–98, 2013. 20, 21, 24, 26
15
Murumkar, A. R. and Arya, D. S.: Trend and periodicity analysis in rainfall pattern of Nira basin, Central India, Am. J. Clim. Change, 3, 60–70, 2014. 25
Palmer, W. C.: Keeping track of crop moisture conditions, nationwide: the new crop moisture index, Weatherwise, 21, 156–161, 1968. 20
Panda, D. K. and Kumar, A.: The changing characteristics of monsoon rainfall in India dur-20
ing 1971–2005 and links with large scale circulation, Int. J. Climatol., 34, 3881–3899, doi:10.1002/joc.3948, 2014. 25
Renard, B., Lang, M., Bois, P., Dupeyrat, A., Mestre, O., Niel, H., Sauquet, E., Prudhomme, C., Parey, S., Paquet, E., Neppel, L., and Gailhard, J.: Regional methods for trend detection: assessing field significance and regional consistency, Water Resour. Res., 44, W08419, 25
doi:10.1029/2007WR006268, 2008. 22, 23
Saurral, R., Barros, V., and Camilloni, I.: Sea ice concentration variability over the Southern Ocean and its impact on precipitation in southeastern South America, Int. J. Climatol., 34, 2362–2377, doi:10.1002/joc.3844, 2013. 24
Sheffield, J., Wood, E. F., and Roderick, M. L.: Little change in global drought over the past 30
60 years, Nature, 491, 435–438, 2012. 21
GID
5, 19–37, 2015Global trends of drought severity
index
P. I. Orvos et al.
Title Page
Abstract Introduction
Conclusions References
Tables Figures
◭ ◮
◭ ◮
Back Close
Full Screen / Esc
Printer-friendly Version Interactive Discussion
Discussion
P
a
per
|
Discussion
P
a
per
|
Discussion
P
a
per
|
Discussion
P
a
per
|
Spinoni, J., Naumann, G., Carrao, H., Barbosa, P., and Vogt, J.: World drought frequency, du-ration, and severity for 1951–2010, Int. J. Climatol., 34, 2792–2804, doi:10.1002/joc.3875, 2014. 21
Subash, N. and Sikka, A. K.: Trend analysis of rainfall and temperature and its relationship over India, Theor. Appl. Climatol., 117, 449–462, doi:10.1007/s00704-013-1015-9, 2014. 25 5
Trenberth, K. E., Dai, A., van der Schrier, G., Jones, P. D., Barichivich, J., Briffa, K. R., and Sheffield, J.: Global warming and changes in drought, Nat. Clim. Change, 4, 17–22, 2014. 21
Ventura, V., Paciorek, C. J. and Risbey, J. S.: Controlling the proportion of falsely rejected hypotheses when conducting multiple tests with climatological data, J. Climate, 17, 4343– 10
4356, 2004. 22, 23
Vicente-Serrano, S. M., Beguería, S., and López-Moreno, J. I.: Comment on “Characteristics and trends in various forms of the Palmer Drought Severity Index (PDSI) during 1900–2008” by Aiguo Dai, J. Geophys. Res., 116, D19112, doi:10.1029/2011JD016410, 2011. 21 Wells, N., Goddard, S., and Hayes, M. J.: A self-calibrating Palmer drought severity index, J. 15
Climate, 17, 2335–2351, 2004. 20
Wilks, D. S.: On “field significance” and the false discovery rate, J. Appl. Meteorol. Clim., 45, 1181–1189, 2006. 22, 23
Yao, Y., Liang, S., Qin, Q., and Wang, K.: Monitoring drought over the conterminous United States using MODIS and NCEP Reanalysis-2 data, J. Appl. Meteorol. Clim., 49, 1665–1680, 20
2010. 20
GID
5, 19–37, 2015Global trends of drought severity
index
P. I. Orvos et al.
Title Page
Abstract Introduction
Conclusions References
Tables Figures
◭ ◮
◭ ◮
Back Close
Full Screen / Esc
Printer-friendly Version Interactive Discussion
Discussion
P
a
per
|
Discussion
P
a
per
|
Discussion
P
a
per
|
Discussion
P
a
per
|
2000 2001 2002 2003 2004 2005 2006 2007 2008 2009 2010 2011 2012 -2
-1 0 1 2 3
DSI
Figure 1. Example DSI records of significant negative trends in Argentina along latitude 30.025◦S: 64.225◦W (black), 64.025◦W (red), and 63.775◦W (blue). Solid lines indicate fitted
GID
5, 19–37, 2015Global trends of drought severity
index
P. I. Orvos et al.
Title Page
Abstract Introduction
Conclusions References
Tables Figures
◭ ◮
◭ ◮
Back Close
Full Screen / Esc
Printer-friendly Version Interactive Discussion
Discussion
P
a
per
|
Discussion
P
a
per
|
Discussion
P
a
per
|
Discussion
P
a
per
|
Figure 2.Significance analysis of fitted slopes by using test sets of randomly shuffled whole year DSI records. The ensemble means and standard deviations are plotted for 10 sites along latitude 30.025◦S, evenly spaced by 0.05◦westward starting from 63.775◦W. Test set sizes are
100 (black circles), 1000 (red squares), 10 000 (orange diamonds), and 100 000 (blue stars). Maroon crosses indicate fitted slopes (DSI year−1
GID
5, 19–37, 2015Global trends of drought severity
index
P. I. Orvos et al.
Title Page
Abstract Introduction
Conclusions References
Tables Figures
◭ ◮
◭ ◮
Back Close
Full Screen / Esc
Printer-friendly Version Interactive Discussion
Discussion
P
a
per
|
Discussion
P
a
per
|
Discussion
P
a
per
|
Discussion
P
a
per
|
Figure 3.Histogram of all fitted slopes (blue) over the continents, where DSI data are available (4 914 440 locations). Its is clearly not a Gaussian (note the logarithmic vertical scale), the global mean value is −0.00875±0.04971 DSI year−1
GID
5, 19–37, 2015Global trends of drought severity
index
P. I. Orvos et al.
Title Page
Abstract Introduction
Conclusions References
Tables Figures
◭ ◮
◭ ◮
Back Close
Full Screen / Esc
Printer-friendly Version Interactive Discussion
Discussion
P
a
per
|
Discussion
P
a
per
|
Discussion
P
a
per
|
Discussion
P
a
per
|
Figure 4.Geographic distribution of sites where DSI trends are significant at 2σor higher level.
Linear trend slopes in units of DSI year−1
GID
5, 19–37, 2015Global trends of drought severity
index
P. I. Orvos et al.
Title Page
Abstract Introduction
Conclusions References
Tables Figures
◭ ◮
◭ ◮
Back Close
Full Screen / Esc
Printer-friendly Version Interactive Discussion
Discussion
P
a
per
|
Discussion
P
a
per
|
Discussion
P
a
per
|
Discussion
P
a
per
|
Figure 5.Zoom to South America at the highest spatial resolution of 0.05◦
×0.05◦. Trends in
GID
5, 19–37, 2015Global trends of drought severity
index
P. I. Orvos et al.
Title Page
Abstract Introduction
Conclusions References
Tables Figures
◭ ◮
◭ ◮
Back Close
Full Screen / Esc
Printer-friendly Version Interactive Discussion
Discussion
P
a
per
|
Discussion
P
a
per
|
Discussion
P
a
per
|
Discussion
P
a
per
|
30 S
o55 W
oGID
5, 19–37, 2015Global trends of drought severity
index
P. I. Orvos et al.
Title Page
Abstract Introduction
Conclusions References
Tables Figures
◭ ◮
◭ ◮
Back Close
Full Screen / Esc
Printer-friendly Version Interactive Discussion
Discussion
P
a
per
|
Discussion
P
a
per
|
Discussion
P
a
per
|
Discussion
P
a
per
|
Figure 7.Zoom to the Indian Peninsula at the highest spatial resolution of 0.05◦
×0.05◦. Trends
in units of DSI year−1
GID
5, 19–37, 2015Global trends of drought severity
index
P. I. Orvos et al.
Title Page
Abstract Introduction
Conclusions References
Tables Figures
◭ ◮
◭ ◮
Back Close
Full Screen / Esc
Printer-friendly Version Interactive Discussion
Discussion
P
a
per
|
Discussion
P
a
per
|
Discussion
P
a
per
|
Discussion
P
a
per
|
Figure 8. (a)Locations of two weather stations embedded in an apparently wetting region in Eastern Spain: Tortosa (40.82◦N, 0.48◦E) and Zaragoza (41.65◦N, 1.00◦W). (b)Daily mean